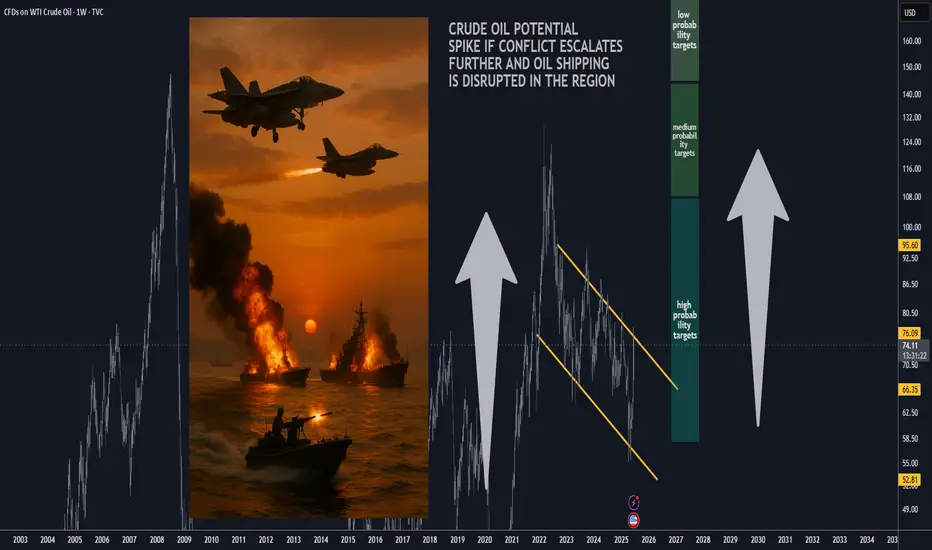
Can Crude Oil Spike to 150 USD / bbl ? Scenario Analysis.With Mid East tensions rising and overall unpredictable
situation around Strait of Hormuz, let's review potential
scenarios for the Crude Oil Prices. I've outlined three
scenarios with projected oil prices for each scenario below.
🚨 Market Alert: Israel-Iran Conflict Impact Forecast 📈
🔴 Worst-Case Scenario: Regional War + U.S. Military Involvement
🚢 Oil (Brent): Soars to $150–$200+ if Strait of Hormuz closes
🥇 Gold: Skyrockets to $4,500–$5,000 (safe-haven rush)
₿ Bitcoin: Initial volatility; settles at $80k–$100k
📉 SPX: Crashes to 4,000–4,500
💻 NDX: Drops sharply to 15,000–16,000
🟠 Base-Case Scenario: Protracted Tension, No Major Disruption
🛢 Oil: Stabilizes at elevated $75–$95, occasional spikes
🥇 Gold: Moves higher, trading $3,500–$3,800
₿ Bitcoin: Trades steady, $90k–$110k range
📊 SPX: Pullback moderate, around 5,200–5,500
💻 NDX: Moderately lower, 18,000–19,000 range
🟢 Best-Case Scenario: Diplomatic De-Escalation
🌊 Oil: Eases down to $65–$75
🥇 Gold: Mild decline, holds at $3,300–$3,500
₿ Bitcoin: Positive sentiment, lifts to $100k–$120k
📈 SPX: Slight dip; stays strong near 5,800–6,200
💻 NDX: Minor correction, remains high at 20,000–22,000
USOIL trade ideas
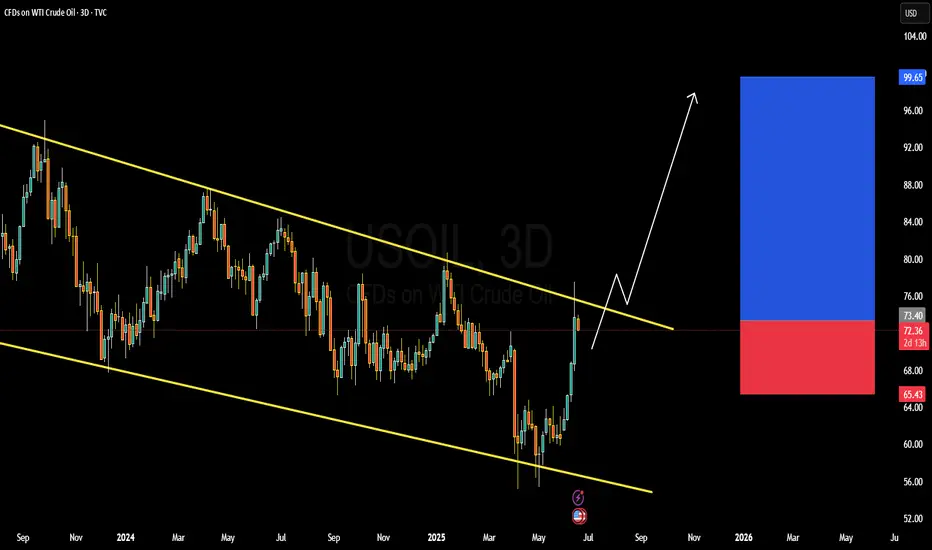
USOIL FUNDAMENTALS AND TECHNICALS USOIL (WTI Crude) is currently trading near the 72.00 level and is setting up for a potential breakout from a long-standing descending channel on the higher time frame (3D chart). Price has approached the upper boundary of this bearish channel after a strong bullish rally in recent sessions. This indicates growing bullish momentum, and any sustained breakout above the descending trendline could open the path toward the 98.00 zone, a major structural target based on previous price action and Fibonacci projections.
The recent bullish surge in crude oil prices has been fueled by a combination of supply-side constraints and renewed optimism around global demand. OPEC+ continues to show discipline in supply management, and geopolitical tensions in oil-producing regions are adding risk premiums. Furthermore, the Fed’s recent signals of a potential pause in tightening, combined with an improving outlook for Chinese demand recovery, are creating a supportive environment for commodities, particularly oil. These fundamental tailwinds align with the technical structure hinting at an upside breakout.
Technically, USOIL has broken back above a critical mid-channel support level and is now challenging the descending resistance line. The most recent impulsive candles suggest strong buyer conviction. If this momentum holds, we could see a retest followed by continuation toward the 98.00 psychological level. The structure also supports a higher low formation, which is another bullish signal for long-term traders watching the macro channel breakout.
From a trading standpoint, this setup is high probability with a well-defined invalidation zone below 65.00. The confluence of macro catalysts, technical breakout formation, and seasonal demand trends makes this a compelling bullish opportunity. I am closely monitoring price action for confirmation to go long on the breakout and ride the potential wave toward the upper supply region near 98.00.
U
Oil’s Reaction to Geopolitical DevelopmentsOil’s Reaction to Geopolitical Developments
We must be cautious when trading oil.
Despite the unexpected attack by Israel on Iran last week, gold prices did not rise beyond $77.50.
In my view, oil prices remain largely under the influence of the U.S. and OPEC+, with Trump opposing any significant price increase.
Iran ranks as one of the world's top oil producers, holding the fifth position in daily output. However, it is surprising that prices did not exceed $77.50, especially considering past instances of major price surges during the Russia-Ukraine war.
Even if oil rebounds toward $80, this movement could be purely speculative, with a high likelihood of a pullback, as indicated by the technical chart.
Key target zones: 67.00 ; 64 and 56.50
You may find more details in the chart!
Thank you and Good Luck!
❤️PS: Please support with a like or comment if you find this analysis useful for your trading day❤️

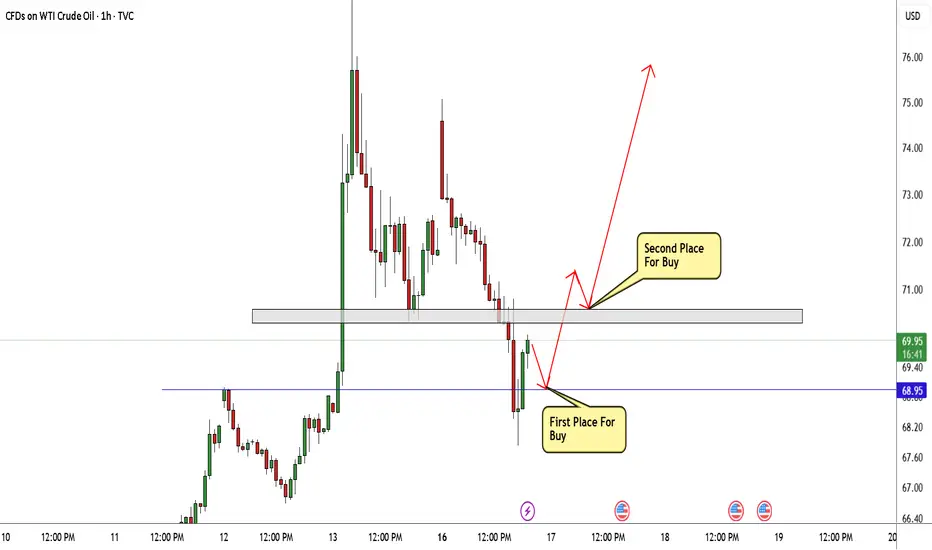
OIL 2 Best Places For Buy Very Clear , Don`t Miss This 1000 PipsHere is my opinion on oil , we have a very aggressive movement to upside and this is normal right now , i`m looking to buy this Pair if the price go back to retest my support and this will be the best place to buy it for me , and if the price moved directly without retest it i will wait the price to break the other res and then i can enter a buy trade and targeting the highest level the price touch it , also if the price go back to retest my support and go up and closed above the other res i will add one more entry with the same target.
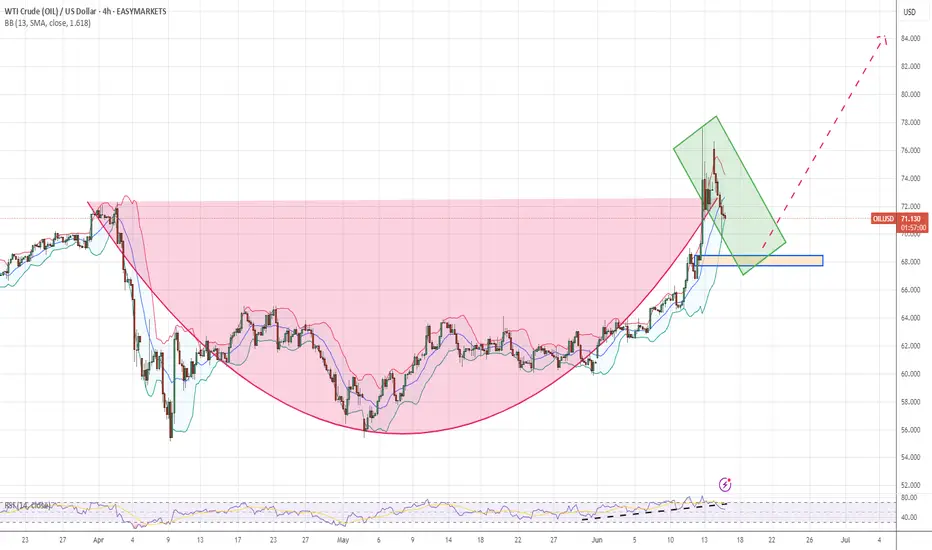
Crude oil bullish expectations4-hour cycle, interesting cup-handle pattern
Pay attention to the reversal signal of the 4-hour demand zone
WTI Crude Oil Regains Bullish MomentumWTI Crude Oil Regains Bullish Momentum
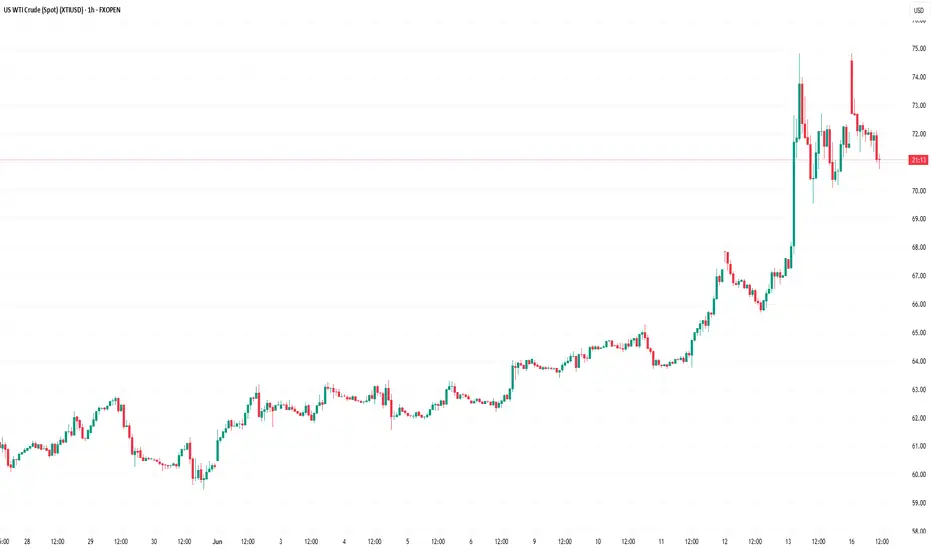
WTI Crude oil prices climbed higher above $70.00 and might extend gains.
Important Takeaways for WTI Crude Oil Price Analysis Today
- WTI Crude oil prices started a decent increase above the $65.00 and $68.50 resistance levels.
- There is a major bullish trend line forming with support at $71.50 on the hourly chart of XTI/USD at FXOpen.
Oil Price Technical Analysis
On the hourly chart of WTI Crude Oil at FXOpen, the price started a decent upward move from $65.00 against the US Dollar. The price gained bullish momentum after it broke the $68.50 resistance and the 50-hour simple moving average.
The bulls pushed the price above the $69.50 and $71.50 resistance levels. The recent high was formed at $74.80 and the price started a downside correction. There was a minor move below the 50% Fib retracement level of the upward move from the $69.55 swing low to the $74.83 high.
The RSI is now below the 60 level. Immediate support on the downside is near the $71.50 zone. There is also a major bullish trend line forming with support at $71.50 and the 61.8% Fib retracement level of the upward move from the $69.55 swing low to the $74.83 high.
The next major support on the WTI crude oil chart is near the $69.50 zone, below which the price could test the $67.90 level. If there is a downside break, the price might decline toward $65.20. Any more losses may perhaps open the doors for a move toward the $63.75 support zone.
If the price climbs higher again, it could face resistance near $72.50. The next major resistance is near the $74.80 level. Any more gains might send the price toward the $78.50 level.
This article represents the opinion of the Companies operating under the FXOpen brand only. It is not to be construed as an offer, solicitation, or recommendation with respect to products and services provided by the Companies operating under the FXOpen brand, nor is it to be considered financial advice.
USOIL - BULLISH MOVE !Hello Traders !
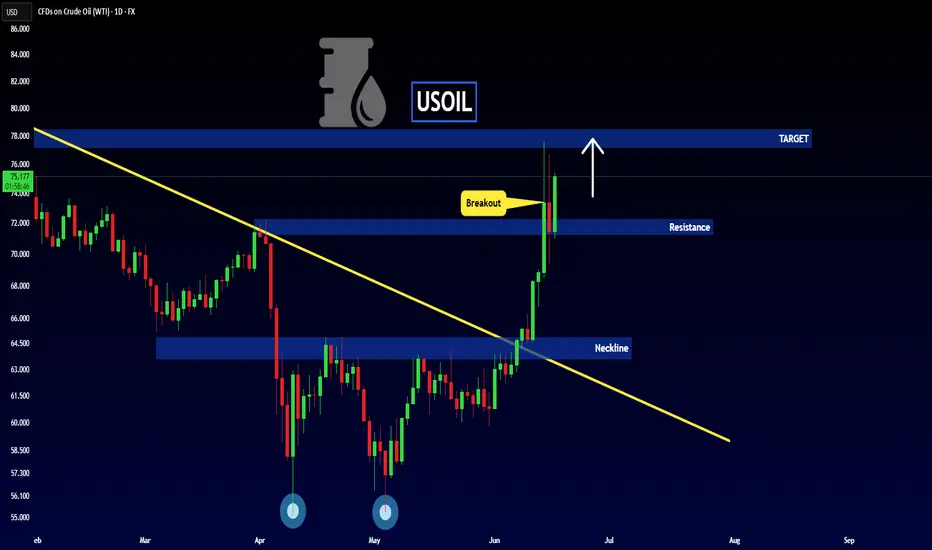
Previously, The USOIL price formed a double bottom pattern.
Currently, The resistance (71.280 - 72.252) is broken !
So, I expect a bullish move🚀
______________
TARGET: 77.200🎯
Strait of Hormuz risk priced in—or not yet?Iran has repeatedly threatened to block the Strait of Hormuz during periods of heightened tension with the U.S., notably in 2011, 2018, and 2020. The Strait is considered the world’s most critical oil chokepoint, with nearly 20 million barrels passing through daily.
Several banks warn that a full closure could push crude prices above $120–$150 per barrel, or higher if the disruption is prolonged. Still, most analysts view a complete shutdown as unlikely, since Iran also depends on the Strait to export its own oil.
Technically, recent WTI candles suggest that the risk premium may be fading. Price action near $74 shows hesitation, raising the risk of a developing double top—particularly if support at $70 fails. Unless tensions escalate materially, such as the U.S. becoming more directly involved, WTI may consolidate between $70–$74.
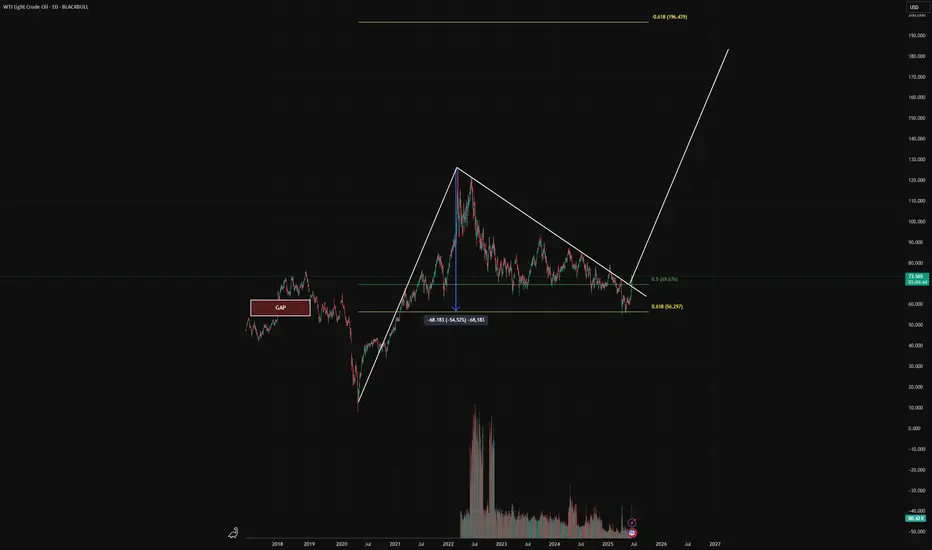
WW3 Scenario - Bull flag potentialWe bottomed at the gap fill at $57, a long term target I had been expecting. A bullish retest at the golden pocket followed, now all we need is a clean break above $80 to end the lower high downtrend. I don't want to comment on politics, but suffice to say the price of oil will tell us what's really going on. A supply shock has the potential to send oil to the $200 level. I don't know what the world will look like in that scenario, but I can assure you it will be a global catastrophe. Inflation will reignite, the interest rates will likely go up.
This is the single most important chart to be watching now. Forget Apple, forget Nvidia. Oil and the DXY is where the chart will reveal the news. Pay attention!
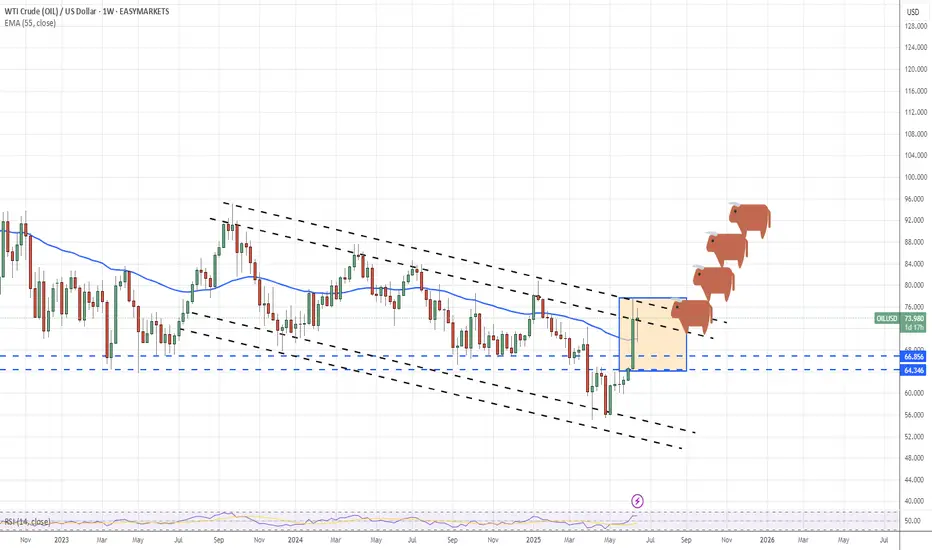
Weekly crude oil chart shows continued bullish outlook.Last week's candlestick chart closed with a strong bullish candle at the channel's upper boundary. This week's close formed a pin bar.
Two consecutive weeks of candlestick patterns.Creating a Harami pattern
Strong bullish signals
Patiently observe market developments.
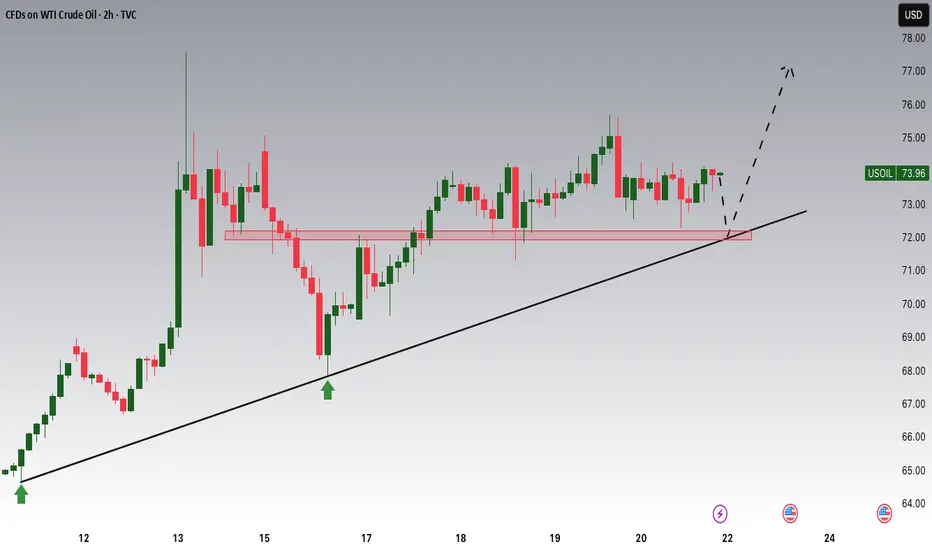
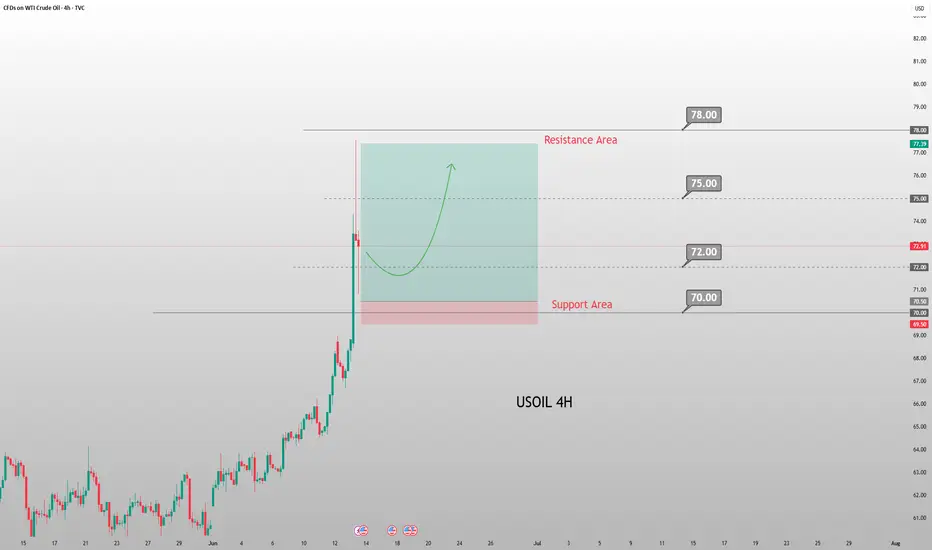
USOIL Potential UpsidesHey Traders, in tomorrow's trading session we are monitoring USOIL for a buying opportunity around 72.00 zone, USOIL is trading in an uptrend and currently is in a correction phase in which it is approaching the trend at 72 support and resistance area.
Trade safe, Joe.
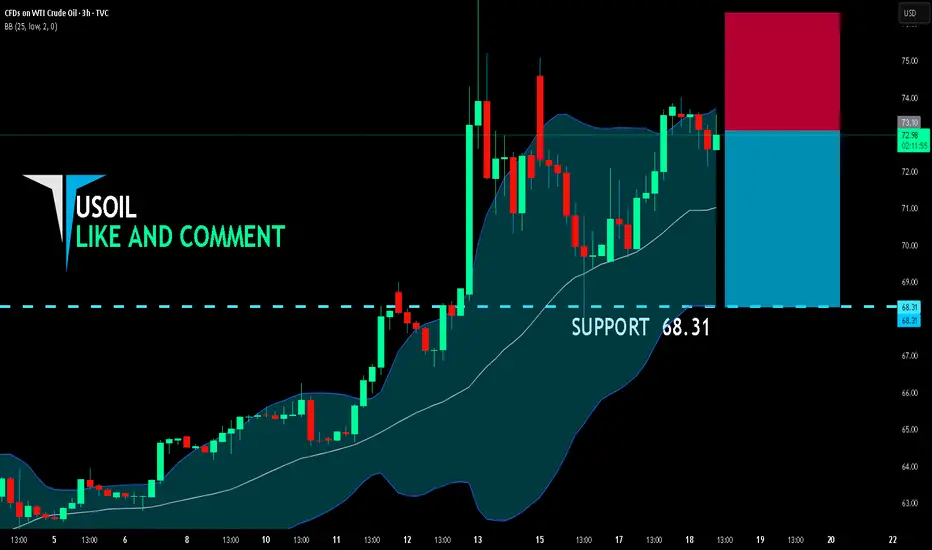
USOIL BEARS WILL DOMINATE THE MARKET|SHORT
USOIL SIGNAL
Trade Direction: short
Entry Level: 73.10
Target Level: 68.31
Stop Loss: 76.29
RISK PROFILE
Risk level: medium
Suggested risk: 1%
Timeframe: 3h
Disclosure: I am part of Trade Nation's Influencer program and receive a monthly fee for using their TradingView charts in my analysis.
✅LIKE AND COMMENT MY IDEAS✅
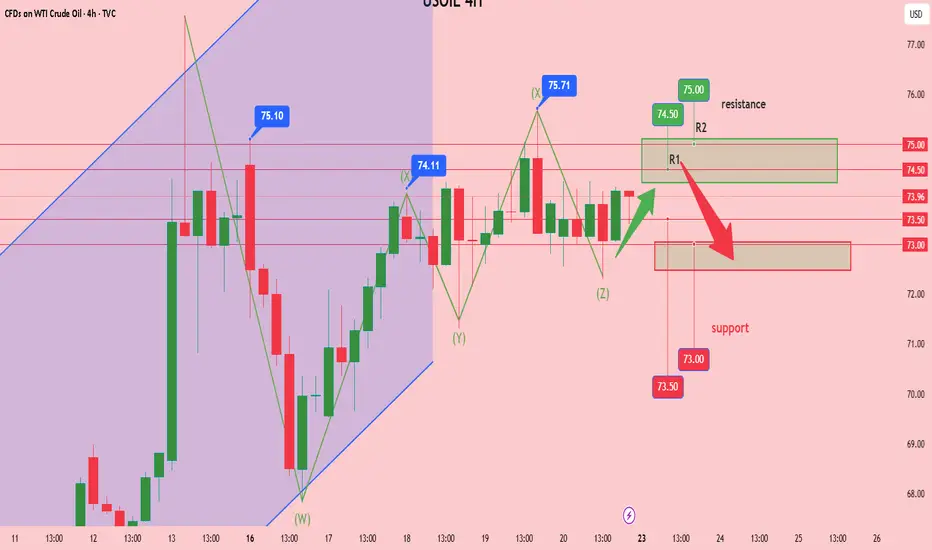
Analysis of crude oil trend next week, hope it helps youThe Middle East currently resembles a barrel filled with gunpowder, ready to explode at any moment. Israel and Iran continue to attack each other—Israel bombed Iran's nuclear facilities, while Iran fired missiles at Israeli cities. More worryingly, the U.S. may decide to join the conflict within the next two weeks, and five U.S.-UK aircraft carriers are converging on the Middle East, akin to lighting a match beside the powder keg. However, Iran has also held talks with European nations in Geneva, stating that if Israel halts its attacks first, it is willing to discuss nuclear issues. This creates a paradox: while the risk of war grows, there is also hope for negotiations—similar to two market factions, one fearing war will drive oil prices higher, and the other believing talks could push prices down.
The Strait of Hormuz, a critical global oil transport corridor, sees massive oil shipments pass through daily. Iran has repeatedly threatened to block the strait, and if it does, oil prices could skyrocket like a rocket. So far, however, Iran has not taken such action, and the market is watching closely to see if it will.
Trading Strategy
If oil prices rebound to the $74.5–$75 range and candlestick charts show prices stalling (forming consecutive long upper shadows) with trading volume decreasing rather than increasing, consider opening light short positions with 25% of funds. When prices retreat to $73.5, close 40% of short positions to take profits. If prices continue to fall, hold the remaining short positions for a target of $72.5. However, if prices break through $76, immediately trigger a stop loss to prevent further losses from a potential upward trend.
Analysis of crude oil trend next week, hope it helps you
USOIL sell@74.5~75
SL:76
TP:73.5~73
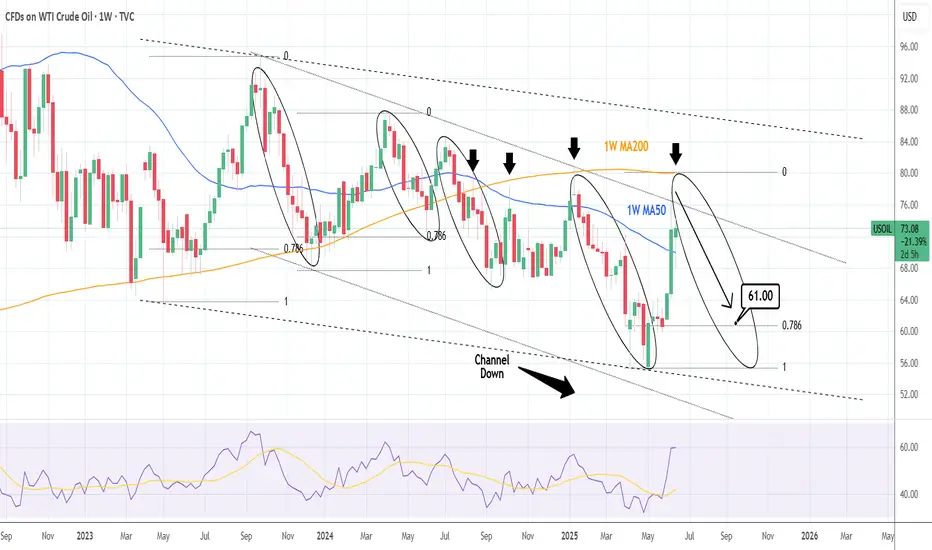
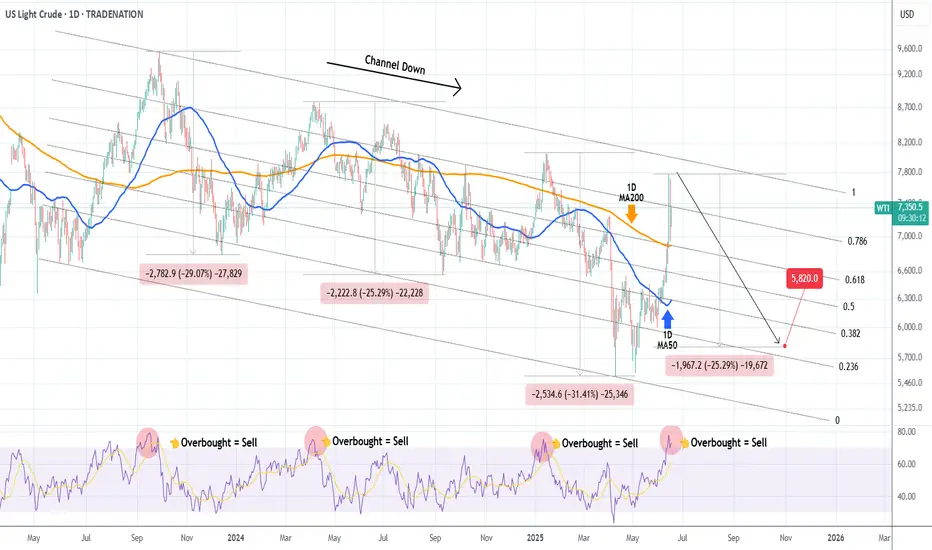
WTI CRUDE OIL: There is no better time to sell that this.WTI Crude Oil has turned overbought on its 1D technical outlook (RSI = 71.048, MACD = 2.830, ADX = 41.529) and this is technically the most efficient level to sell on the long term. Not only is that the top of the dotted Channel Down but last week the price got very close to the 1W MA200, which has produced the last 3 major rejections since the week of August 12th 2024. Technically the market still has some room to move upwards and test it but since it rose purely on the latest Middle East conflict, it is more likely than not to see an equally quick price deflation and rebalancing. The earlier bearish waves (September 2023 onwards), initially targeted the 0.786 Fibonacci level and then bounced. That translates to TP = 61.00 (at least) towards the end of the year.
See how our prior idea has worked out:
## If you like our free content follow our profile to get more daily ideas. ##
## Comments and likes are greatly appreciated. ##
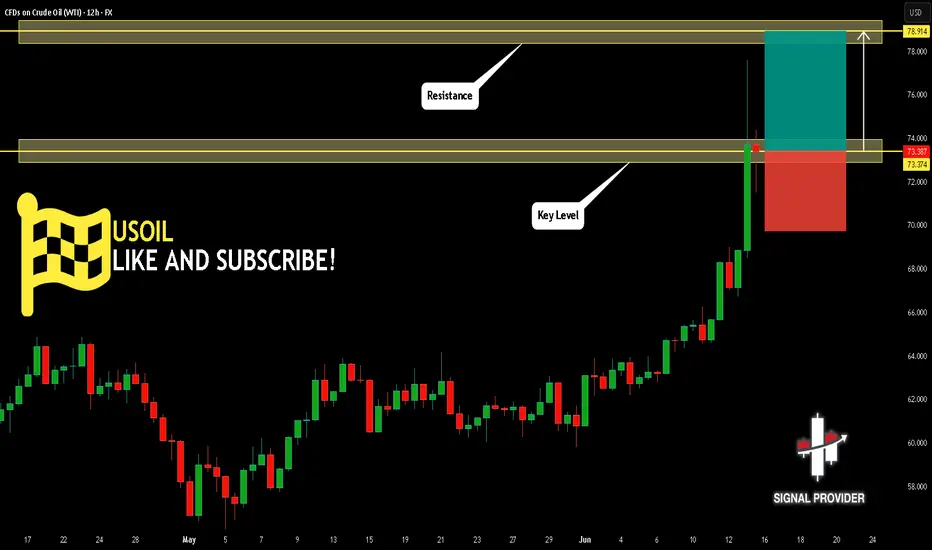
USOIL Will Go Up From Support! Long!
Please, check our technical outlook for USOIL.
Time Frame: 12h
Current Trend: Bullish
Sentiment: Oversold (based on 7-period RSI)
Forecast: Bullish
The price is testing a key support 73.374.
Current market trend & oversold RSI makes me think that buyers will push the price. I will anticipate a bullish movement at least to 78.914 level.
P.S
The term oversold refers to a condition where an asset has traded lower in price and has the potential for a price bounce.
Overbought refers to market scenarios where the instrument is traded considerably higher than its fair value. Overvaluation is caused by market sentiments when there is positive news.
Disclosure: I am part of Trade Nation's Influencer program and receive a monthly fee for using their TradingView charts in my analysis.
Like and subscribe and comment my ideas if you enjoy them!
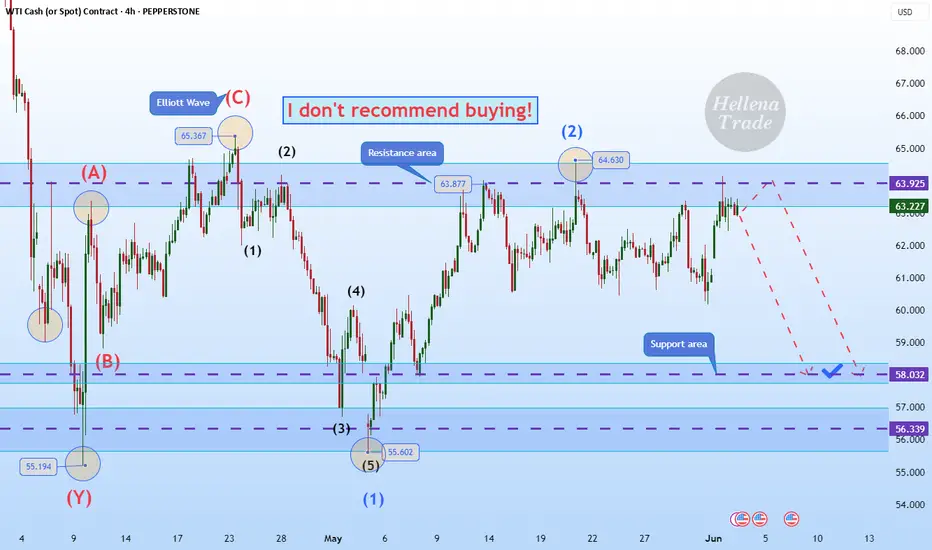
Hellena | Oil (4H): SHORT to support area of 58.00.Colleagues, the previous forecast did not meet expectations for too long, and the price has been in a prolonged sideways movement.
In this regard, I decided to slightly revise the waves and make a new forecast.
At the moment, I believe that the price will resume its downward movement in the medium-term wave “3.” The complex configuration of the correction makes it difficult to fully understand whether it is a combined correction or a five-wave movement.
In either case, I expect the price to reach the support area of 58.00.
Manage your capital correctly and competently! Only enter trades based on reliable patterns!
WTI OIL Overbought RSI = best time to sell!WTI Oil (USOIL) has been trading within a 2-year Channel Down pattern and due to the recent Middle East geopolitical tensions, the price catapulted near its top (Lower Highs trend-line).
That made the 1D RSI overbought (>70.00) and every time that took place since September 2023, the pattern priced its Lower High and started a Bearish Leg. As a result, an overbought 1D RSI reading has been the strongest sell signal in the past 2 years.
The 'weakest' Bearish Leg after such sell signal has been -25.29%. As a result, we have turned bearish on WTI again, targeting $58.20 (-25.29%).
-------------------------------------------------------------------------------
** Please LIKE 👍, FOLLOW ✅, SHARE 🙌 and COMMENT ✍ if you enjoy this idea! Also share your ideas and charts in the comments section below! This is best way to keep it relevant, support us, keep the content here free and allow the idea to reach as many people as possible. **
-------------------------------------------------------------------------------
Disclosure: I am part of Trade Nation's Influencer program and receive a monthly fee for using their TradingView charts in my analysis.
💸💸💸💸💸💸
👇 👇 👇 👇 👇 👇
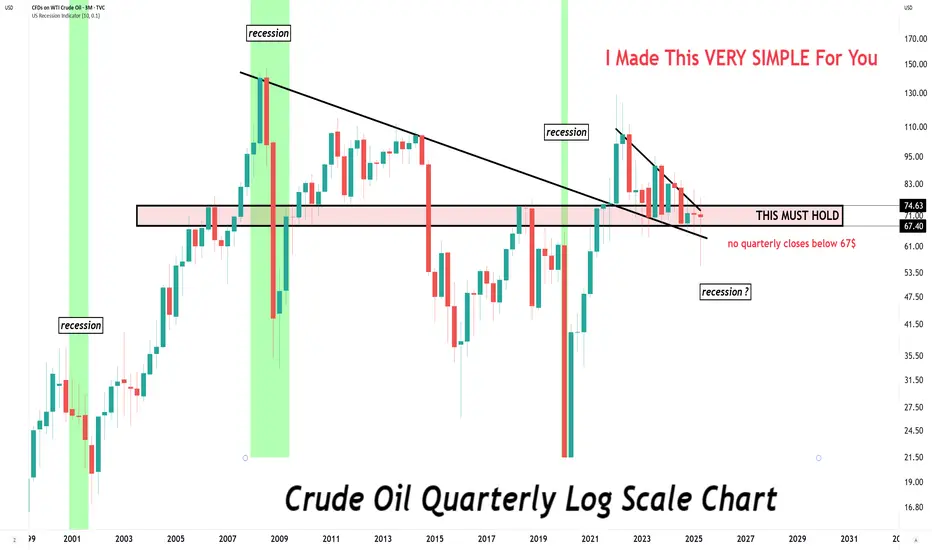
Crude oil bottom?Crude oil was in big trouble back in April, just 2 months ago.
And just like that, the quarterly chart does its magic and reduced so much noise!
What looked like a critical breakdown, has now reversed, leaving an impressive lower wick on the candle!
Today's Crude Oil Trend Analysis and Trading RecommendationsFrom a daily chart perspective, the violent rally in USOIL driven by external factors has completely disrupted prior technical expectations. The sharp surge has also significantly exhausted future upside potential, explaining today's gap-up and subsequent decline. With minimal likelihood of near-term de-escalation in the Iran situation, USOIL is likely to remain bullish. However, severe overbought conditions on technical charts have disrupted structural expectations, necessitating a price correction.
Technically, the $70-$75 range serves as a reasonable short-term consolidation zone, contingent on no severe escalation in Iran tensions. Given the high probability of worsening tensions, USOIL may retest $75 and even challenge $80 driven by geopolitical developments.
Thus, while the market remains focused on Iran-related risks, the short-term bias remains bullish. Avoid chasing the rally recklessly. Focus on the $70.5-$71.5 pullback zone early in the week—consider long entries only after price consolidation in this area.
USOIL
buy@70.50-71.50
tp:74-76-78
Investment itself is not the source of risk; it is only when investment behavior escapes rational control that risks lie in wait. In the trading process, always bear in mind that restraining impulsiveness is the primary criterion for success. I share trading signals daily, and all signals have been accurate without error for a full month. Regardless of your past profits or losses, with my assistance, you have the hope to achieve a breakthrough in your investment.
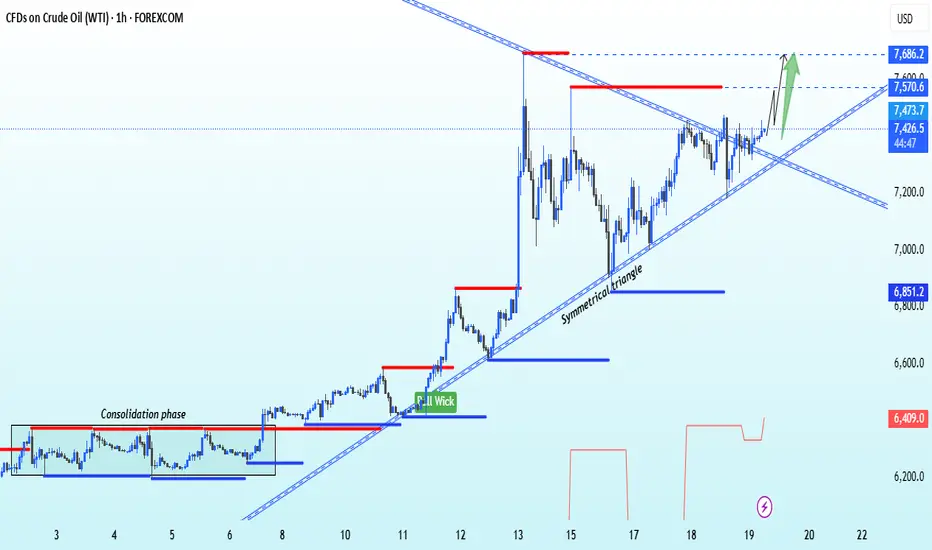
USOIL Bullish breakout from symmetrical triangle pattern🚨 USOIL Breakout Alert! 🚨
1H Time Frame | Symmetrical Triangle Breakout
Crude oil (USOIL) has broken out bullishly from a symmetrical triangle pattern — confirming strong upward momentum. 📈
🎯 Entry Level: 74.20
📍 Technical Targets:
1st Resistance: 75.70
2nd Resistance: 76.80
This setup signals a potential continuation of bullish momentum. Keep an eye on volume confirmation and price action near resistance levels.
💬 Drop your thoughts in the comments!
📲 Like, follow, and join us for more real-time market insights.
Trade smart
,
– Livia 😜
Massive Oil Move Incoming? Only One Thing Can Stop ItOIL – Overview
Oil Rallies to 5-Month High as Israel-Iran Tensions Escalate
Oil prices surged to a five-month high early Wednesday amid escalating conflict between Israel and Iran. The ongoing airstrikes between the two nations, along with reports that the Trump administration is considering military involvement, have intensified concerns over a broader regional war.
Since Israel launched a surprise strike on Iran last week targeting nuclear sites, oil has risen nearly 10%, fueled by fears of potential supply disruptions. President Trump has publicly called for Iran's "unconditional surrender," signaling heightened geopolitical risk.
Despite the ongoing conflict, Iran's oil exports remain largely unaffected, and the country has not yet disrupted shipping through the Persian Gulf — a critical route supplying around 20% of global oil demand. However, markets remain on edge over the potential for further escalation that could directly impact supply.
Technical Outlook:
Oil maintains bullish momentum as long as it trades above 72.21, with upside targets at:
➡️ 77.21
➡️ 79.50 — key breakout level
➡️ 85.40 — next resistance zone
➡️ Potential extension to 88.40 if momentum continues
🔻 A shift to bearish sentiment is only likely if negotiations begin between Iran and Israel, signaling potential de-escalation.
Key Levels:
• Pivot: 73.20
• Resistance: 77.21 / 79.50 / 85.40
• Support: 69.55 / 68.33 / 66.03
Caution: Any signs of de-escalation or negotiations between Iran and Israel could quickly reverse the trend.

The best opportunity is when crude oil falls
💡Message Strategy
Crude oil futures fell in the European session on Monday (June 16), giving up earlier gains, as a new round of hostilities between Israel and Iran had limited impact on oil production and exports.
WTI briefly rebounded to $77.49, close to last week's high, which was also our second profit target, but failed to break through the key resistance level near $78.09.
Oil prices surged 7% on Friday, driven by geopolitical risks, pushing crude to its highest level since January. However, Monday's reversal reflected the lack of immediate threats to supply routes, especially the strategically important Strait of Hormuz.
If Iran's production drops sharply due to the conflict, the global oil supply buffer will be quickly exhausted and oil prices may usher in a new round of surges. Faced with this complex situation, investors, oil-producing countries and consumers need to be prepared to meet the possible energy storm.
This is also the reason why we repeatedly emphasize that crude oil should be long when it falls. We can foresee its upward momentum, and the pullback is only in a moment without any signs.
📊Technical aspects
The short-term (1H) trend of crude oil continued to fluctuate upward, and the price near 74 was tested. The moving average system relies on the bullish arrangement of oil prices, and the short-term objective trend direction remains upward.
In the morning, the oil price hit a new high near 75.30, and then fell back and closed with a negative real candlestick. The short-term momentum is still bullish, and it is expected that the trend of crude oil will continue to maintain a high-level oscillating upward rhythm.
💰 Strategy Package
Long Position:69.50-70.50
The first target is around 73.00
The second target is around 75.00

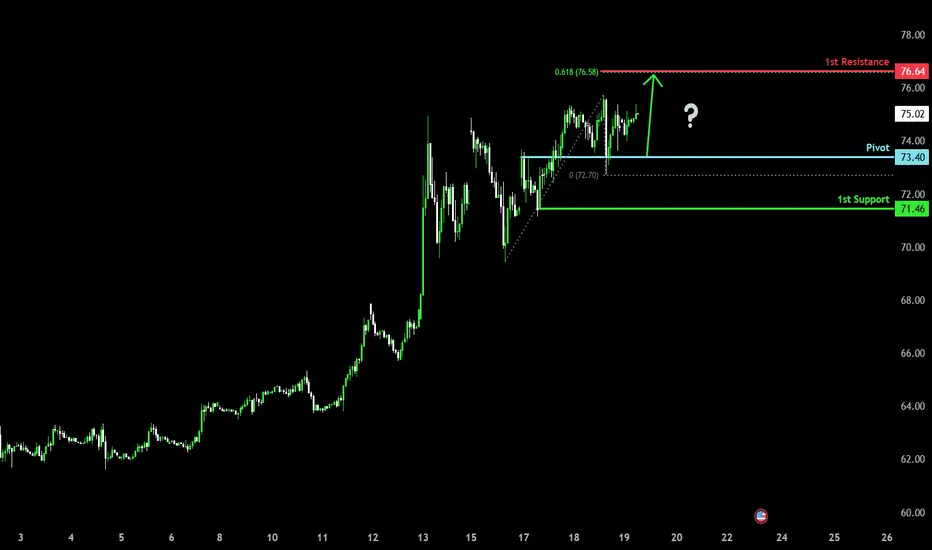
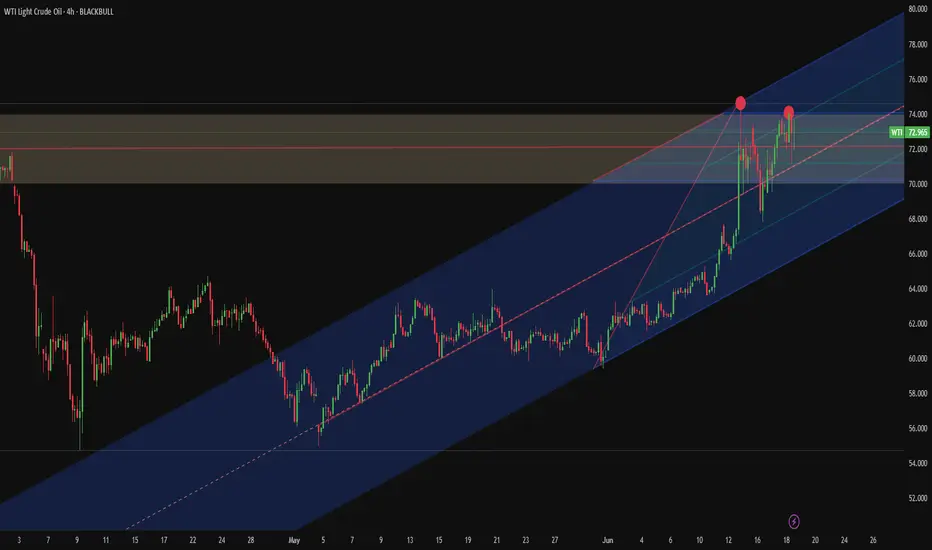
Bullish momentum to extend?WTI Oil (XTI/USD) has bounced off the pivot and could potentially rise to the 1st resistance.
Pivot: 73.40
1st Support: 71.46
1st Resistance: 76.64
Risk Warning:
Trading Forex and CFDs carries a high level of risk to your capital and you should only trade with money you can afford to lose. Trading Forex and CFDs may not be suitable for all investors, so please ensure that you fully understand the risks involved and seek independent advice if necessary.
Disclaimer:
The above opinions given constitute general market commentary, and do not constitute the opinion or advice of IC Markets or any form of personal or investment advice.
Any opinions, news, research, analyses, prices, other information, or links to third-party sites contained on this website are provided on an "as-is" basis, are intended only to be informative, is not an advice nor a recommendation, nor research, or a record of our trading prices, or an offer of, or solicitation for a transaction in any financial instrument and thus should not be treated as such. The information provided does not involve any specific investment objectives, financial situation and needs of any specific person who may receive it. Please be aware, that past performance is not a reliable indicator of future performance and/or results. Past Performance or Forward-looking scenarios based upon the reasonable beliefs of the third-party provider are not a guarantee of future performance. Actual results may differ materially from those anticipated in forward-looking or past performance statements. IC Markets makes no representation or warranty and assumes no liability as to the accuracy or completeness of the information provided, nor any loss arising from any investment based on a recommendation, forecast or any information supplied by any third-party.