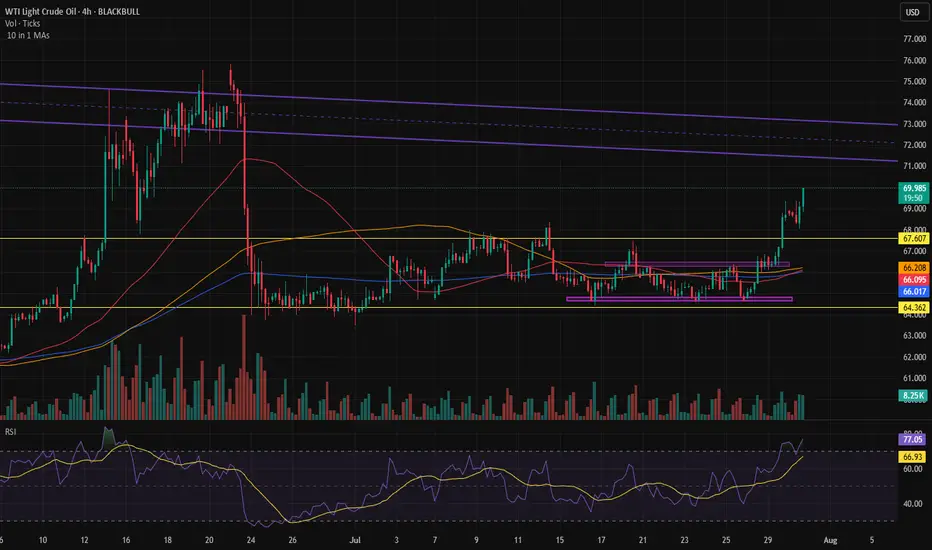
USOIL H4 bullish upward ⚠️ Disrupted Analysis – WTI Crude Oil (4H Chart)
🔻 Bearish Pressure Re-Entering
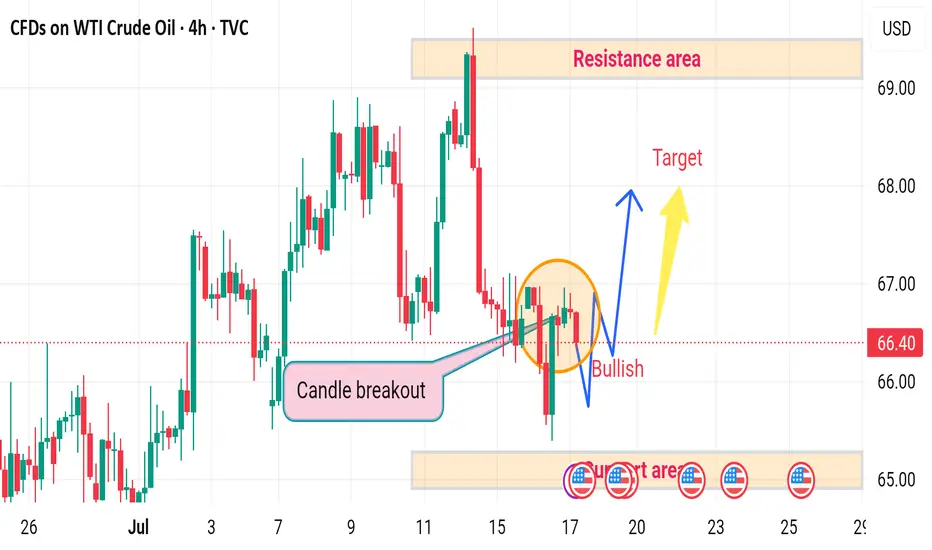
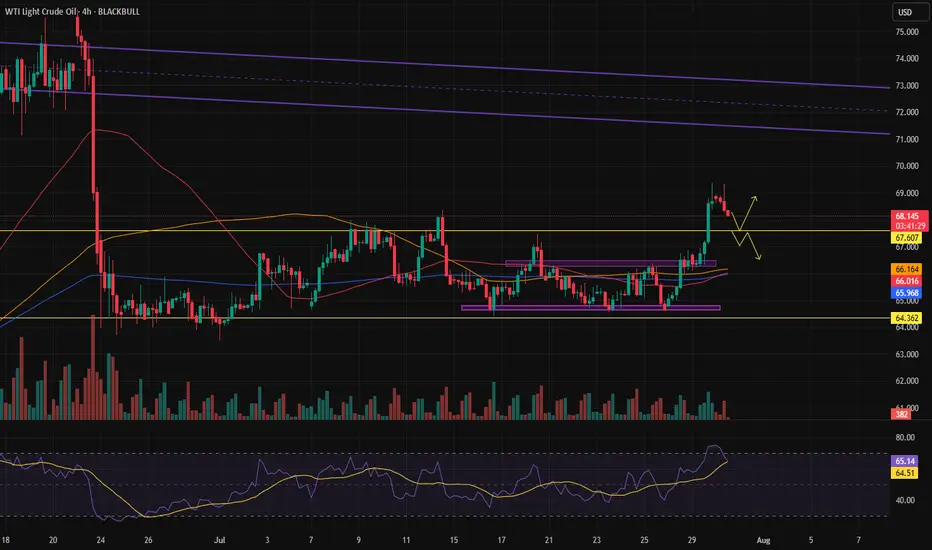
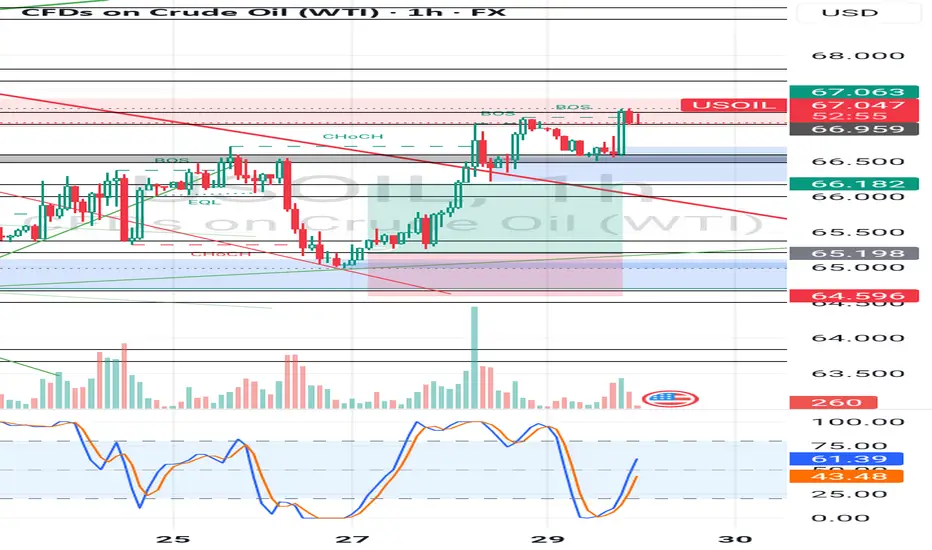
Despite a temporary candle breakout, the price failed to sustain above the breakout trendline.
The recent price action inside the orange circle shows lower highs and rejection wicks, indicating bullish weakness.
📉 Potential Breakdown Risk
If the price fails to hold above 66.00, there's a high probability of it breaking below the support area around 64.80–65.00, leading to:
Increased bearish momentum
Retesting lower demand zones, possibly around 63.50–64.00
❌ Resistance Area Still Valid
The Resistance area at 68.00–69.00 remains unchallenged.
The "Target" shown is optimistic under current momentum.
Without strong volume and bullish candles, that target remains unlikely in the near term.
🔁 Disruption Summary
The bullish breakout is likely a false breakout.
Market may be forming a bull trap.
Watch for a clean break below 65.00 for confirmation of a bearish reversal.
USOIL trade ideas
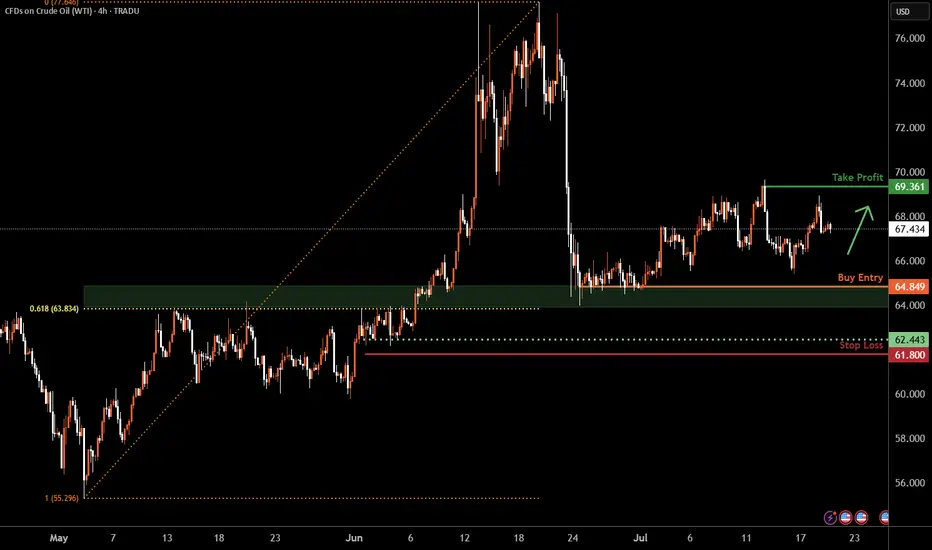
WTI Oil H4 | Falling toward a multi-swing-low supportWTI oil (USOIL) is falling towards a multi-swing-low support and could potentially bounce off this level to climb higher.
Buy entry is at 64.84 which is a multi-swing-low support that aligns closely with the 61.8% Fibonacci retracement.
Stop loss is at 61.80 which is a level that lies underneath a multi-swing-low support.
Take profit is at 69.36 which is a swing-high resistance.
High Risk Investment Warning
Trading Forex/CFDs on margin carries a high level of risk and may not be suitable for all investors. Leverage can work against you.
Stratos Markets Limited (tradu.com ):
CFDs are complex instruments and come with a high risk of losing money rapidly due to leverage. 66% of retail investor accounts lose money when trading CFDs with this provider. You should consider whether you understand how CFDs work and whether you can afford to take the high risk of losing your money.
Stratos Europe Ltd (tradu.com ):
CFDs are complex instruments and come with a high risk of losing money rapidly due to leverage. 66% of retail investor accounts lose money when trading CFDs with this provider. You should consider whether you understand how CFDs work and whether you can afford to take the high risk of losing your money.
Stratos Global LLC (tradu.com ):
Losses can exceed deposits.
Please be advised that the information presented on TradingView is provided to Tradu (‘Company’, ‘we’) by a third-party provider (‘TFA Global Pte Ltd’). Please be reminded that you are solely responsible for the trading decisions on your account. There is a very high degree of risk involved in trading. Any information and/or content is intended entirely for research, educational and informational purposes only and does not constitute investment or consultation advice or investment strategy. The information is not tailored to the investment needs of any specific person and therefore does not involve a consideration of any of the investment objectives, financial situation or needs of any viewer that may receive it. Kindly also note that past performance is not a reliable indicator of future results. Actual results may differ materially from those anticipated in forward-looking or past performance statements. We assume no liability as to the accuracy or completeness of any of the information and/or content provided herein and the Company cannot be held responsible for any omission, mistake nor for any loss or damage including without limitation to any loss of profit which may arise from reliance on any information supplied by TFA Global Pte Ltd.
The speaker(s) is neither an employee, agent nor representative of Tradu and is therefore acting independently. The opinions given are their own, constitute general market commentary, and do not constitute the opinion or advice of Tradu or any form of personal or investment advice. Tradu neither endorses nor guarantees offerings of third-party speakers, nor is Tradu responsible for the content, veracity or opinions of third-party speakers, presenters or participants.
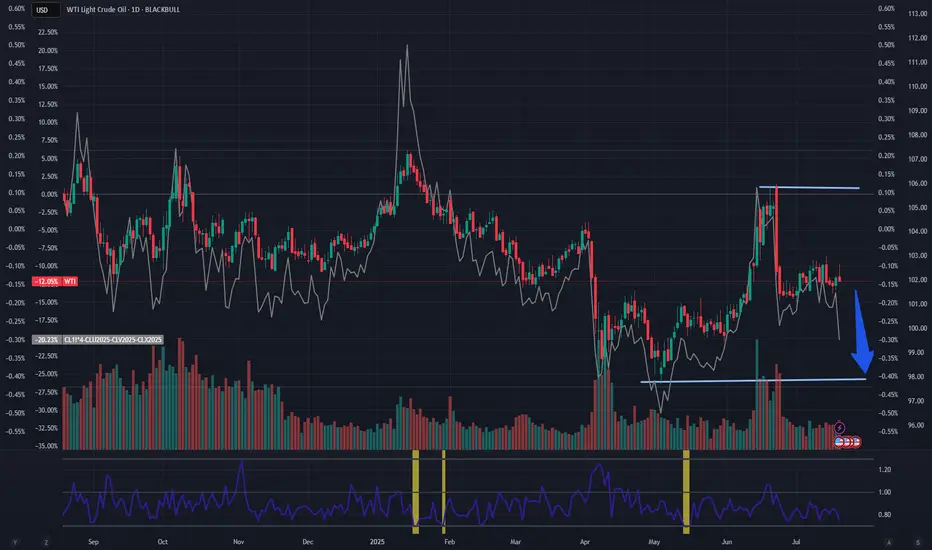
Oil Bearish for next weekOil will be bearish for next week. Toxic Sell and Calender spread shows the direction.
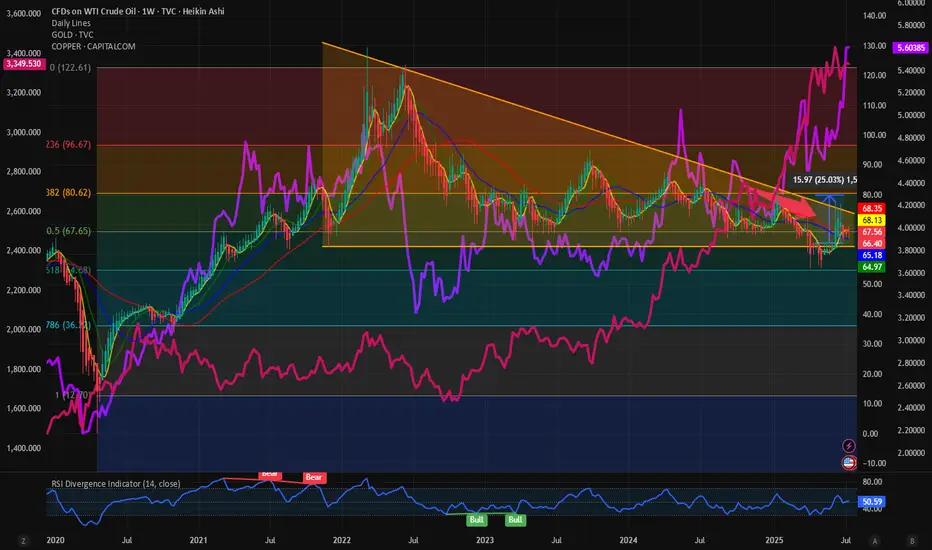
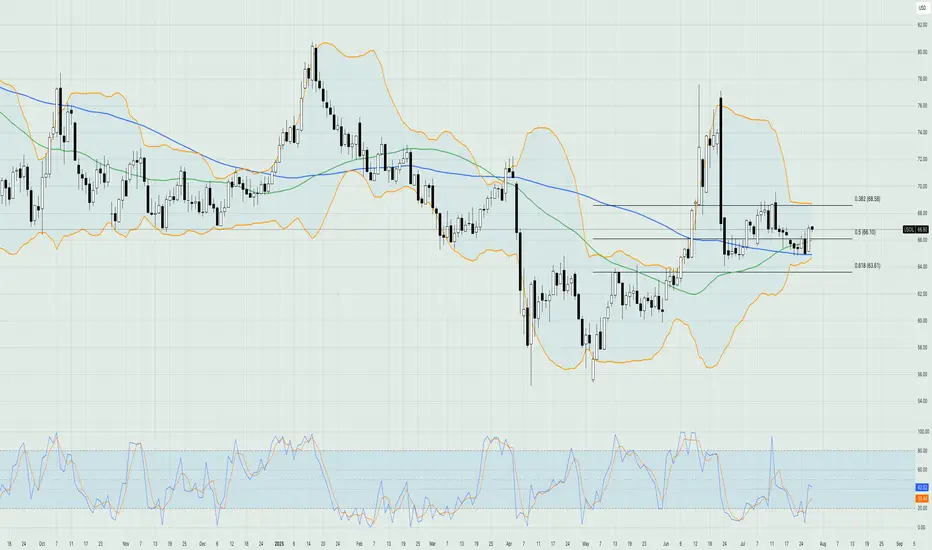
$USOIL: Will we see breakout or breakdown from this wedge? I have been watching the Commodity markets recently keenly to get direction or for market indications. AMEX:GLD , Copper and TVC:USOIL are the big 3 which determines the direction of commodity markets and hence the inflation. Inflation dictates direction of TVC:US10Y , TVC:DXY and hence the Equity markets. So, what are commodity markets telling us? With AMEX:GLD and OANDA:XCUUSD at ATH what does this mean for TVC:USOIL : TVC:USOIL Is in a bearish pattern and no sign of concrete bullish reversal on the commodity. Recently it has shown some signs of strength but still below its 0.5 Fib retracement level which is at 68 and we have time and again said that 0.318 Fib level at 80 $ might prove to be an upper resistance which will be difficult to breakout.
In the recent months whenever TVC:USOIL tries to break out of the 60 RSI sellers came back and pushed the prices down. Currently with RSI at 50 we might have some room for upside. Oil bulls can have a 20% upside in the RSI taking it to 60 which has historically proved to be a resistance. And a 20% upside in price is also possible with price hitting our 0.318 resistance level of 80%. Above that there is limited upside for $USOIL. The downward slopping wedge shown below indicates a breakout might be imminent which might take TVC:USOIL to 80 $ which is our highest target in this range bound market.
In contrast the bull run in other important commodities like AMEX:GLD and COPPER might have some legs as they are showing strength by breaking above the previous ATH. It is always a good idea to buy strength and ATH.
Verdict: TVC:USOIL remains range bound with 55 $ on lower bound and 80 on the upper bound. Commodity bulls can look at AMEX:GLD and OANDA:XCUUSD for better returns.
WTI USOIL As of July 19, 2025, the WTI crude oil price is hovering around $67.342 to $68.83 per barrel after attempting 77.52$ per barrel on Israel Iran conflict in the middle east. As a trader Make out time to look into OPEC WORLD OIL OUTLOOK(WOO) REPORT,SPR REPORT , this woo report provide comprehensive industry forecast and strategic petroleum reserve gives insight into united state energy status.
OPEC meetings are usually held in Vienna and involves discussions and agreement on oil production quotas affecting the global crude oil supply and prices.
oil sharply rose during Israel and Iran geopolitical tension and on the supply roof rejected AT 77.52$ PER BARREL ..
Supply remains cautiously controlled because price is influenced by demand and supply system , but global economic uncertainties and trade tensions, especially involving tariffs and sanctions, continue to influence oil demand expectations.
the US Strategic petroleum reserve (SPR) is the united states emergency crude oil stockpile managed by department of energy ,it act as a buffer to protect against significant supply disruption of oil market, the SPR holds hundreds of millions of barrels of crude oil stored in the underground salt caverns along the gulf coast.it can be tapped to stabilize the market during supply crises or emergencies .
the U.S government occasionally release oil from the SPR to ease supply shortage or control fuel prices coordinated with other countries through the international energy agency if need be.the status and release are regularly monitored as they affect global oil prices and energy security
Am holding WTI OIL low buy and will continue until the break of demand floor and might add more buy if the sentiment holds buy idea.
Trading OIL AND GAS is 100% probability , No one can tell the next crisis and global energy supply disruption.
Manage your risk.

USOIL Technical Analysis! BUY!
My dear followers,
This is my opinion on the USOIL next move:
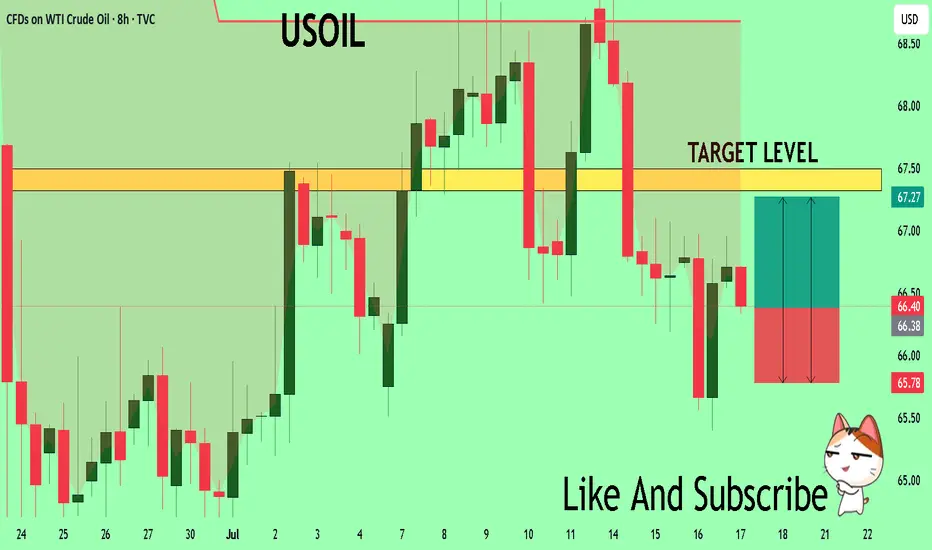
The asset is approaching an important pivot point 66.40
Bias - Bullish
Safe Stop Loss - 65.78
Technical Indicators: Supper Trend generates a clear long signal while Pivot Point HL is currently determining the overall Bullish trend of the market.
Goal - 67.32
About Used Indicators:
For more efficient signals, super-trend is used in combination with other indicators like Pivot Points.
Disclosure: I am part of Trade Nation's Influencer program and receive a monthly fee for using their TradingView charts in my analysis.
———————————
WISH YOU ALL LUCK
USOIL Technical Analysis – Black Mind Curve Breakout & Reversal🔍 Overall Market Context:
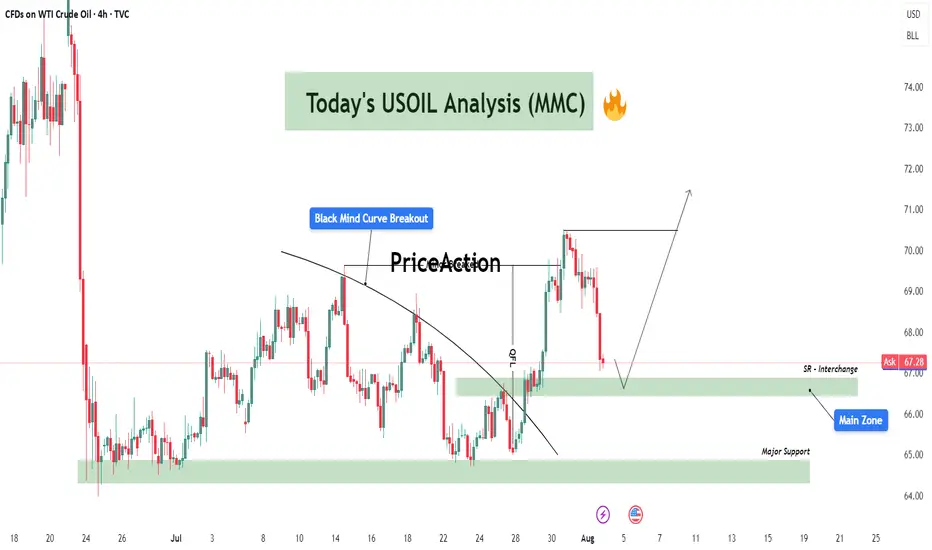
The current USOIL structure is a great example of market shift from compression to expansion, characterized by a breakout of the Black Mind Curve followed by a measured impulse move. This chart is not just reacting technically, but it reflects how institutional smart money manipulates curves, breaks minor structures, and then retests zones to refill orders before continuing directionally.
Let’s break the market psychology and price action phase by phase:
🔄 Phase 1: Black Mind Curve Breakout ✅
The Black Mind Curve represents long-standing supply pressure that had been capping price.
Its breakout marks a shift in market intention, often signaling the end of a distribution phase and beginning of a possible accumulation or re-accumulation.
Price broke above this curve cleanly with strong bullish candles, which also broke minor structure levels, confirming short-term bullish sentiment.
The breakout was also backed by momentum and volume as the market pushed 130+ pips upward—an aggressive impulse that trapped late sellers below.
📉 Phase 2: Retracement to Interchange Zones
Now, we’re in the retracement phase, where price is pulling back toward:
🔹 SR Interchange Zone ($66.80 - $67.30)
This zone was previous resistance, now flipping to support.
In MMC terms, this area is expected to serve as a refill zone where smart money will look to accumulate again after the breakout.
We are watching for confirmation candles or MMC-style reversal patterns here (e.g., inside bar breakouts, demand imbalances).
🔹 Main Zone ($65.80 - $66.50)
If the first zone fails, this is the next key demand base.
It holds historical value from previous accumulation phases (see July 10–25) and aligns with the origin of the last impulse.
Expect a sharper wick or deeper liquidity grab if price moves into this area.
📉 Phase 3: Final Defensive Zone – Major Support ($63.70 - $65.20)
This zone marks the last line of bullish defense.
A move here would mean the bullish structure is being reevaluated or absorbed by sellers.
However, if price hits this level, it could also attract significant institutional demand, setting up for a more powerful long-term leg up.
Reactions here are typically large and volatile, with a risk of fakeouts and fast reversals.
📈 Possible Scenarios (MMC Based Forecasting):
✅ Scenario 1 – Bullish Continuation (Primary Path)
Price finds support inside SR Interchange Zone.
Forms a base (MMC reversal structure) and pushes back to recent highs near $71.
Breakout above $71 opens room for next supply zones between $72.50 - $74.00.
⚠️ Scenario 2 – Deeper Liquidity Grab
Price breaks below SR Interchange and tests Main Zone for a deeper accumulation.
A wick or shakeout may happen before bullish continuation.
This trap zone could give the best R:R entry.
❌ Scenario 3 – Breakdown to Major Support
If both zones fail and bearish pressure sustains, price may revisit Major Support.
That would reset the bullish structure and require fresh MMC assessment.
🧠 MMC Logic at Work:
The curve break symbolizes the shift from supply dominance to a possible demand-led phase.
Minor structure breaks add fuel to trend shift and indicate participation from larger players.
Retracements are not weaknesses—they are refills for those who missed the move.
Smart money uses these zones and flips (SR interchanges) to hide in plain sight.
🎯 Key Takeaway for Traders:
This is a textbook MMC setup that combines:
Curve Breakout + Impulse
Zone Retest + Interchange Logic
Liquidity Engineering before Continuation
Traders should remain patient and observe reactions at each zone. Don’t chase—wait for the market to reveal its hand via MMC entry signals (break-of-structure, bullish engulfings, imbalance fills, etc.)
Oil (WTI) – Upcoming Buy OpportunityBased on the analysis I conducted using fractals, oil is expected to move upward and provide buyers with a 2% gain, equivalent to 140 pips.

USOIL BULLS ARE STRONG HERE|LONG
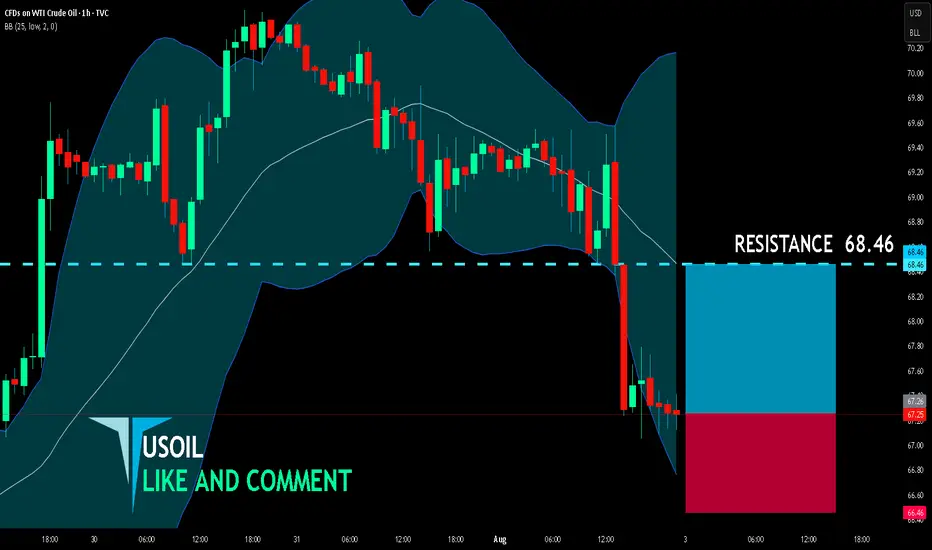
USOIL SIGNAL
Trade Direction: short
Entry Level: 67.26
Target Level: 68.46
Stop Loss: 66.46
RISK PROFILE
Risk level: medium
Suggested risk: 1%
Timeframe: 1h
Disclosure: I am part of Trade Nation's Influencer program and receive a monthly fee for using their TradingView charts in my analysis.
✅LIKE AND COMMENT MY IDEAS✅
Activation of the head and shoulders pattern?Oil has formed a clean head and shoulders pattern, which, if activated, could lead the price to drop to 67.125. However, if the pattern fails and turns out to be a fakeout, we can expect the price to rise toward the \$71 area.
Oil prices rebound, maintain bullish attitude
💡Message Strategy
International oil prices continued their upward trend on Thursday, closing higher for the fourth consecutive day, as concerns about growing global supply tightness abounded. Brent crude for September delivery rose 0.4% to $73.51 a barrel, while West Texas Intermediate (WTI) crude for September delivery rose 0.5% to $70.37 a barrel, while the more active Brent October contract rose 0.4% to $72.76 a barrel.
Recently, the market has focused on the statement of US President Trump, who demanded that Russia make "substantial progress" on the situation in Ukraine within 10-12 days, otherwise he would impose 100% secondary tariffs on its trading partners, significantly bringing forward the previous 50-day deadline.
Inventory data suggests a continued struggle between supply and demand. Data from the U.S. Energy Information Administration (EIA) showed that U.S. crude oil inventories unexpectedly rose by 7.7 million barrels to 426.7 million barrels in the week ending July 25, far exceeding expectations for a 1.3 million barrel drop. However, gasoline inventories fell by 2.7 million barrels to 228.4 million barrels, exceeding market expectations for a 600,000 barrel drop.
📊Technical aspects
From a daily perspective, WTI crude oil prices have closed higher for four consecutive days since rebounding from the $66 level. It is currently running stably above the integer mark of $70 per barrel. The short-term moving average system is in a bullish arrangement, and the MACD indicator remains above the zero axis, indicating that the bullish momentum is still strong.
From an hourly perspective, if the price breaks through the previous high of $70.50, it is expected to further rise to the $73.50-$75 range. Conversely, if it continues to fall below the $70 mark, it may trigger short-term profit-taking, and further support will focus on the $68.50 level. Overall, the short-term trend remains bullish.
💰Strategy Package
Long Position:68.00-68.50,SL:67.50,Target:70.50-73.00

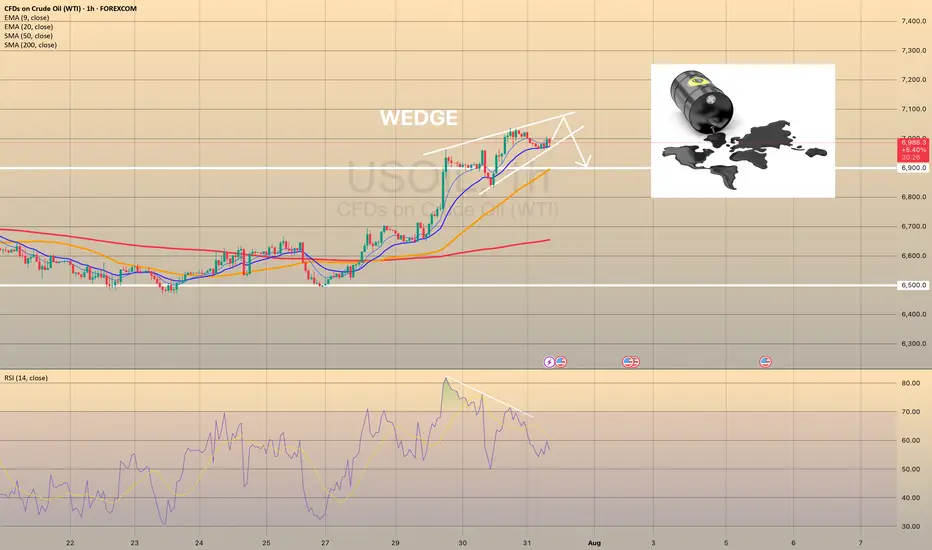
USOIL IS GOING BULLISH. FOR HOW LONG?USOIL IS GOING BULLISH. FOR HOW LONG?
Brent has started this week with a strong bullish momentum and holds near 6-week high on supply fears. President Trump announced plans to impose tariffs on Indian exports and penalize its Russian oil imports. In a parallel move, the US introduced its most extensive sanctions on Iran in seven years. The United States has even offered its oil to the world in exchange for Iranian and Russian oil, but there is evidence that the US production capacity is now at historic highs and is unlikely to grow in the near future.
However, technically oil shows us bearish divergence on RSI and bearish wedge here. The price may reverse towards 6,900.00 as a first target. EIA data showed US crude inventories jumped by 7.7 million barrels last week—the largest increase in six months and defying forecasts for a decline. Market participants are waiting for the OPEC+ meeting this week, expecting a significant output hike.
USOIL GROWTH AHEAD|
✅CRUDE OIL broke the key
Structure level of 69.50$
While trading in an local uptrend
Which makes me bullish biased
And I think that after the retest of the broken level is complete
A rebound and bullish continuation will follow
LONG🚀
✅Like and subscribe to never miss a new idea!✅
Disclosure: I am part of Trade Nation's Influencer program and receive a monthly fee for using their TradingView charts in my analysis.
Is there any news in the Middle East?Rapid move in oil.
We need to see if something significant is about to happen in the Middle East — it usually is when we see moves like this.
WTI is up on my radarPrice closed above daily GM, travelled, and now retraced back to the GM..
For now, I'll be BULLISH biased and look for Buy setup on the lower time frames..
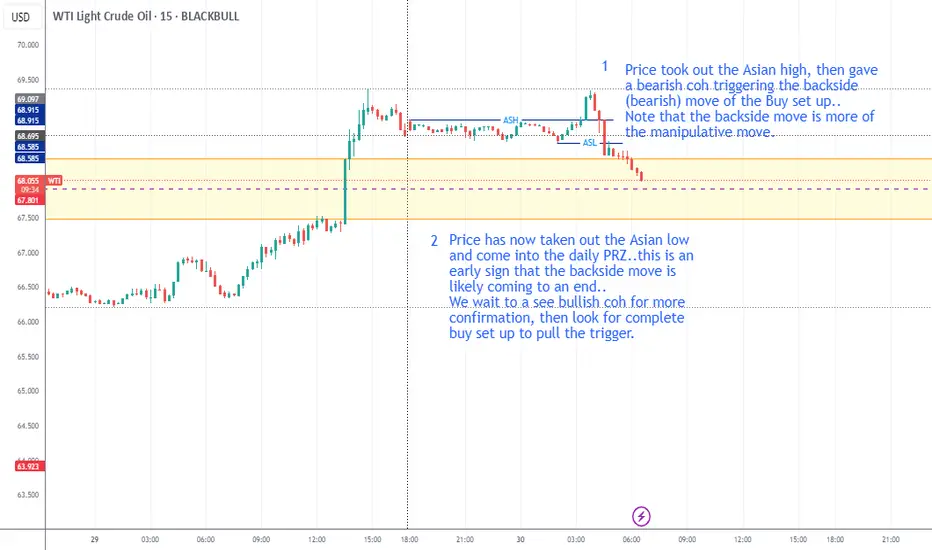
Price took out the Asian high, then gave a bearish coh triggering the backside (bearish) move of the Buy set up..
Note that the backside move is more of the manipulative move.
Price has now taken out the Asian low and come into the daily PRZ..this is an early sign that the backside move is likely coming to an end..
We wait to a see bullish coh for more confirmation, then look for complete buy set up to pull the trigger.
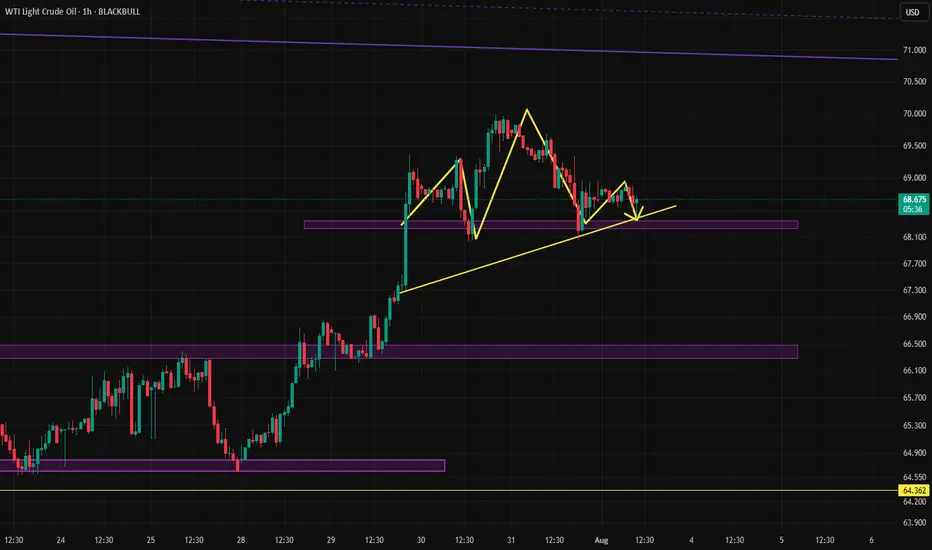
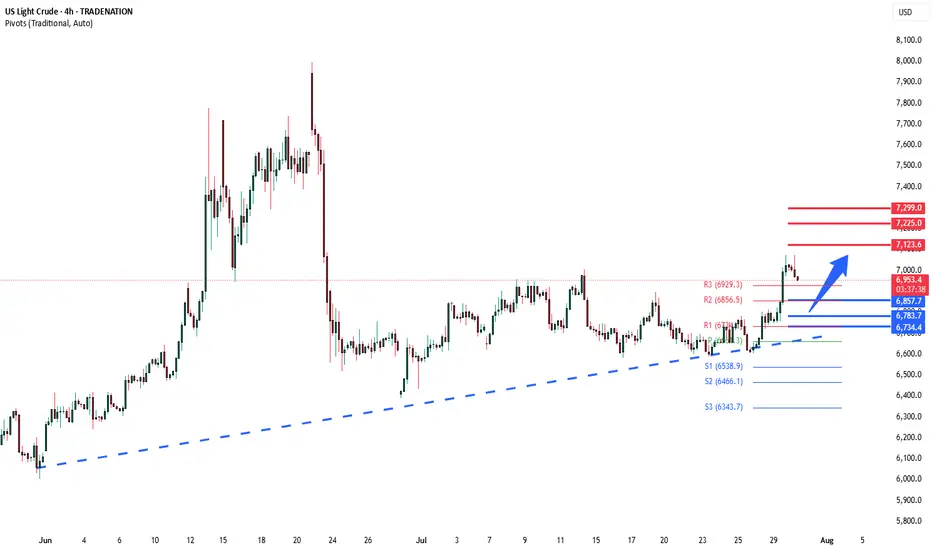
WTI uptrend pause support at 6857The WTI Crude remains in a bullish trend, with recent price action showing signs of a corrective pullback within the broader uptrend.
Support Zone: 6857 – a key level from previous consolidation. Price is currently testing or approaching this level.
A bullish rebound from 6857 would confirm ongoing upside momentum, with potential targets at:
7123 – initial resistance
7225 – psychological and structural level
7299 – extended resistance on the longer-term chart
Bearish Scenario:
A confirmed break and daily close below 6857 would weaken the bullish outlook and suggest deeper downside risk toward:
6783 – minor support
6735 – stronger support and potential demand zone
Outlook:
Bullish bias remains intact while the WTI Crude holds above 6734. A sustained break below this level could shift momentum to the downside in the short term.
This communication is for informational purposes only and should not be viewed as any form of recommendation as to a particular course of action or as investment advice. It is not intended as an offer or solicitation for the purchase or sale of any financial instrument or as an official confirmation of any transaction. Opinions, estimates and assumptions expressed herein are made as of the date of this communication and are subject to change without notice. This communication has been prepared based upon information, including market prices, data and other information, believed to be reliable; however, Trade Nation does not warrant its completeness or accuracy. All market prices and market data contained in or attached to this communication are indicative and subject to change without notice.
Back to boring range or a pullback and trend continuation?I hope it doesn't return to that boring range and instead makes a pullback and moves upward.
Although the price of oil depends on thousands of fundamental reasons.
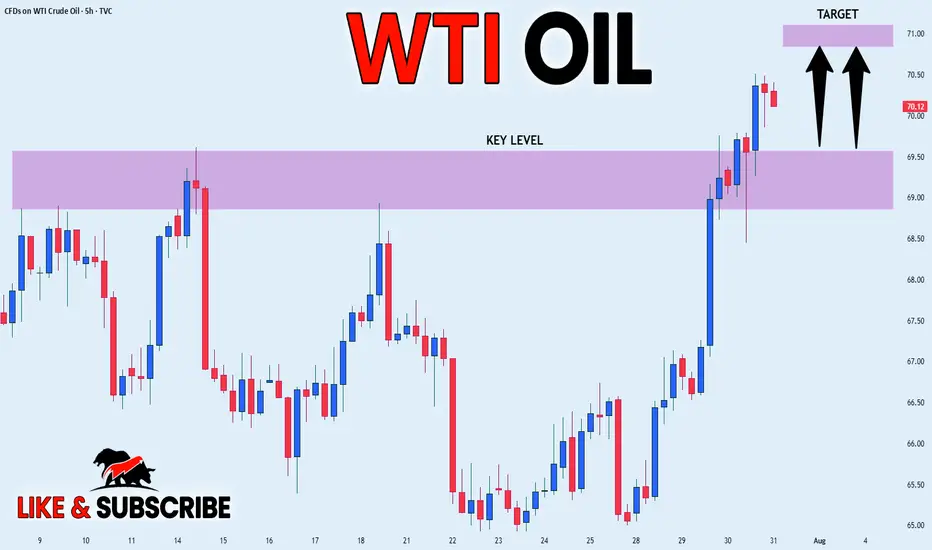
WTI Crude Eyes Bullish Momentum Above $68.9FenzoFx—WTI Crude Oil broke resistance at $68.9 in the last session, now trading near $70.6. This breakout supports a bullish shift.
Yet, RSI 14 and Stochastic indicate overbought conditions, suggesting possible consolidation. Support at $68.9 could offer a discounted entry if prices retreat.
Watch for bullish signs like candlestick formations and inverted FVG around the $68.9 support.

US OIL LONG SETUPPrice had created a good Demand Zone , Also Price is in an overall uptrend and pullback to the demand order block from which I took the entry, expected a minor retractment to pick my entry.
But it is what it is. Good Trade overall.
Potential Next setup Coming 🔥
_THE_KLASSIC_TRADER_.

Oil Steady as Sanction Threat LoomsOil prices held steady near recent highs after Trump threatened Russia with economic penalties if it doesn’t reach a ceasefire with Ukraine within 10–12 days. Traders are watching closely, as potential secondary sanctions on Russia could disrupt crude supply. However, skepticism remains over whether Trump will follow through, given his push for lower oil prices. The threat comes amid ongoing EU sanctions and ahead of key US trade deadlines and an OPEC+ meeting. Despite current tightness and summer demand, concerns of oversupply remain for later in the year.
On the technical side, the price of crude oil is still trading in a sideways range between $64 and $68. The moving averages are confirming a bullish trend in the market, while the Stochastic oscillator is at neutral levels, hinting that the short-term outlook for pricing could go either way. The Bollinger bands have contracted quite excessively, meaning that volatility is low; therefore, it could take some time for any significant moves. Currently, the price is testing the resistance of the 50-day simple moving average, while the first area of technical resistance lies around the $68 level, which is the upper boundary of the current sideways channel.
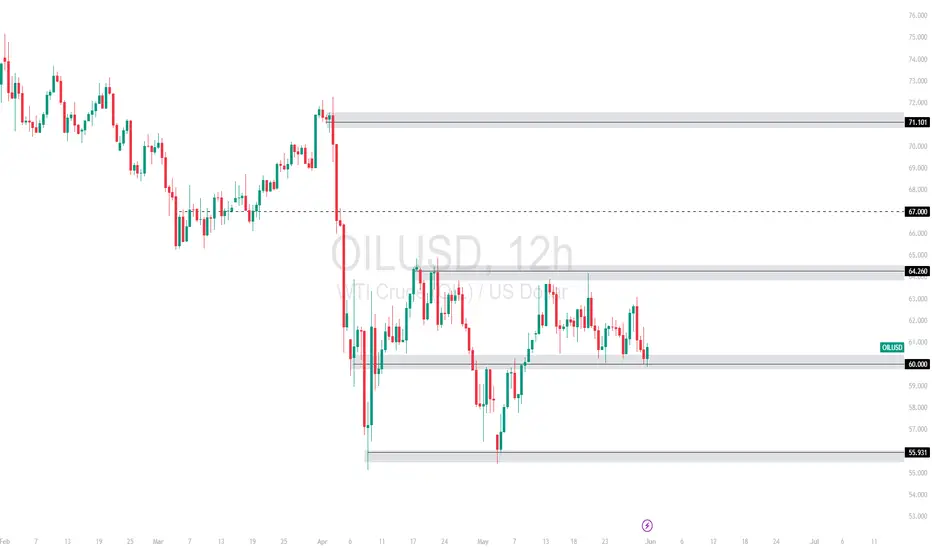
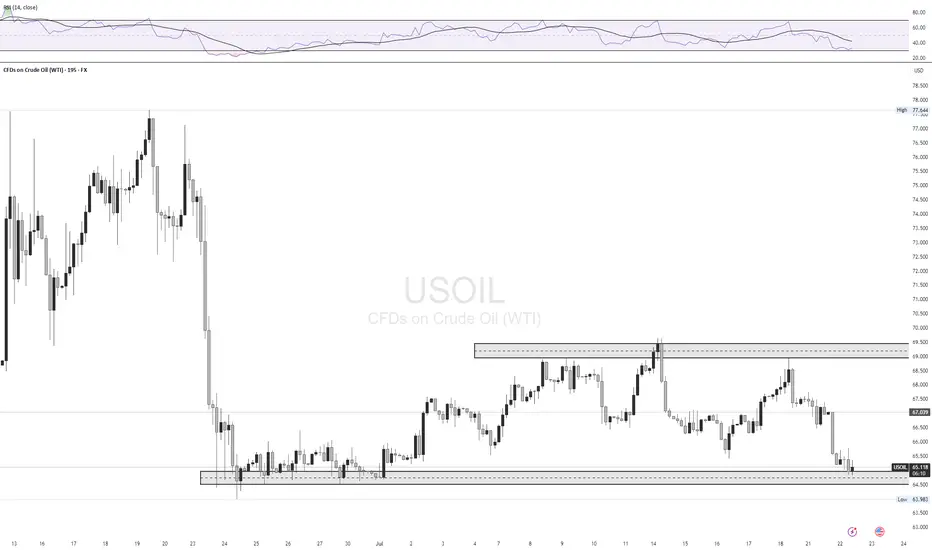
OILUSD Range Between 60–64.26 – Will Support Hold or Break?WTI Crude has been in a sideways range after the sharp drop in early April. Price recently tested resistance at 64.260 but failed to break higher, pulling back into the 60.000 support zone. This level has held multiple times, forming a key pivot.
Support at: 60.000 🔽, 55.931 🔽
Resistance at: 64.260 🔼, 67.000 🔼, 71.101 🔼
🔎 Bias:
🔼 Bullish: A strong rejection from the 60.000 zone followed by a breakout above 64.260.
🔽 Bearish: A daily/12H close below 60.000 opens the path to retest 55.931, and potentially lower.
📛 Disclaimer: This is not financial advice. Trade at your own risk.