USOIL Oil – April 10, 2025
Price Action & Trend Analysis:
- Current Market Position:
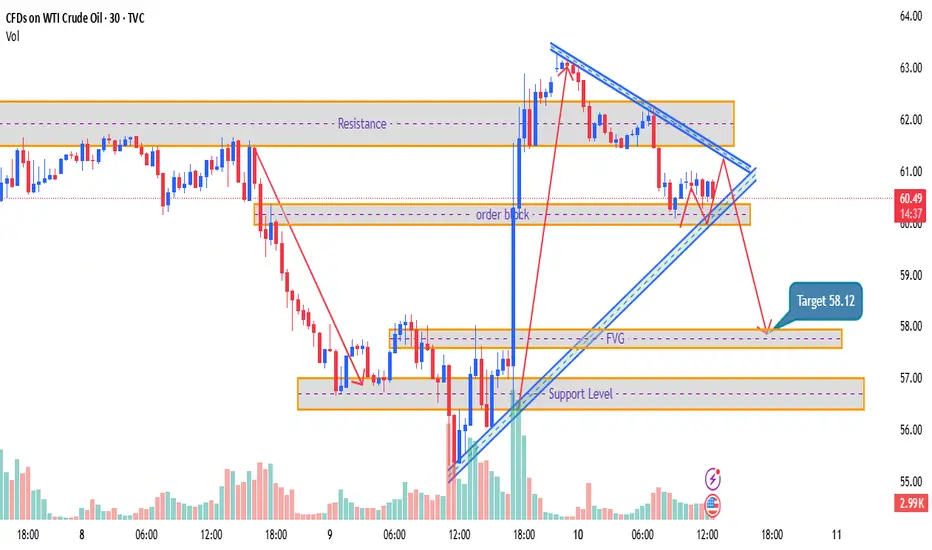
- WTI Crude Oil is showing a bearish trend within a falling wedge pattern, a technical formation that often signals a potential breakout after consolidation. This pattern is visible with converging trendlines (blue), which suggest a potential move to the downside.
- The resistance zone is marked at 61.50, and the price is struggling to break above this level. If it does not break out of this level, further downside momentum may be expected.
Key Levels:
1. Resistance Zone:
- The resistance level is clearly marked near 61.50, and price action has repeatedly struggled to move above this level, showing signs of rejection. A failure to break this l…
ChatGPT: 4. FVG (Fair Value Gap):
- There is a Fair Value Gap (FVG) near 58.12, which indicates a possible area of imbalance where price could potentially retrace to fill the gap before moving in its next direction.
Volume Analysis:
- The volume profile indicates decreasing volume as the price approaches the resistance zone at 61.50, which may suggest a weakening of bullish momentum.
- The increasing volume near the support level at 58.00 suggests that buyers are looking to step in at these levels, but this remains to be seen as the price moves toward this region.
Key Observations:
- The bearish divergence observed between price and momentum suggests that bearish pressure is mounting, especially with the price failing to breach resistance and forming lower highs.
- T
USOIL trade ideas
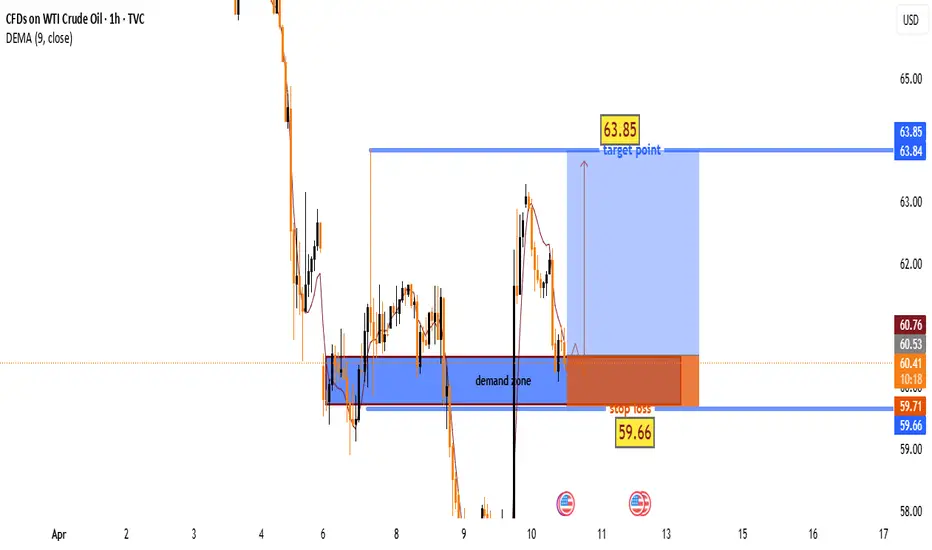
"WTI Crude Oil – Bullish Bounce from Demand Zone? "🔵 . Demand Zone:
⬇️ 60.53 – 59.71
This is the buy zone where bulls are likely to step in!
Price is currently testing this area. Watch closely!
🛑 . Stop Loss (Risk Zone):
📉 Below 59.66
If price falls below here, exit the trade – demand has failed.
🎯 . Target Point:
🚀 63.85
This is the take profit zone. A successful bounce could reach this level!
🟠 . EMA (9-period DEMA):
📉 Currently around 60.86
Price is slightly below EMA, showing short-term bearish pressure.
🟢 . Trade Idea Summary:
• Enter near the blue demand zone
• SL below 🔴 59.66
• TP at 🎯 63.85
• R:R ratio looks favorable (low risk, high reward)
Outlook:
As long as price holds above the demand zone, this setup remains bullish 📈
Let’s see if the bulls can push it to that 63.85 target! 🚀💰
Crude 1 hr - ST trade - Long at trendlineCrude has pulled back after the furious bounce yday
Buy close to trendline - narrow SL as per risk appetite
58 .5 can be a deep stop. target c 65

US500, XAUUSD & XTIUSD Daily Trade SetupsIn this update, we review the recent price action in the US500, XAUUSD & XTIUSD and identify the next high probability trading opportunity and price objectives to target. To review today's video analysis, click here.

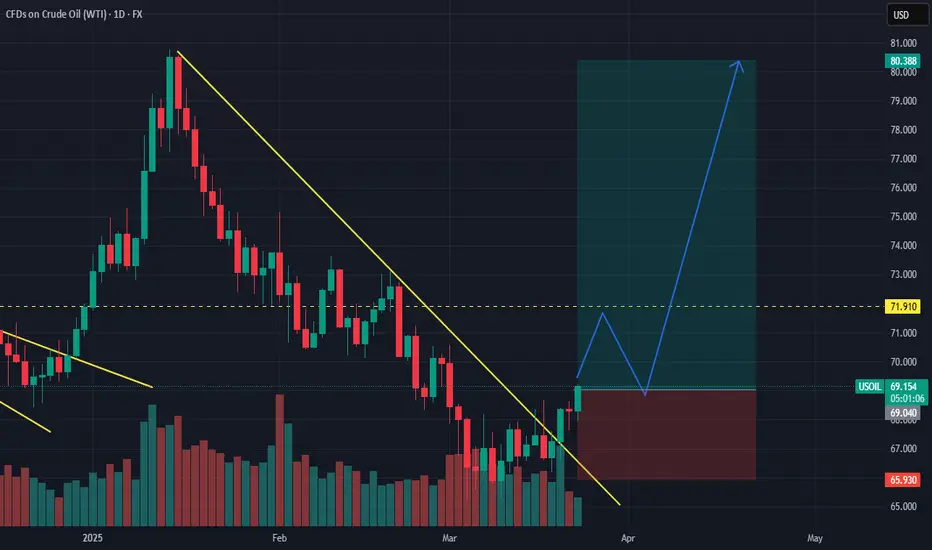
OIL PULLBACK 58-59 Then go up to 75-80OIL PULLBACK 58-59 Then go up to 75-80. Buy limit 58-59 sl 56.5 tp75-80

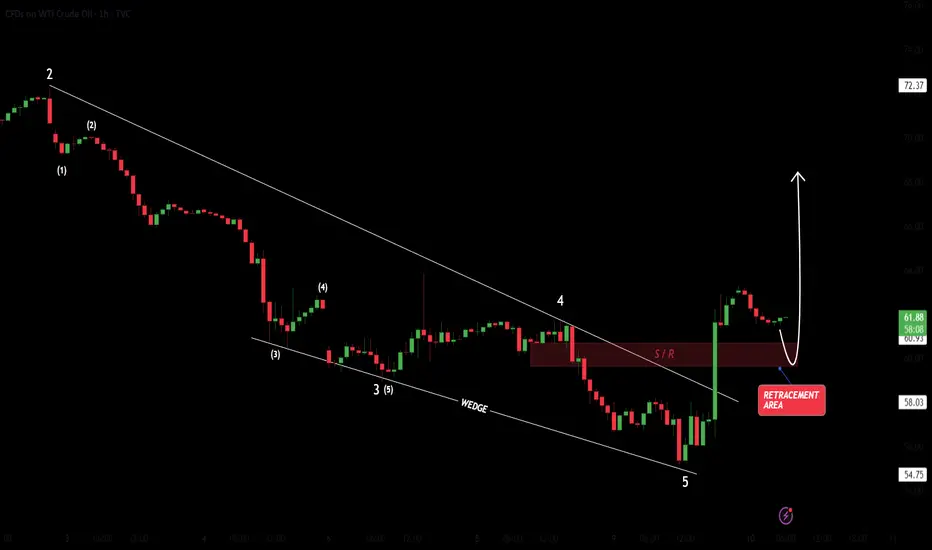
US OilCrude Oil
- Falling Wedge as an corrective pattern in Short Time Frame
- Break of Structure
- S / R Level
- Completed " 12345 " Impulsive Waves and " A " Corrective Waves
- Demand Zone
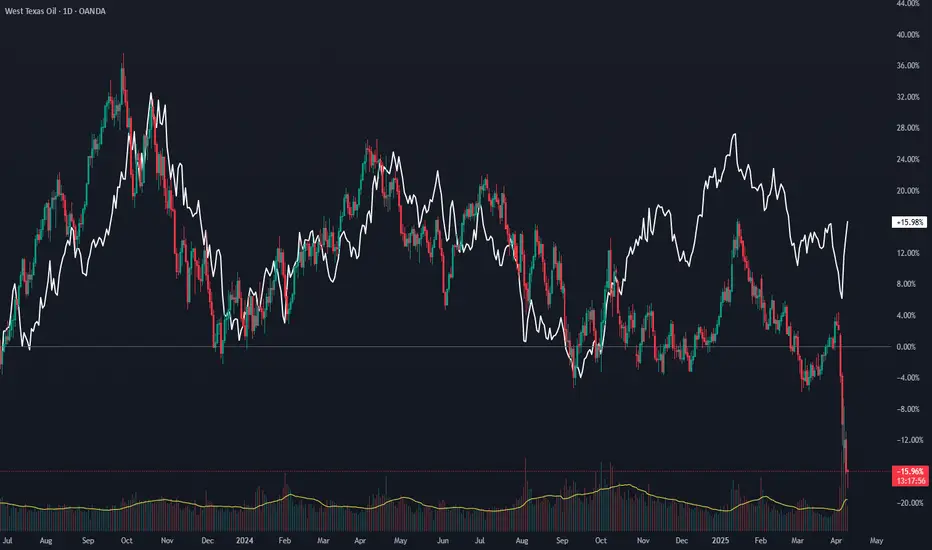
Long WTIUS10Y yield (white) and WTI typically trade in lockstep, but have recently diverged with US10Y rebounding while WTI has continued to observe selling pressure.
Expecting divergence to narrow, with WTI moving higher off recent lows. Entering long positions on WTI contracts.
US OIL SHORT RESULT Crude oil price action moved exactly in our Prediction and even Better.
Currently the price is in a new Bullish trend due to the FOMC news, but we'll watch it to see if it holds and it's authenticity before Opening new trades to ensure it's not just hype or manipulation.

OIL TO PUMP UPOil has broken the downtrend and turned bullish. Tump's Iran threads is also likely to accelerate the bullish push faster.
Risk no more than one per cent.
Swing trade so expect to hold it for weeks
Once trade over 200 pips in profit, set breakeven
Follow us for more perfect swing setups
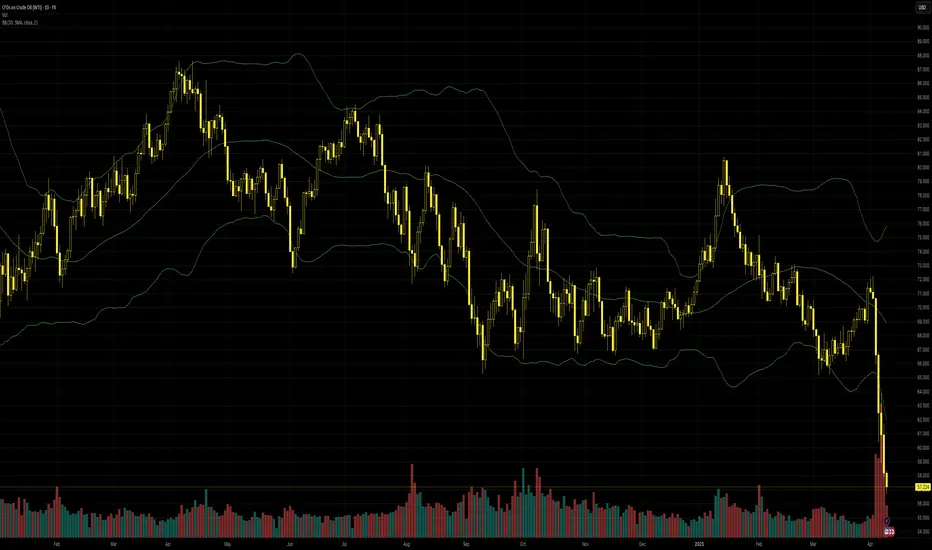
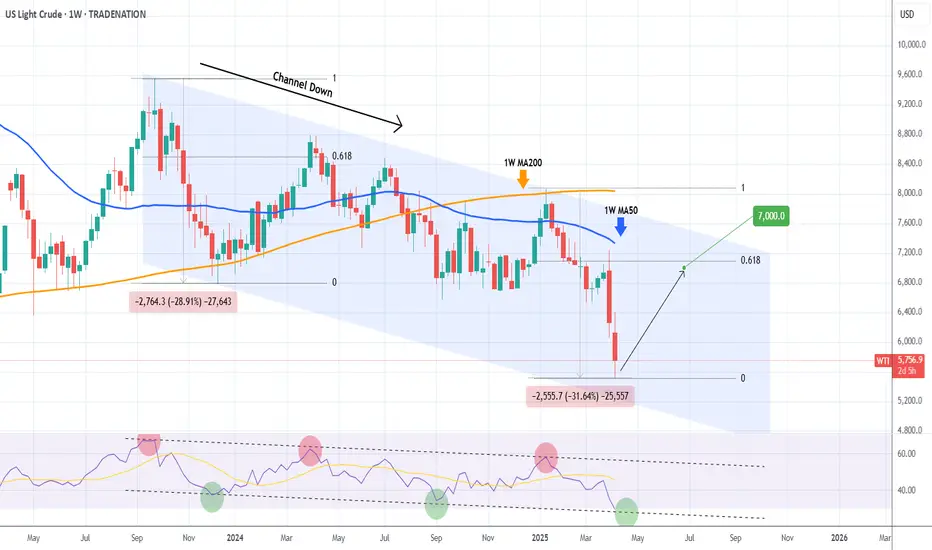
WTI OIL Buy opportunity or more meltdown coming?WTI Oil (USOIL) has been trading within a long-term Channel Down since the September 25 2023 High and the recent Trade War sell-off helped the price drop towards the pattern's bottom (Lower Lows trend-line) much quicker.
Technically this has been a 1W MA50 (blue trend-line) rejection, previously a Lower High rejection on the 1W MA200 (orange trend-line). Notice how the 1W RSI has also been trading within a Channel Down of its own, with the indicator near its bottom as well.
Being more than -31% down (more than the -29% of the first Bearish Leg), we can technically claim that this is a solid level for a medium-term buy again. The previous Bullish Leg marginally exceeded the 0.618 Fibonacci retracement level before the Lower High. As a result, our new Target is $70.00.
-------------------------------------------------------------------------------
** Please LIKE 👍, FOLLOW ✅, SHARE 🙌 and COMMENT ✍ if you enjoy this idea! Also share your ideas and charts in the comments section below! This is best way to keep it relevant, support us, keep the content here free and allow the idea to reach as many people as possible. **
-------------------------------------------------------------------------------
Disclosure: I am part of Trade Nation's Influencer program and receive a monthly fee for using their TradingView charts in my analysis.
💸💸💸💸💸💸
👇 👇 👇 👇 👇 👇
bearsTechnically going to check the London sessions bottom.Commercial crude oil stocks excluding the Strategic Petroleum Reserve rose by 2.6 million barrels to 442.3 million barrels in the week ended April 4, and were about 5% below the five-year average for the time of year, the EIA said. Analysts surveyed by The Wall Street Journal had predicted crude stockpiles would rise by 2.1 million barrels.

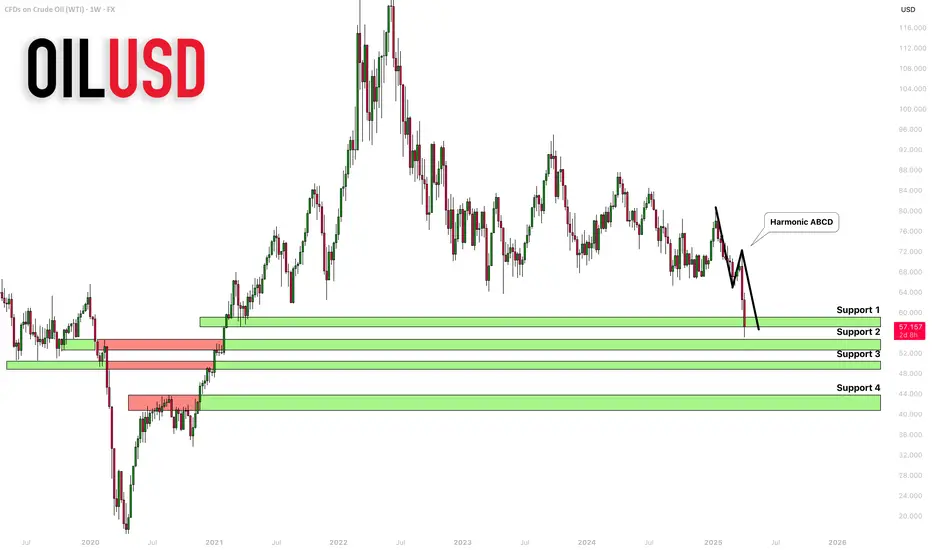
CRUDE OIL (WTI): Important Support Clusters to Watch
On a today's live stream, we discussed potentially significant
historic supports on WTI Crude Oil to watch.
Support 1: 57.0 - 59.0 area
Support 2: 52.5 - 54.6 area
Support 3: 48.8 - 50.4 area
Support 4: 40.6 - 43.7 area
The price is currently testing a lower boundary of Support 1.
It perfectly matches with a completion point of a harmonic ABCD pattern.
It looks like we may see some pullback soon.
❤️Please, support my work with like, thank you!❤️
Bears to scoop the Oil all the way to the 42.00 zone U.S. oil prices have extended their losses this Wednesday, plunging by more than 6% after China just announced it has raised tariff trade duty on goods from the United States from 34% to 84% starting 10th April in response to US President Donald Trump's tariffs, including a cumulative levy rate of 104% on Chinese imports. Traders are now remaining wary of investing amid United States President Donald Trump's tariffs on other countries and specific imports, despite the continued turmoil in the Middle East,
That being said I'm with the bears on this one
sell @after retest @60.00
1st Tp @42.00

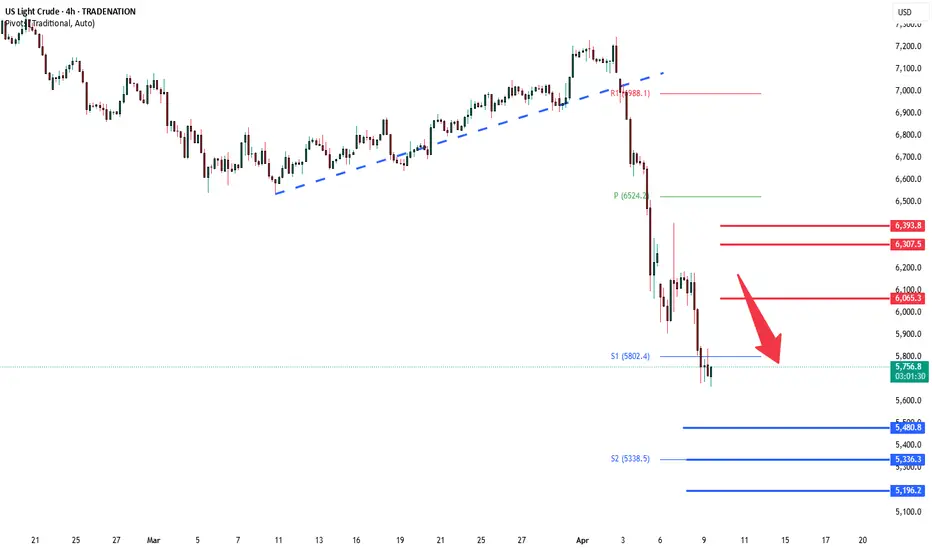
WTI Crude Oil selling pressure continuationWTI Crude Oil is showing bearish sentiment, in line with the current downtrend. Recent price action confirms a break below a key consolidation zone, adding pressure to the downside.
Key Levels:
Resistance: 6065 (former support, now resistance), 6307, 6400
Support: 5480, 5336, 5200
Bearish Outlook:
Price has broken below 6065, which was a key intraday consolidation level. If WTI sees a short-term bounce but fails to break above 6065, it could resume its downward move toward 5480, then 5336, and possibly 5200 over time.
Bullish Scenario:
If WTI breaks above 6065 and closes above it on the daily chart, the bearish setup would be invalidated. This could open the door for a rally toward 6307, then 6400.
Conclusion:
The trend remains bearish below 6065. A rejection at this level would reinforce the downside bias. However, a confirmed break and daily close above 6065 would shift the outlook to bullish in the short term.
This communication is for informational purposes only and should not be viewed as any form of recommendation as to a particular course of action or as investment advice. It is not intended as an offer or solicitation for the purchase or sale of any financial instrument or as an official confirmation of any transaction. Opinions, estimates and assumptions expressed herein are made as of the date of this communication and are subject to change without notice. This communication has been prepared based upon information, including market prices, data and other information, believed to be reliable; however, Trade Nation does not warrant its completeness or accuracy. All market prices and market data contained in or attached to this communication are indicative and subject to change without notice.
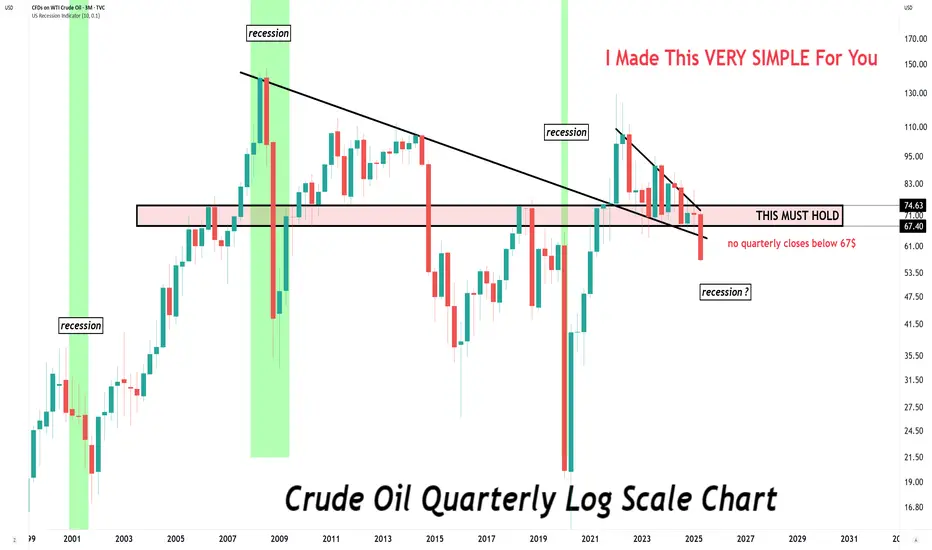
Crude oil is in big trouble...no quarterly closes below 67$
THIS MUST HOLD
recession 2001
recession 2008
recession?
Oil holds below $60: demand likely down, supply upSince the announcement of higher than expected new American tariffs, especially on China, oil’s decline has been dramatic. The very high tariffs on China are important because China is the largest importer of oil, so economic headwinds there usually have a significant effect on demand. OPEC+ decided last week to increase supply next month.
4 April was American light oil’s lowest weekly close since August 2021, so it’s difficult to estimate the next potential support. The 78.6% monthly Fibonacci retracement is around $40, but even in the circumstances that’s a very long way from where the price is now. The unusual strength of the oversold signal and the size of recent candlesticks call into question whether the price might continue immediately lower unless significant fresh trade news reaches markets.
Equally, buying oil now looks like trying to ‘catch the knife’. Fundamentals are quite strongly negative and 7 April’s failed bounce suggests that demand is likely to remain low for some time unless there’s another round of strong losses or the tone of the news changes. Short-term trading of retracements seems to be the least bad option now.
This is my personal opinion, not the opinion of Exness. This is not a recommendation to trade.