Crude oil shock trend direction
💡Message Strategy
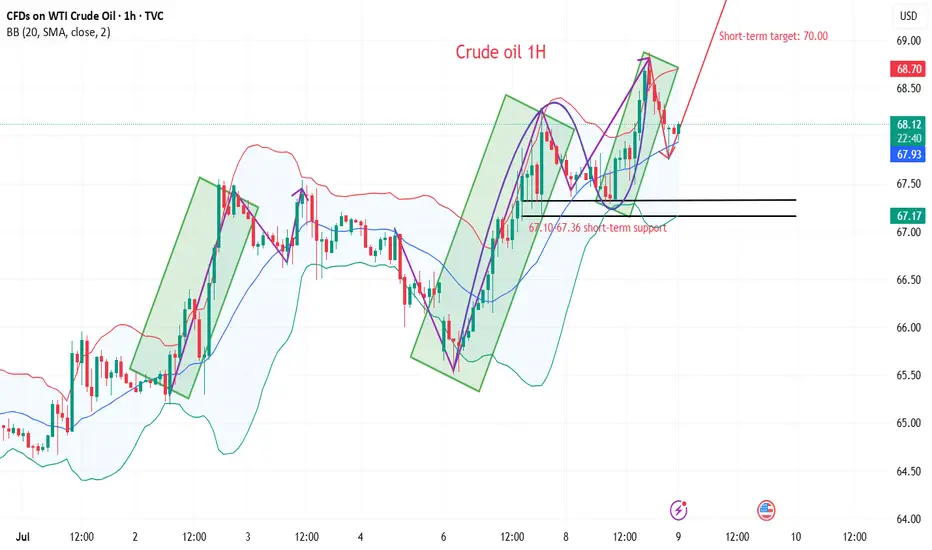
During the European trading session on Monday, the West Texas Intermediate (WTI) crude oil futures on the New York Mercantile Exchange recovered the previous losses and rebounded to around $67.50 per barrel. Although OPEC+ confirmed that the increase in oil production in August will be higher than expected, oil prices still rebounded.
From the daily chart level, the medium-term trend of crude oil fluctuated upward and tested around 78. The K-line closed with a large real negative line, which has not yet destroyed the moving average system and is still supported. The medium-term objective upward trend remains unchanged. However, from the perspective of momentum, the MACD indicator crosses downward above the zero axis, indicating that the bullish momentum is weakening. It is expected that the medium-term trend of crude oil will fall into a high-level oscillating upward pattern.
📊Technical aspects
The short-term (1H) trend of crude oil failed to continue to hit a new low and showed a rebound rhythm. The oil price crossed the moving average system, and the short-term objective trend entered a transition period. From the perspective of momentum, the MACD indicator crossed the zero axis, and the red column indicated that the bullish momentum was sufficient. At present, the price is running in a wide range, with a range of 65.50-67.80. It is expected that the trend of crude oil will repeatedly test the upper edge of the range within the range.
💰Strategy Package
Long Position:67.00-67.50,SL:65.50,Target:70.00
USOIL trade ideas
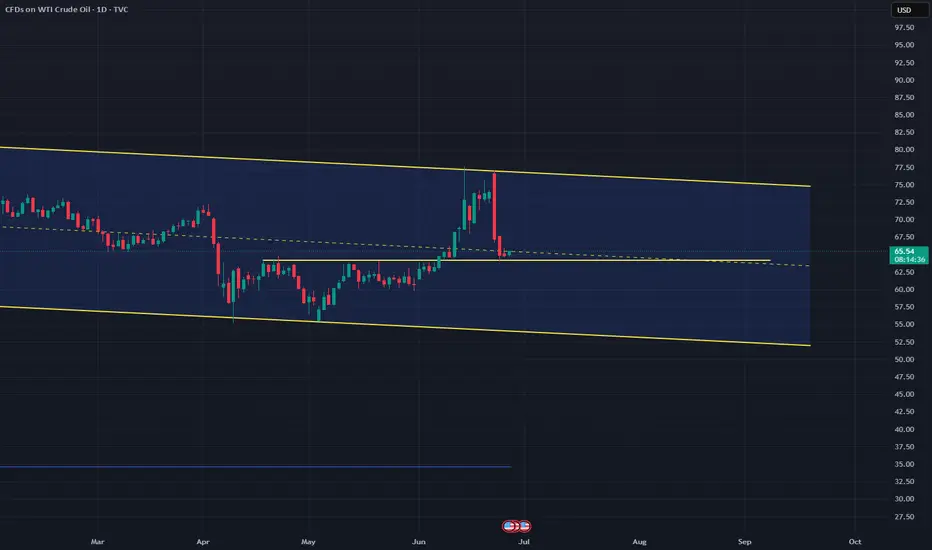
WTI crude oil Wave Analysis – 8 July 2025- WTI crude oil reversed from the support zone
- Likely to rise to resistance level 70.00
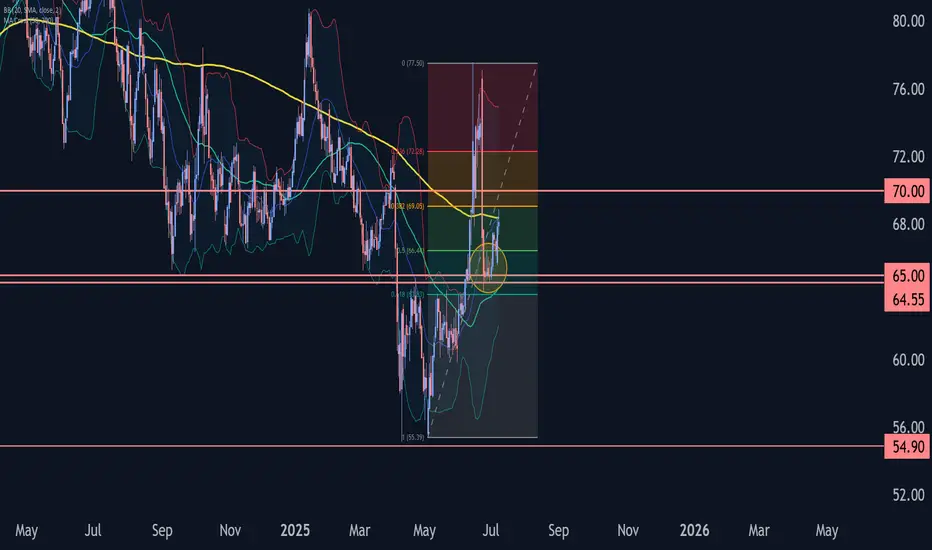
WTI crude oil recently reversed up from the support zone located between the key support level 64.55 (former resistance from the end of April), the lower daily Bollinger Band and the 61.8% Fibonacci correction of the upward impulse from May.
The upward reversal from this support zone started the active medium-term ABC correction (2).
WTI crude oil can be expected to rise to the next round resistance level 70.00 (target price for the completion of the active impulse wave i).
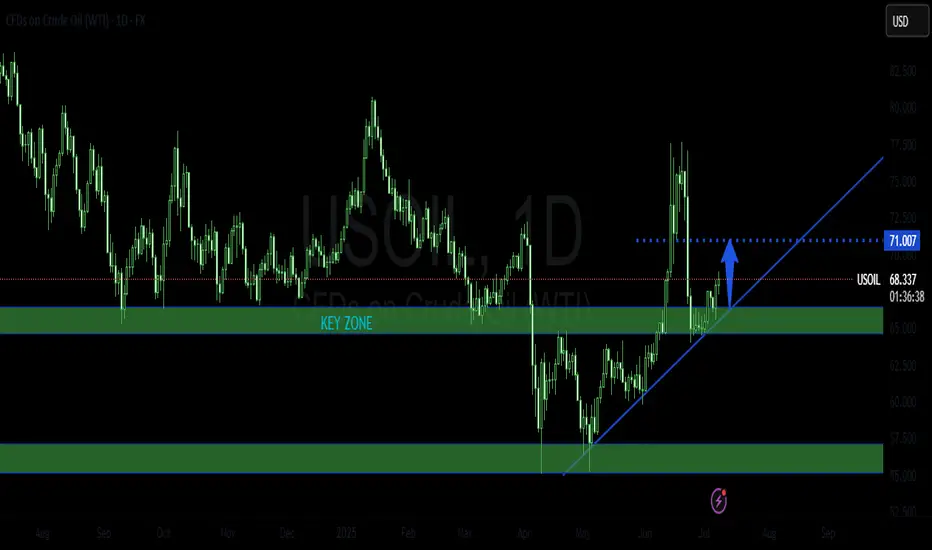
CRUDE OIL WTI LONG TRADE PLANThe instrument is trading in a global bull trend. It recently retested a strong confluence area. From this zone I expect the bullish rally to continue.
Please do your own analysis before placing any trades.
Cheers and Happy Trading !!!
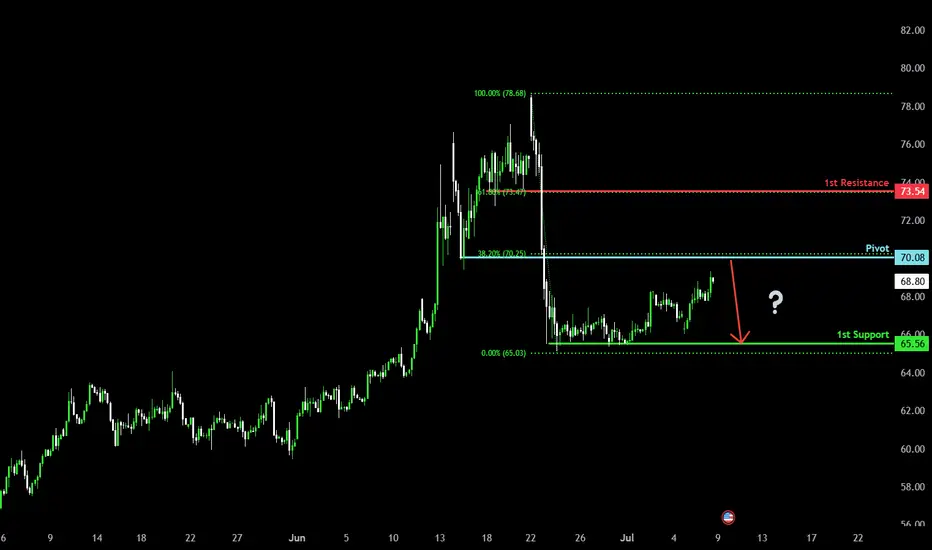
Bearish reversal off 38.2% Fibonacci resistance?WTI Oil (XTI/USD) is rising towards the pivot and could reverse to the 1st support which is a pullback support.
Pivot: 70.08
1st Support: 65.56
1st Resistance: 73.54
Risk Warning:
Trading Forex and CFDs carries a high level of risk to your capital and you should only trade with money you can afford to lose. Trading Forex and CFDs may not be suitable for all investors, so please ensure that you fully understand the risks involved and seek independent advice if necessary.
Disclaimer:
The above opinions given constitute general market commentary, and do not constitute the opinion or advice of IC Markets or any form of personal or investment advice.
Any opinions, news, research, analyses, prices, other information, or links to third-party sites contained on this website are provided on an "as-is" basis, are intended only to be informative, is not an advice nor a recommendation, nor research, or a record of our trading prices, or an offer of, or solicitation for a transaction in any financial instrument and thus should not be treated as such. The information provided does not involve any specific investment objectives, financial situation and needs of any specific person who may receive it. Please be aware, that past performance is not a reliable indicator of future performance and/or results. Past Performance or Forward-looking scenarios based upon the reasonable beliefs of the third-party provider are not a guarantee of future performance. Actual results may differ materially from those anticipated in forward-looking or past performance statements. IC Markets makes no representation or warranty and assumes no liability as to the accuracy or completeness of the information provided, nor any loss arising from any investment based on a recommendation, forecast or any information supplied by any third-party.
WTI USOIL WTI oil Prices are supported by supply cuts and production adjustments but tempered by inventory levels and economic concerns.
The market remains sensitive to geopolitical developments, OPEC+ policies, and US economic data.
#oil
OIL Bouncing at SupportLooking for a short bounce on US Oil here after a massive sell off earlier this week when the ceasefire was announced in the middle east. Again this is a short, countertrend bounce trade . Once you get a few percent, take your profits and get out.
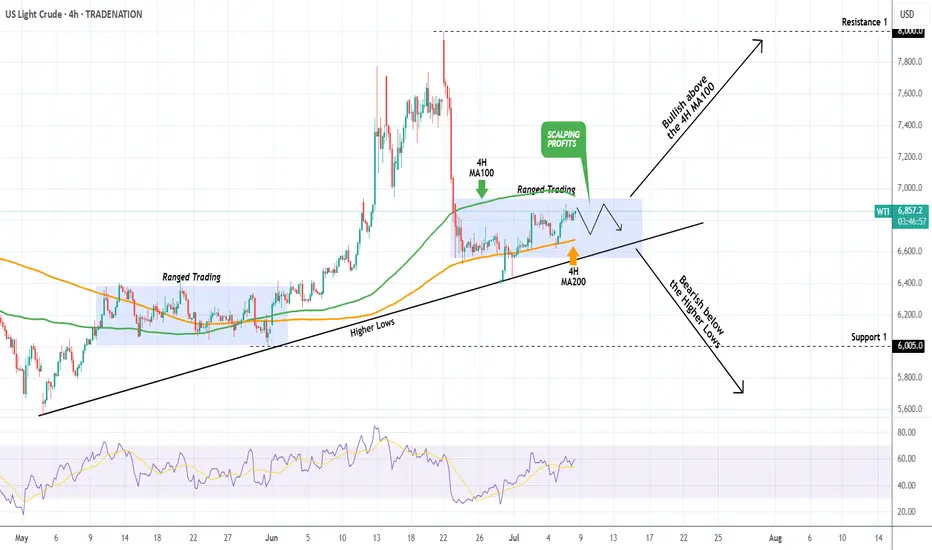
WTI OIL Best scalping opportunity at the moment!WTI Oil (USOIL) has been consolidating inside a ranged trading set-up, with the 4H MA100 (green trend-line) as its Resistance and the 4H MA200 (orange trend-line) as its Support.
We saw this previously from May 13 to June 01 and it presents the best scaling opportunity in the market at the moment. That previous Ranged Trading pattern eventually broke upwards as the Higher Lows trend-line held.
As a result, after you get your scalping profits within this range, look for a clear break-out above the 4H MA100 (candle closing) in order to go long (Resistance 1) or a break-out below the Higher Lows (candle closing) in order to go short (Support 1).
-------------------------------------------------------------------------------
** Please LIKE 👍, FOLLOW ✅, SHARE 🙌 and COMMENT ✍ if you enjoy this idea! Also share your ideas and charts in the comments section below! This is best way to keep it relevant, support us, keep the content here free and allow the idea to reach as many people as possible. **
-------------------------------------------------------------------------------
Disclosure: I am part of Trade Nation's Influencer program and receive a monthly fee for using their TradingView charts in my analysis.
💸💸💸💸💸💸
👇 👇 👇 👇 👇 👇
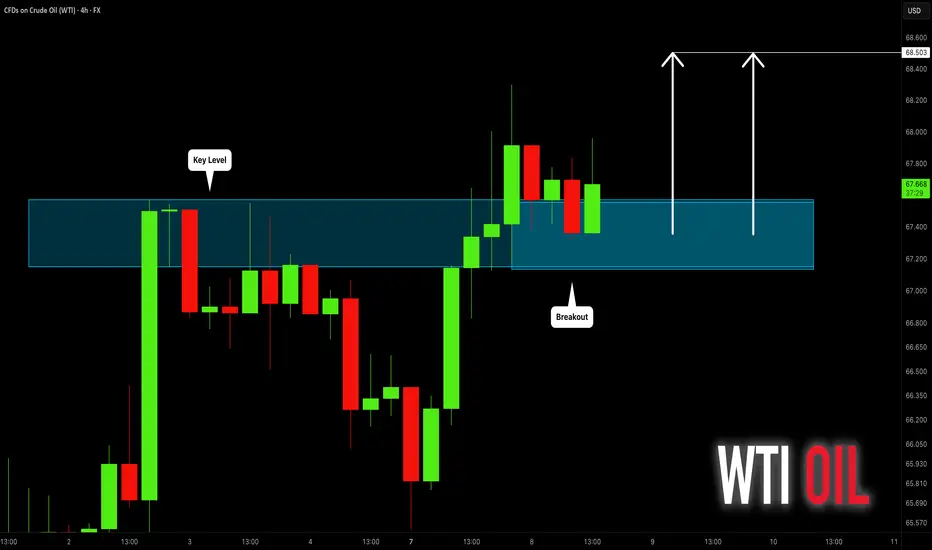
WTI CRUDE OIL (USOIL): More Growth Ahead
Crude Oil broke and closed above a significant resistance.
The price is now retesting that.
I think that the market is going to rise.
Next resistance - 68.5
❤️Please, support my work with like, thank you!❤️
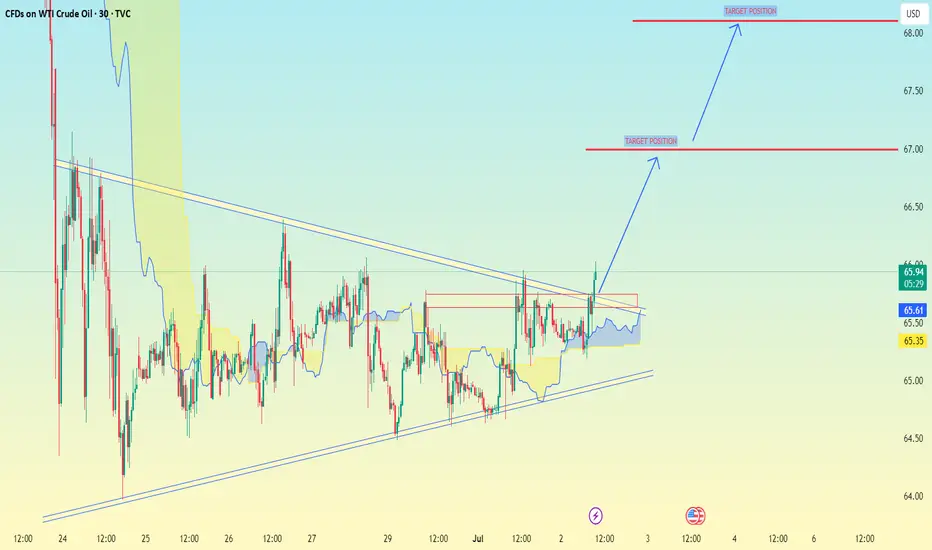
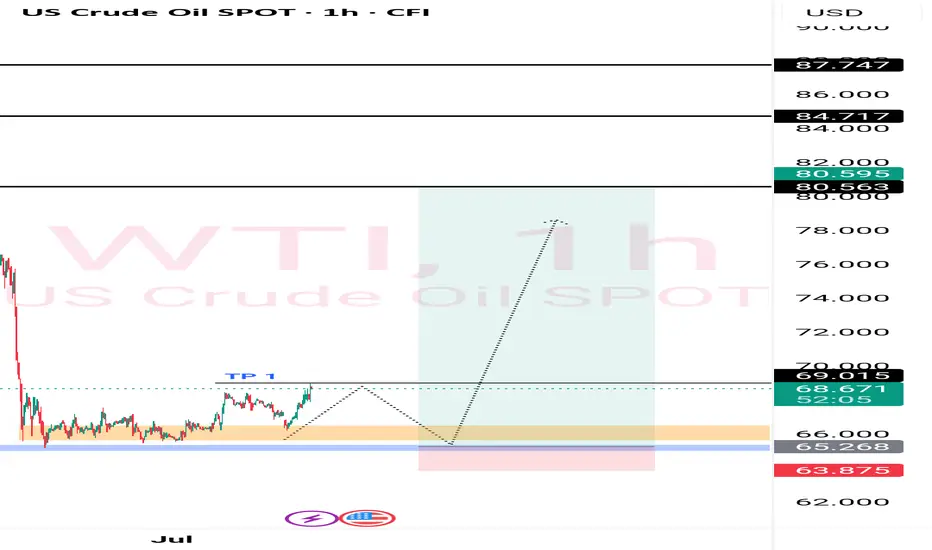
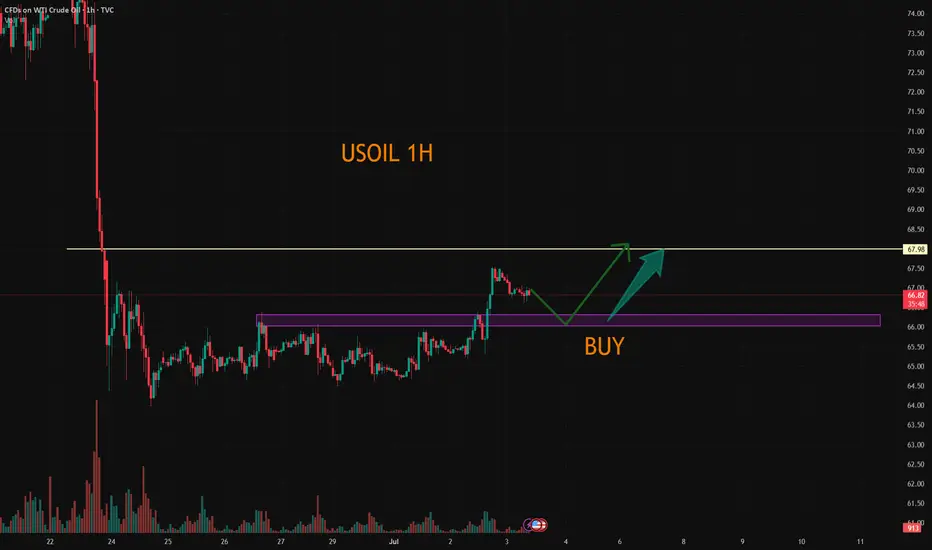
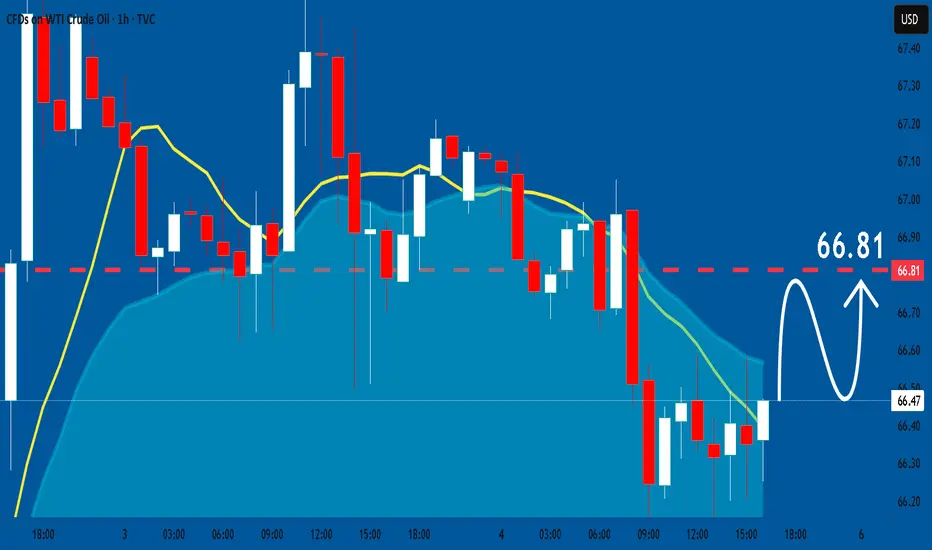
(WTI Crude Oil) on the 30-minute timeframe:(WTI Crude Oil) on the 30-minute timeframe:
You have a clear triangle breakout happening.
The chart shows two bullish target positions marked with blue arrows.
Based on your chart:
Current Price Zone: Around 66.20 - 66.25
Target Levels:
✅ First Target: 67.00
✅ Second Target: 68.00 - 68.10
---
Summary Trading Idea:
Breakout above resistance trendline confirmed.
First resistance and partial target at 67.00
Final target near 68.00 - 68.10, where the next significant resistance lies.
Let me know if you want stop-loss suggestions or a detailed entry strategy.
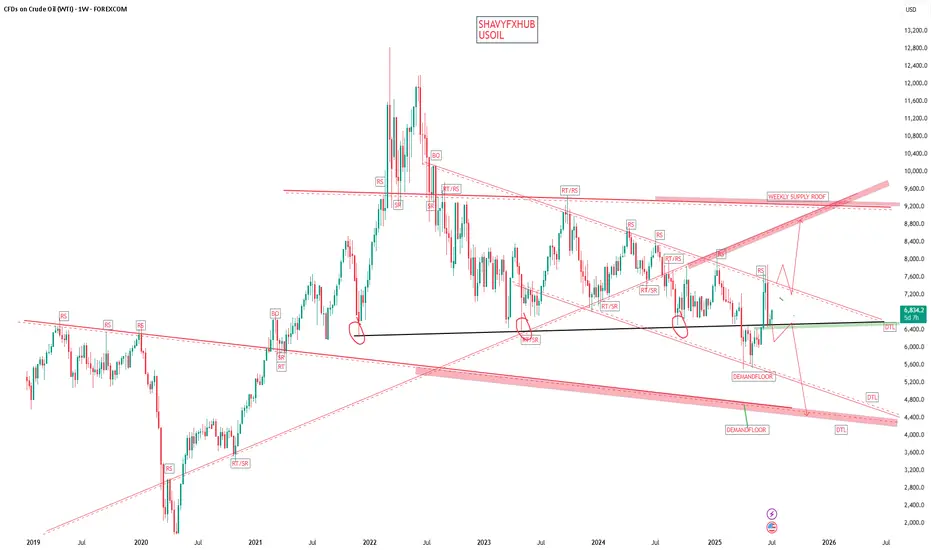
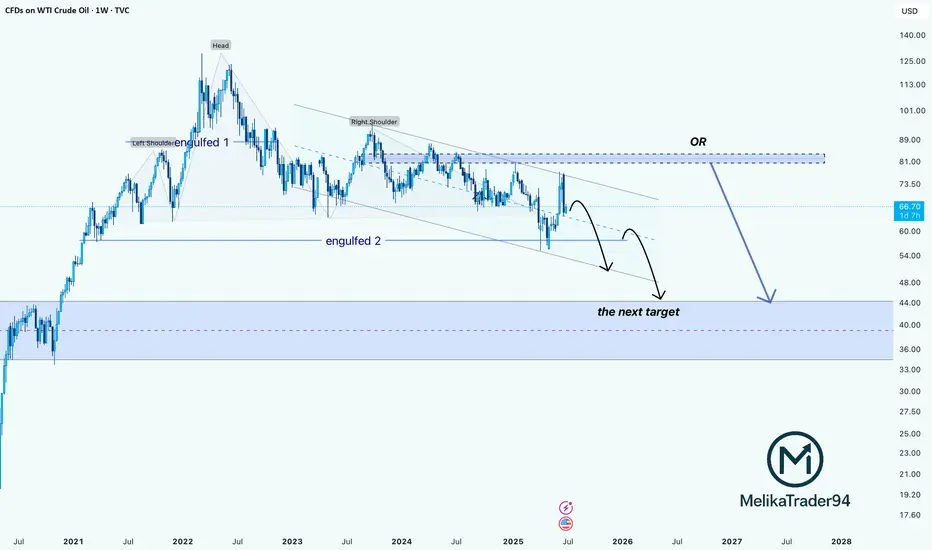
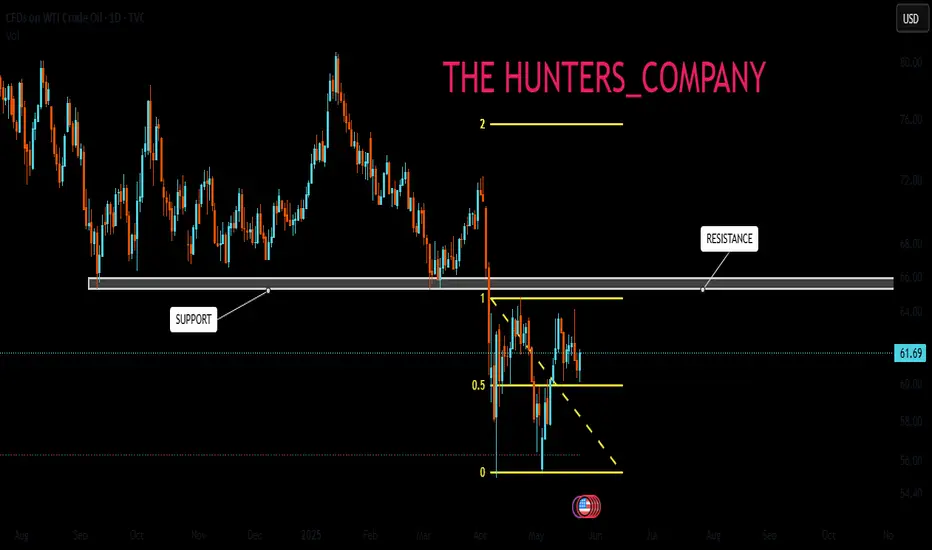
WTI Crude Oil: Double Engulf + H&S Breakdown Points to $40Hello guys! Let's dive into WTI!
The weekly chart of WTI Crude Oil reveals a bearish Head & Shoulders pattern playing out over a long-term descending channel. Price recently got rejected from the upper trendline, showing weakness despite a short-term bounce.
- Engulfed 1 & 2:
Two major engulfing zones failed to hold as support, turning into strong resistance.
- Bearish Scenario in Play:
After the recent upside move into resistance, price is likely to follow one of two paths:
- Continuation Within the Channel:
Rejection from the upper bound of the descending channel leads to a stair-step decline toward the $47–52 zone.
- Final Rejection from Supply Zone ($83–89):
A larger corrective push could test this area before a full collapse toward the long-term demand zone.
Main Target:
The blue shaded region ($36–47) stands out as a strong long-term demand zone, where buyers may finally step in.
____________________
Invalidation point:
Unless crude oil breaks above the $89 zone with strong volume, all signs point to further downside.
The chart structure favors a slow bleed with temporary bounces, ultimately targeting the $40s.
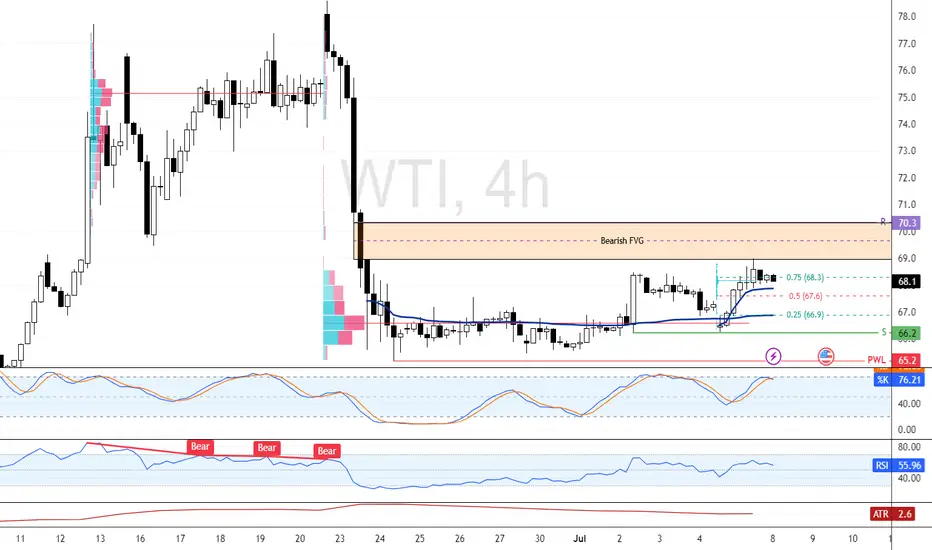
Momentum Cools as Oil Eyes Reentry From $67.6FenzoFx—Crude Oil bounced from $66.2, a support backed by the volume profile point of interest, but lost momentum after hitting the bearish FVG.
Currently trading near $68.2 with Stochastic overbought. A pullback to $67.6 can offer a low-risk reentry. The bullish bias remains intact above $65.2, with $70.3 as the next target.
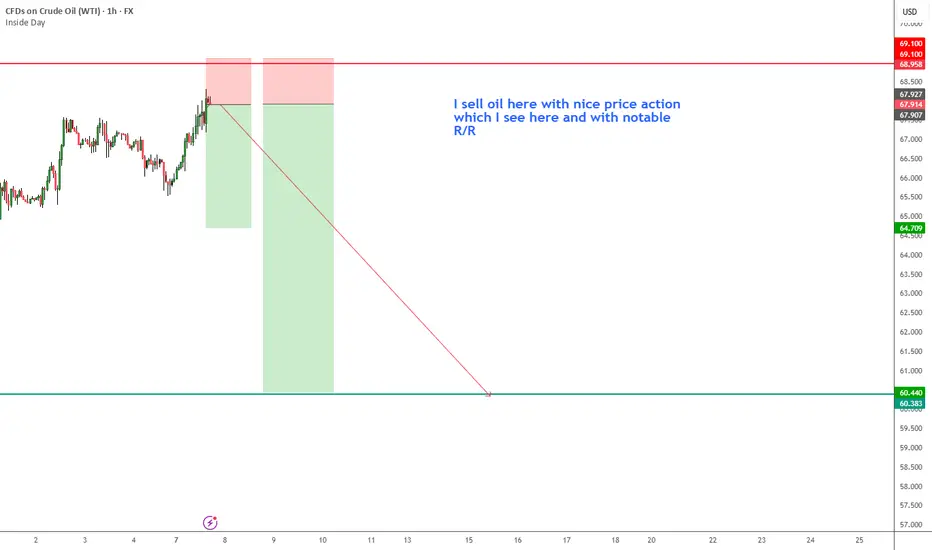
Sell oil here after decrearse tension in middle east I Can see notable price action for going to sell on oil
Crude oil continues to fluctuate upward
💡Message Strategy
OPEC+, led by Asian countries, announced on Saturday that it would increase production by an additional 548,000 barrels per day from next month, more than 30% higher than market expectations of 411,000 barrels per day, accelerating the pace of resumption of production after the production cuts in 2023.
In addition to supply-side factors, demand prospects are also affected by trade concerns. U.S. Commerce Secretary Howard Lutnick said that the country-specific tariffs that the Trump administration intends to implement will officially take effect on August 1, later than the previously scheduled July 9, leaving trading partners with a short breathing space.
Market concerns about the impact of this policy on crude oil consumption have intensified, especially among importing countries, mainly Asian countries.
Confidence in the Asian market remains, and Saudi Arabia raises prices to Asia
Despite the increase in supply, OPEC+ still emphasized in its statement that "the global economic outlook is stable and the market fundamentals are healthy." As a signal of confidence, Saudi Arabia has raised the prices of major crude oil varieties for Asian customers, indicating that it believes that the Asian market has the ability to absorb additional supply.
According to OPEC+ representatives, the alliance will consider whether to increase supply by another 548,000 barrels per day in September at its next meeting on August 3, thereby fully restoring the 2.2 million barrels per day quota cut last year.
📊Technical aspects
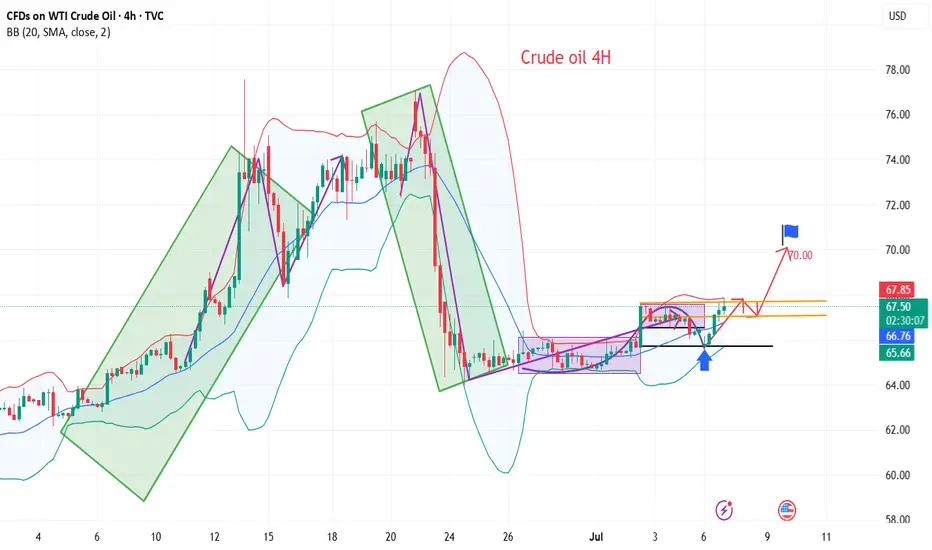
From the daily chart level, crude oil fluctuates upward and tests around 75 in the medium term. The K-line closes with a large real negative line, which has not yet destroyed the moving average system and is still supported. The medium-term objective trend remains upward. However, from the perspective of momentum, the MACD indicator crosses downward above the zero axis, indicating that the bullish momentum is weakened. It is expected that the medium-term trend of crude oil will fall into a high-level oscillation pattern.
After the short-term (4H) trend of crude oil fluctuates and consolidates, it turns into an upward rhythm. The moving average system is arranged in short positions, and the short-term objective trend is upward. The MACD indicator fast and slow lines cross the zero axis, and the bullish momentum is full. It is expected that the crude oil trend will continue to rise after a slight rebound during the day.
💰Strategy Package
Long Position:66.00-67.00,SL:65.00,Target:69.00-70.00
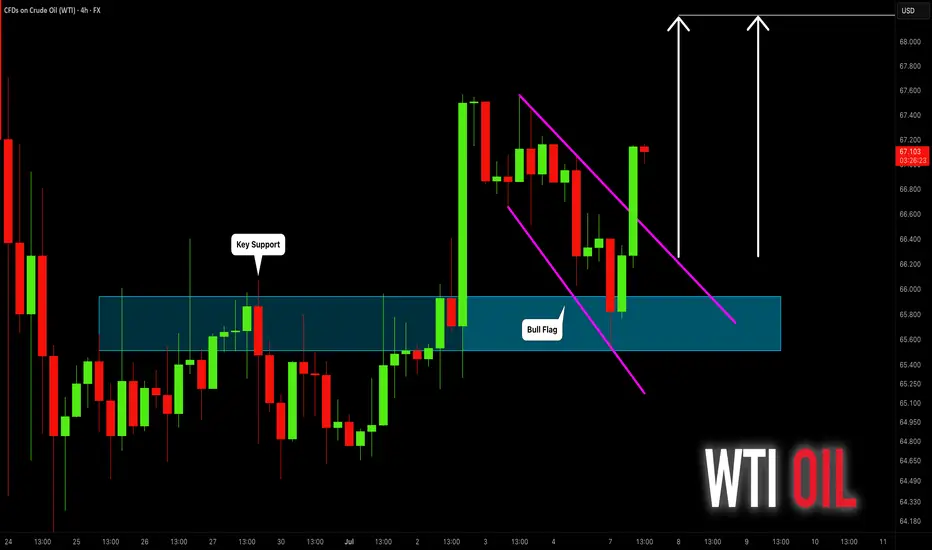
CRUDE OIL (WTI): Move Up Ahead!
Last week, I already shared a bullish setup on WTI Crude Oil
on a daily time frame.
I see a strong intraday bullish confirmation today.
After a test of an underlined blue support area,
the price went up strongly and violated a resistance line
of a bullish flag pattern on a 4H time frame.
The market is going to rise more.
Goal - 68.2
❤️Please, support my work with like, thank you!❤️
I am part of Trade Nation's Influencer program and receive a monthly fee for using their TradingView charts in my analysis.
USOIL:Today's Trading Strategy
Oil prices have signs of upward breakthrough at present, yesterday's trend broke the short - term narrow range of shock range, on the idea of retracting to do more. The more appropriate long point is 66-66.3, if short, the more appropriate point is 67-67.4, but the short position is recommended not to be too heavy, not to do less than the point.
Trading Strategy:
SELL@67-67.4
TP: 66-66.3
BUY@66-66.3
TP: 67.5-68
More detailed strategies and trading will be notified here ↗↗↗
Keep updated, come to "get" ↗↗↗
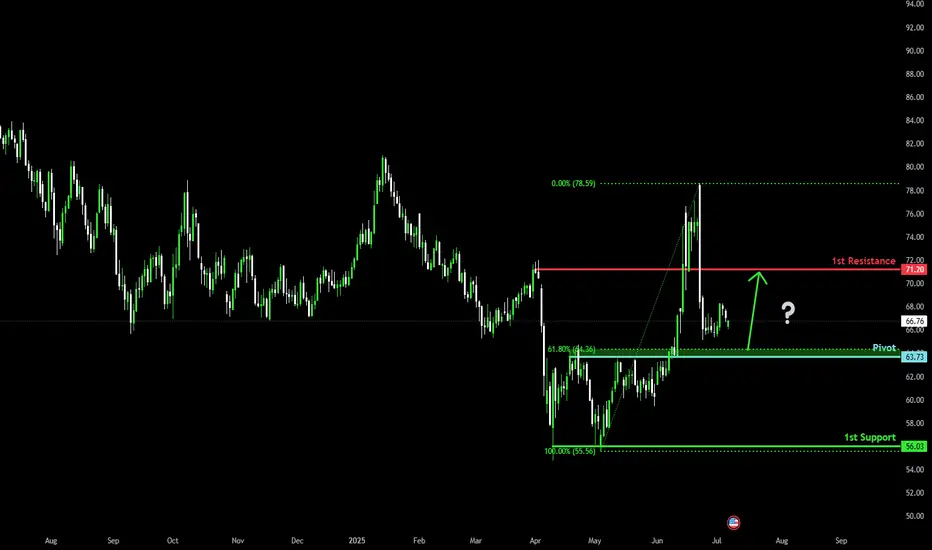
Falling towards pullback support?WTI Oil (XTI/USD) is falling towards the pivot and could bounce to the 1st resistance.
Pivot: 63.73
1st Support: 56.03
1st Resistance: 71.20
Risk Warning:
Trading Forex and CFDs carries a high level of risk to your capital and you should only trade with money you can afford to lose. Trading Forex and CFDs may not be suitable for all investors, so please ensure that you fully understand the risks involved and seek independent advice if necessary.
Disclaimer:
The above opinions given constitute general market commentary, and do not constitute the opinion or advice of IC Markets or any form of personal or investment advice.
Any opinions, news, research, analyses, prices, other information, or links to third-party sites contained on this website are provided on an "as-is" basis, are intended only to be informative, is not an advice nor a recommendation, nor research, or a record of our trading prices, or an offer of, or solicitation for a transaction in any financial instrument and thus should not be treated as such. The information provided does not involve any specific investment objectives, financial situation and needs of any specific person who may receive it. Please be aware, that past performance is not a reliable indicator of future performance and/or results. Past Performance or Forward-looking scenarios based upon the reasonable beliefs of the third-party provider are not a guarantee of future performance. Actual results may differ materially from those anticipated in forward-looking or past performance statements. IC Markets makes no representation or warranty and assumes no liability as to the accuracy or completeness of the information provided, nor any loss arising from any investment based on a recommendation, forecast or any information supplied by any third-party.
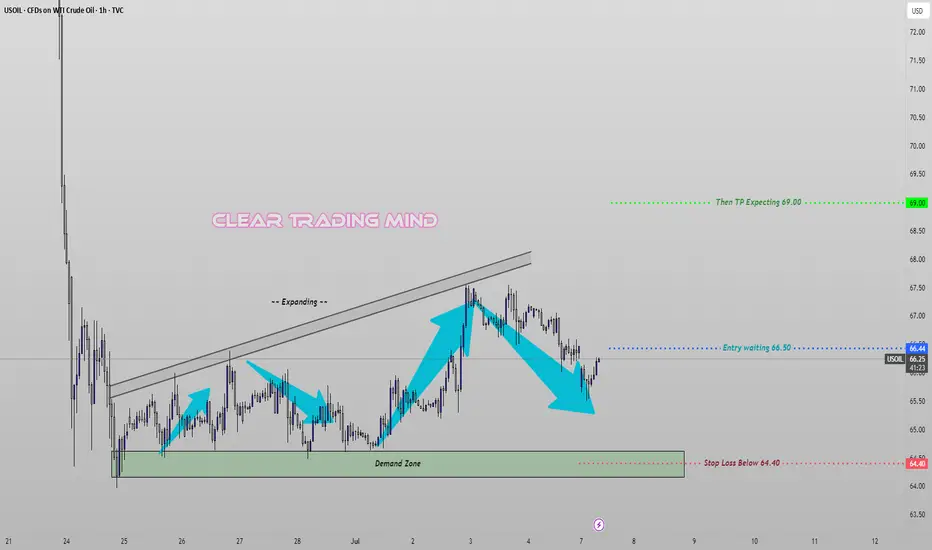
Crude Oil Eyes Bullish Breakout – Demand Zone Holding StrongCrude Oil (USOIL) is forming a potential bullish reversal structure on the 1H timeframe, supported by repeated bounces from a well-respected demand zone. Price currently consolidates below the key resistance level with a visible expanding channel, hinting at possible volatility and breakout.
🔹 Trade Idea:
I’m waiting for a clear break and close above 66.50 for a valid long entry. The setup remains invalid unless price confirms this breakout.
🔹 Technical Highlights:
- Strong demand zone held price multiple times
- Formation of higher impulses with retracements aligning well with Fibonacci levels
- Market structure suggests a continuation toward upper targets if 66.50 is broken with momentum
🔹 Trade Plan:
- Buy Above: 66.50 (breakout confirmation)
- Stop Loss: 64.40 (below demand zone and structure support)
- Target: 69.00 (near 2.272 Fibonacci extension)
⚠️ Note: No entry unless 66.50 is broken convincingly. Setup favors disciplined execution only on confirmation.
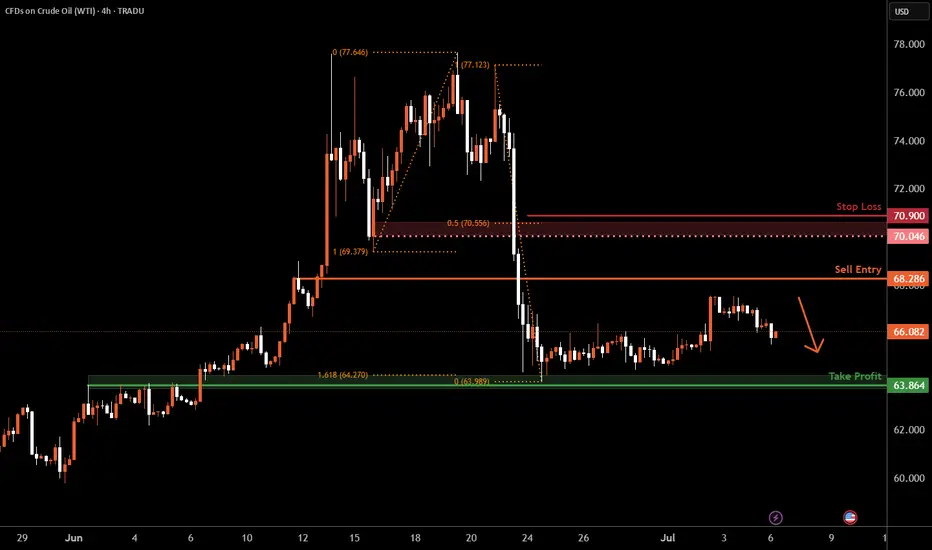
WTI Oil H4 | Heading into a pullback resistanceWTI oil (USOIL) could rise towards a pullback resistance and potentially reverse off this level to drop lower.
Sell entry is at 68.28 which is a pullback resistance.
Stop loss is at 70.90 which is a level that sits above the 50% Fibonacci retracement and a pullback resistance.
Take profit is at 63.86 which is a pullback support that aligns closely with the 161.8% Fibonacci extension.
High Risk Investment Warning
Trading Forex/CFDs on margin carries a high level of risk and may not be suitable for all investors. Leverage can work against you.
Stratos Markets Limited (tradu.com ):
CFDs are complex instruments and come with a high risk of losing money rapidly due to leverage. 63% of retail investor accounts lose money when trading CFDs with this provider. You should consider whether you understand how CFDs work and whether you can afford to take the high risk of losing your money.
Stratos Europe Ltd (tradu.com ):
CFDs are complex instruments and come with a high risk of losing money rapidly due to leverage. 63% of retail investor accounts lose money when trading CFDs with this provider. You should consider whether you understand how CFDs work and whether you can afford to take the high risk of losing your money.
Stratos Global LLC (tradu.com ):
Losses can exceed deposits.
Please be advised that the information presented on TradingView is provided to Tradu (‘Company’, ‘we’) by a third-party provider (‘TFA Global Pte Ltd’). Please be reminded that you are solely responsible for the trading decisions on your account. There is a very high degree of risk involved in trading. Any information and/or content is intended entirely for research, educational and informational purposes only and does not constitute investment or consultation advice or investment strategy. The information is not tailored to the investment needs of any specific person and therefore does not involve a consideration of any of the investment objectives, financial situation or needs of any viewer that may receive it. Kindly also note that past performance is not a reliable indicator of future results. Actual results may differ materially from those anticipated in forward-looking or past performance statements. We assume no liability as to the accuracy or completeness of any of the information and/or content provided herein and the Company cannot be held responsible for any omission, mistake nor for any loss or damage including without limitation to any loss of profit which may arise from reliance on any information supplied by TFA Global Pte Ltd.
The speaker(s) is neither an employee, agent nor representative of Tradu and is therefore acting independently. The opinions given are their own, constitute general market commentary, and do not constitute the opinion or advice of Tradu or any form of personal or investment advice. Tradu neither endorses nor guarantees offerings of third-party speakers, nor is Tradu responsible for the content, veracity or opinions of third-party speakers, presenters or participants.
USOIL : What will happen to the price of oil?Hello friends
As you can see, we had support in the past, which has now become a strong resistance for the price after it was broken.
Now we need to see if the price will manage to break it at this moment when it is close to its key and sensitive resistance.
*Trade safely with us*
USOIL: Will Keep Growing! Here is Why:
The charts are full of distraction, disturbance and are a graveyard of fear and greed which shall not cloud our judgement on the current state of affairs in the USOIL pair price action which suggests a high likelihood of a coming move up.
Disclosure: I am part of Trade Nation's Influencer program and receive a monthly fee for using their TradingView charts in my analysis.
❤️ Please, support our work with like & comment! ❤️
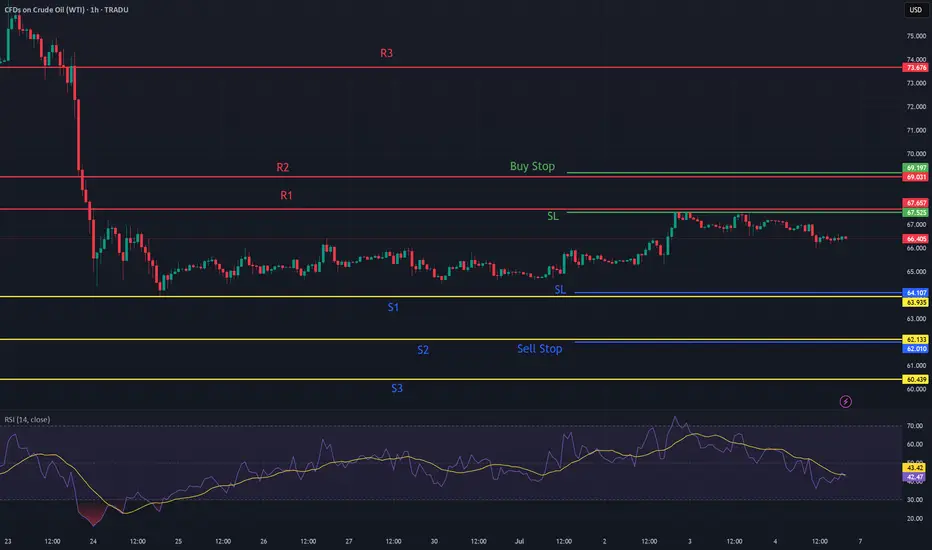
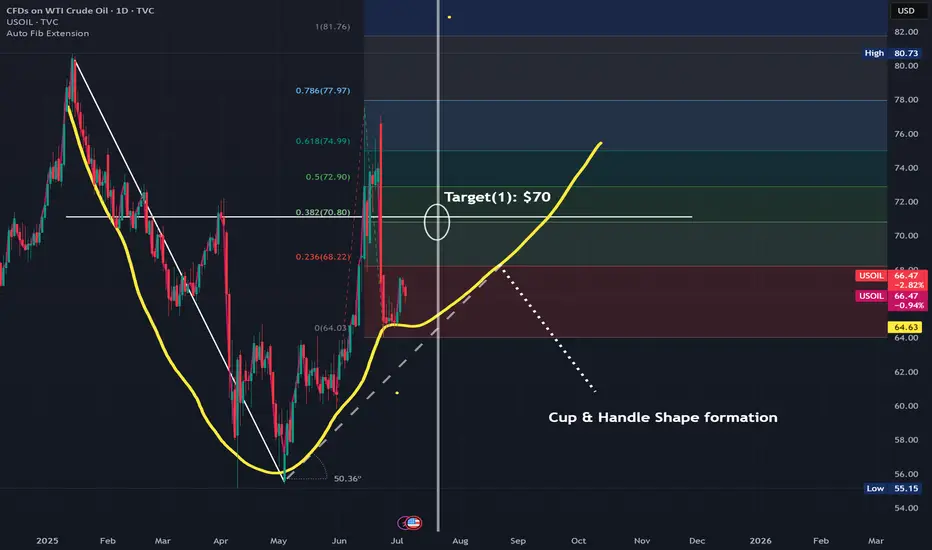
US Oil - July WK#2 ExpectationsNYSE:TVC :
USOIL Last trade close @ $66.5.
Expected to start the week @ $68.xx.
The formation of cup & handle shape lead to continuous increase to start hitting 1st Target @ $70.
Trump will announce Tariffs implementation will support increasing prices.
OIL: Sideways - Waiting for R2/S2 BreakoutsOil has been in a clear sideways consolidation for several days, reflecting a period of indecision in the market. While this tight range holds, a patient approach to trading is warranted. A long position will be considered if a confirmed breakout and sustained price action above R2 occur, indicating strong bullish momentum. Conversely, if oil breaks down and holds below S2, a short position will be initiated, anticipating further bearish movement. This current consolidation phase suggests a significant directional move is likely imminent, and observation of these key resistance and support levels will be crucial for entry signals.