CFDs on Crude Oil (WTI) forum
Idea: Today's crude oil trading stra…
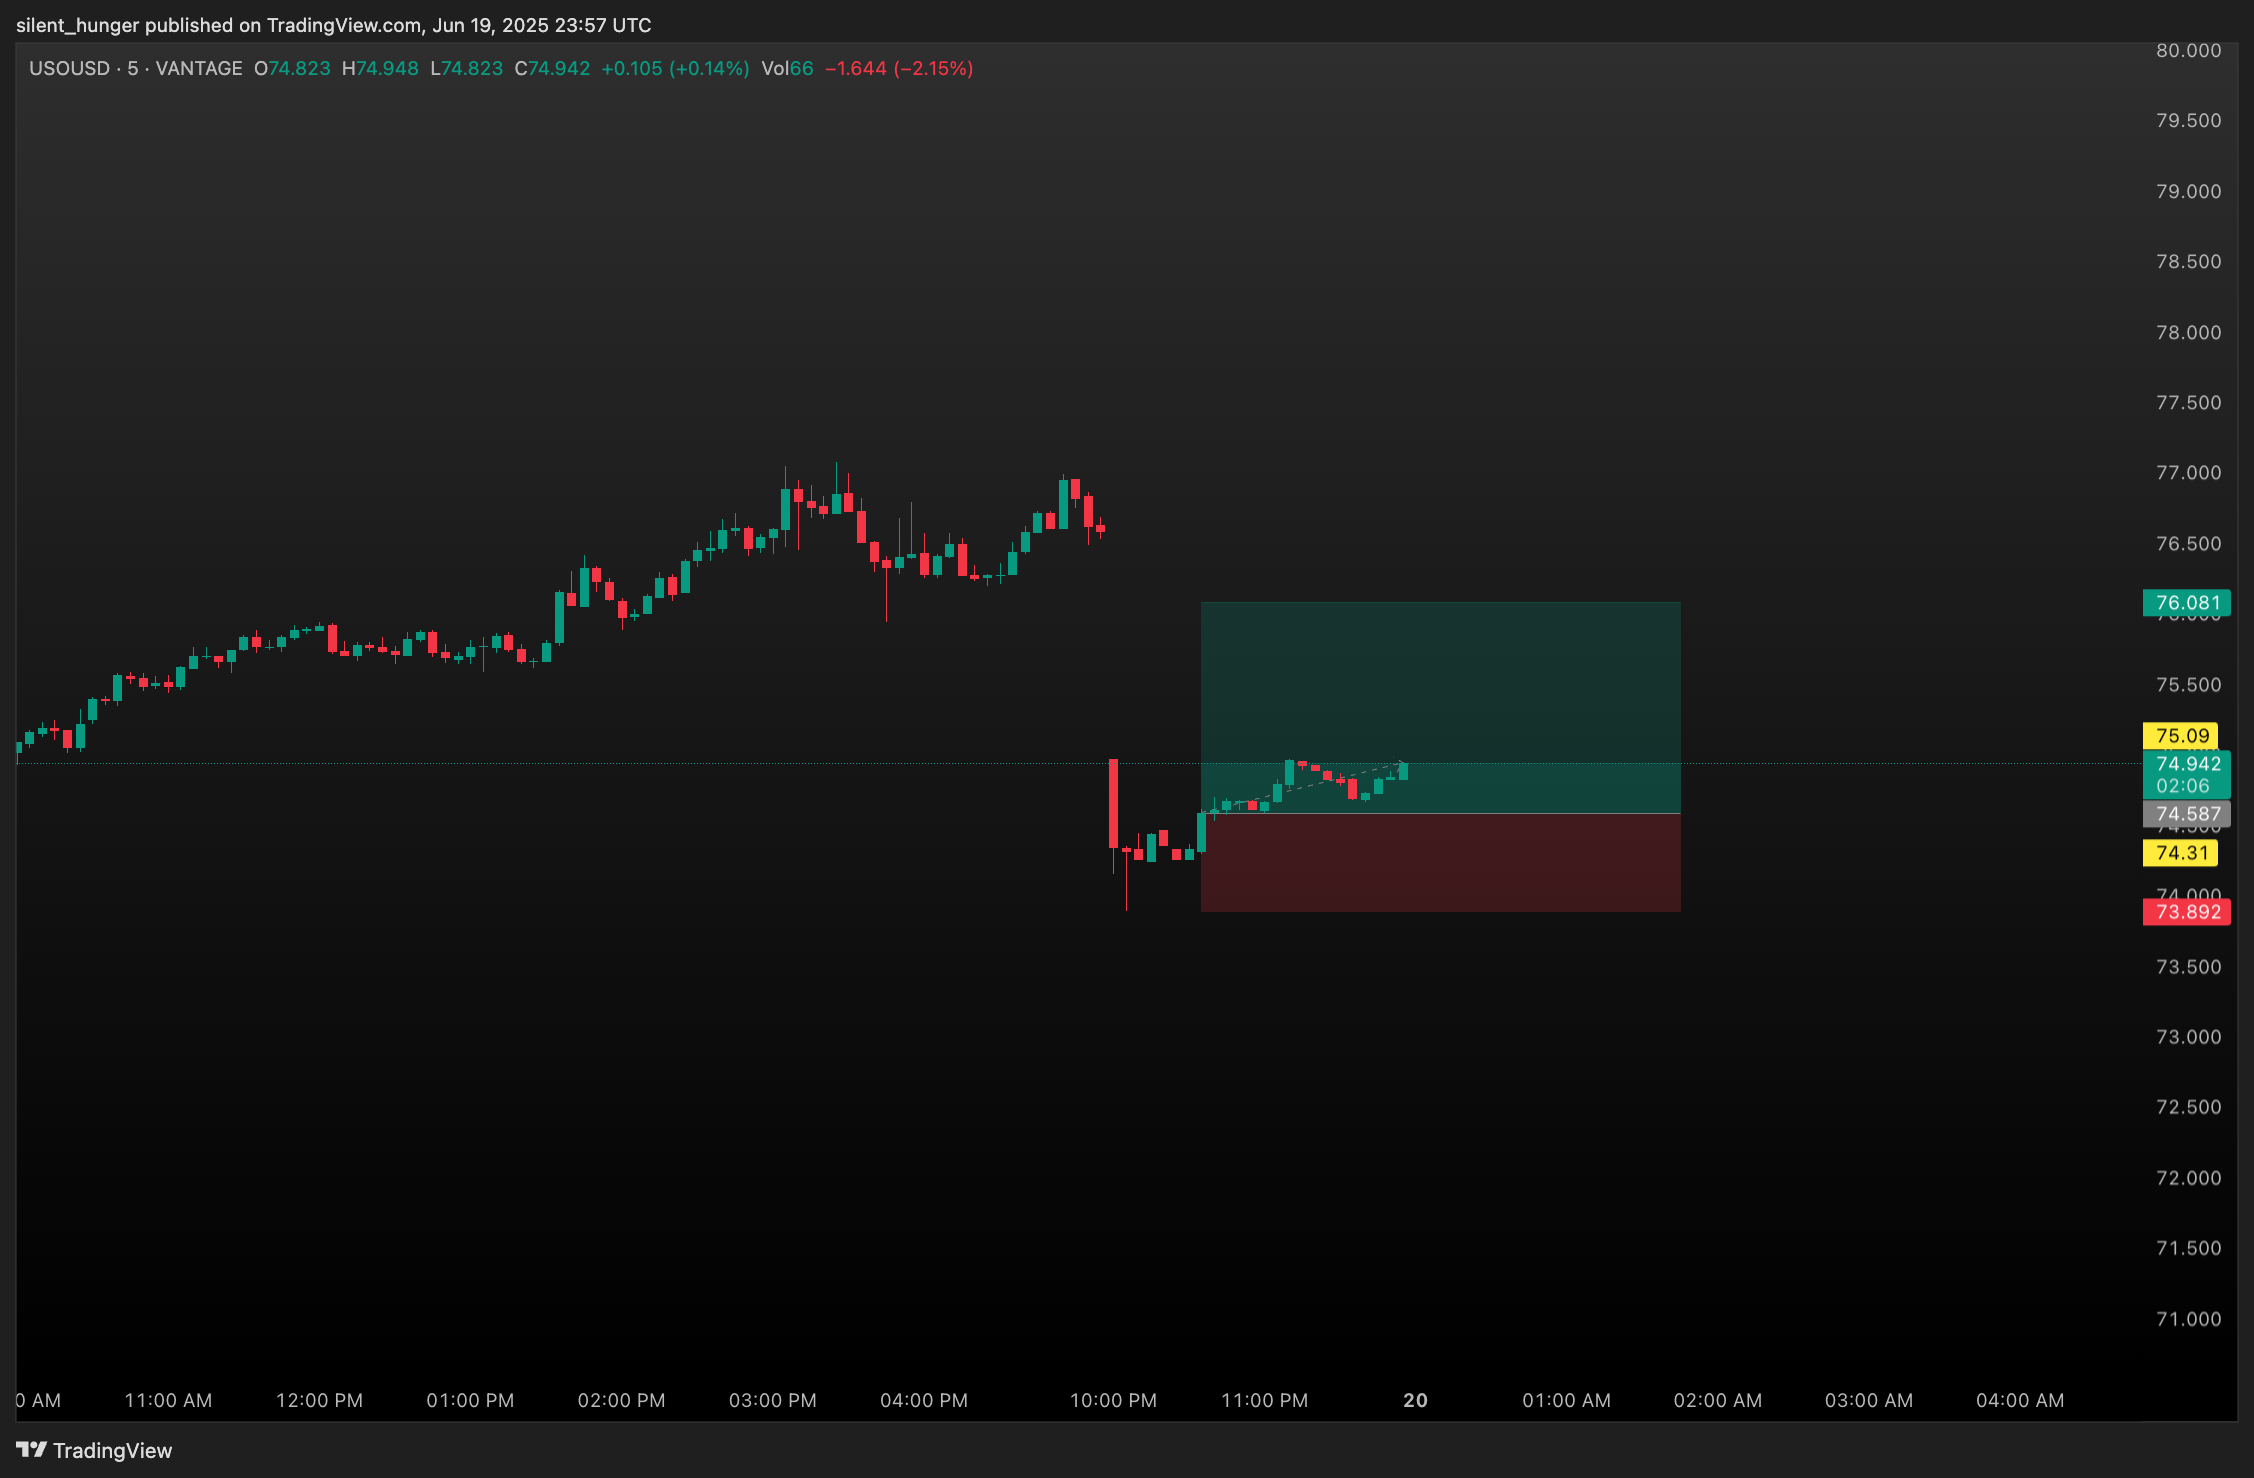
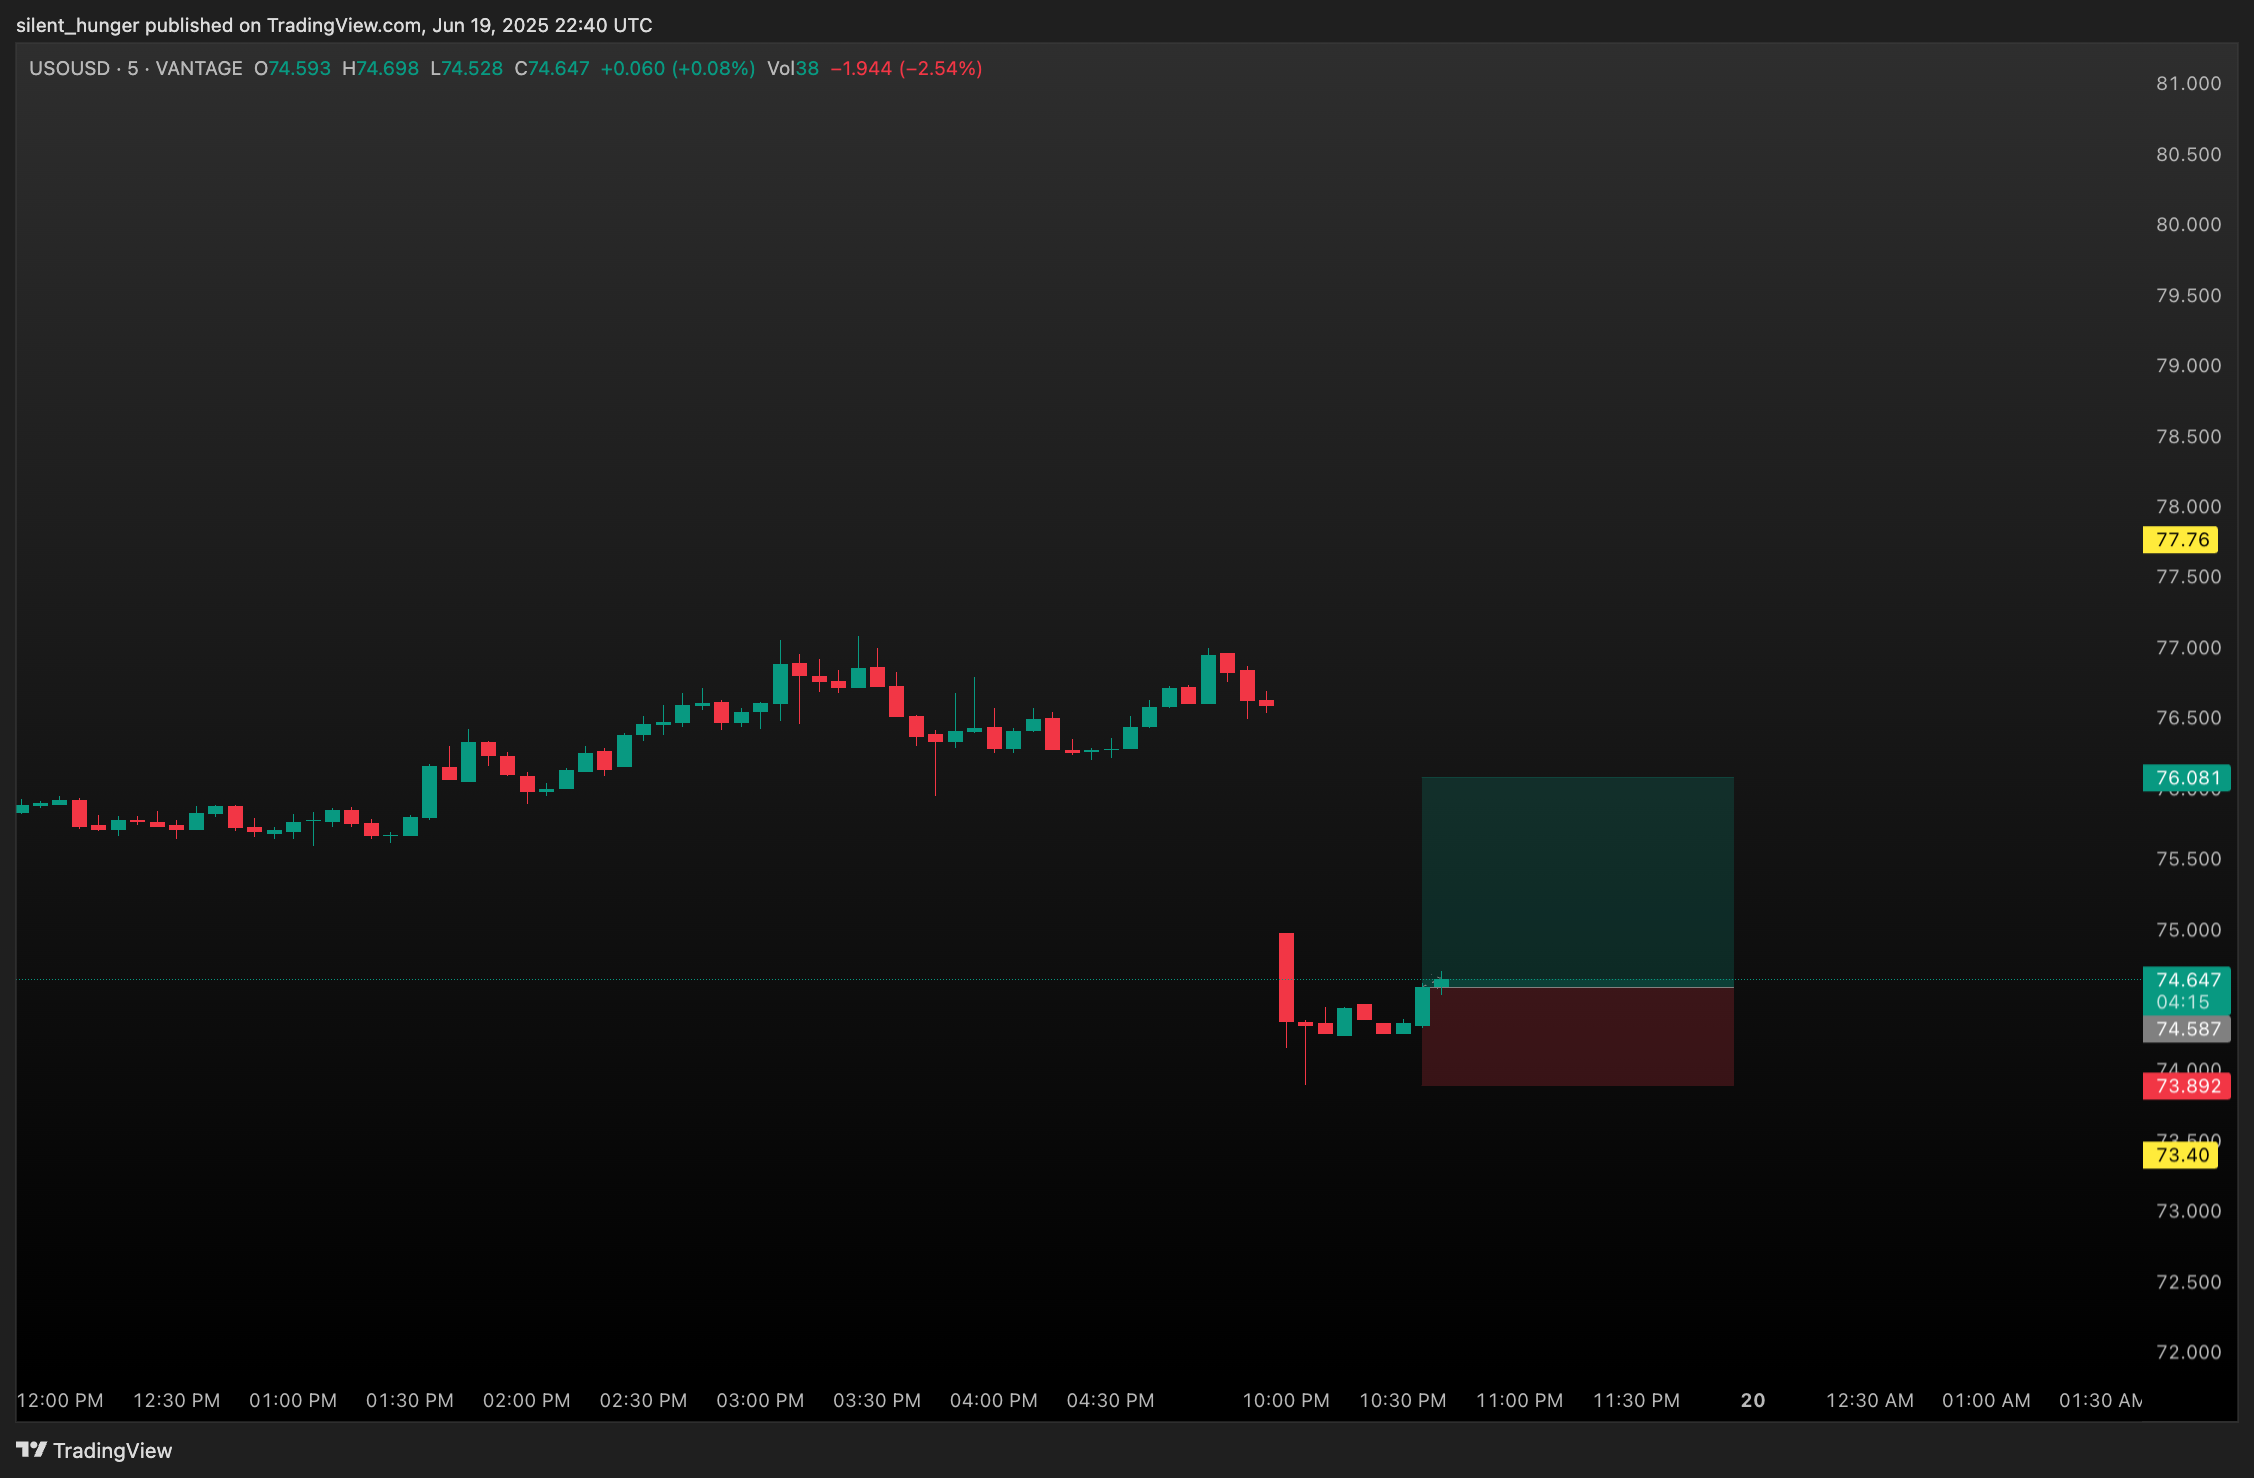
Trump’s “ambiguous” statement, where will oil prices go?
 USOIL
USOIL
Idea: Trump’s “ambiguous” statement,… WTI
WTI
Idea: Trump’s “ambiguous” statement,…
The Hourly is now in Bearish (directional) Market Bias from the bears dropping below the Bearish Trendline (in red dotted line).
A giant Inside Day pattern formed for a market pause with no true direction. We'll see consolidation until a true (and not a fake) breakout from either the pattern's low of 72.604 or high of 75.674 (shown as two, orange horizontal lines).
*Side Note:
Price action is sort of "stuck" between the strong forces of Resistance from the tall bearish candle's midline (at 74.467) to high (at 75.674), while dealing with three levels of strong Support Areas below from the Swing Low (of 72.914), S&R Zone, and low of Inside Day at 72.604.
Does that mean we'll see a lot of consolidation until a breakout from this? We'll see.


There's suspicion that any brokerages that closed before the tall bearish candle was to keep retail traders from shorting this to really low levels.
When a "Black Swan" event happened last August of 2024, triggered by the Bank of Japan raising its interest rate, a number of brokerages gave out an error response, preventing traders from trading.
Feel free to share your thoughts about this.