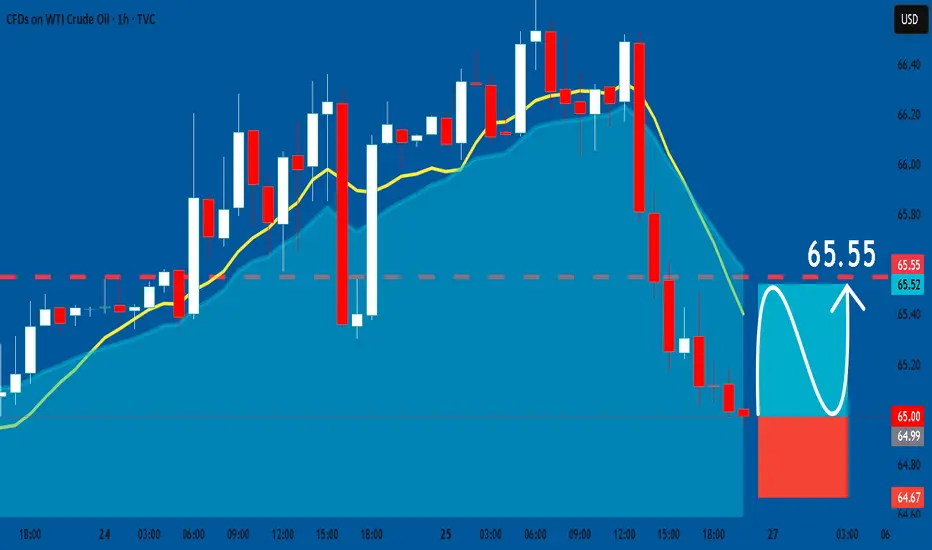
USOIL: Long Trade with Entry/SL/TP
USOIL
- Classic bullish setup
- Our team expects bullish continuation
SUGGESTED TRADE:
Swing Trade
Long USOIL
Entry Point - 65.00
Stop Loss - 64.67
Take Profit - 65.55
Our Risk - 1%
Start protection of your profits from lower levels
Disclosure: I am part of Trade Nation's Influencer program and receive a monthly fee for using their TradingView charts in my analysis.
❤️ Please, support our work with like & comment! ❤️
USOILSPOT trade ideas
Potential Long on WTI
Crude oil is showing potential for a bullish move due to increasing speculation about a possible agreement between China and the United States.
As we approach August 1st – the date associated with Trump's proposed tariff actions – the chances of a diplomatic breakthrough are growing.
If the two economic giants reach any form of understanding, it could trigger a wave of optimism in the oil market, potentially leading to a strong upward move.
Market participants should closely watch developments related to the US-China negotiations over the coming days.

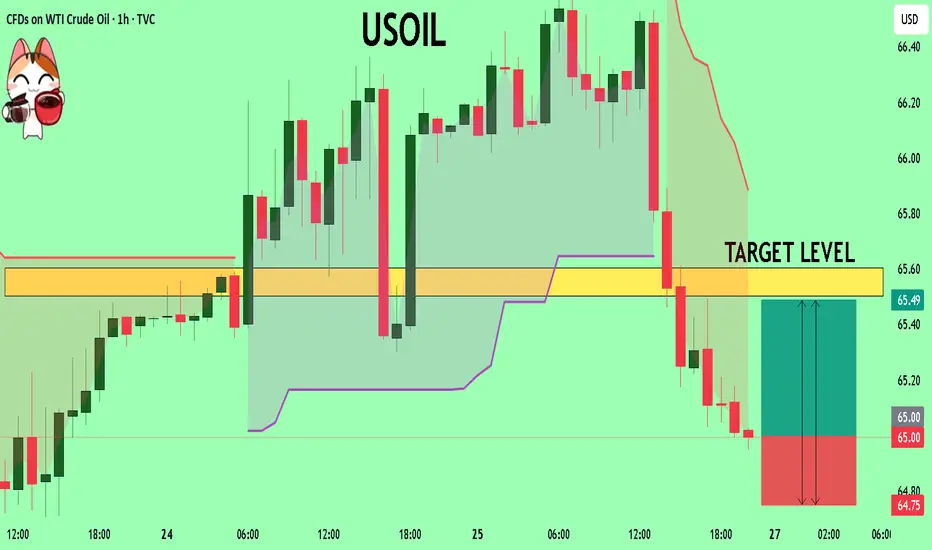
USOIL My Opinion! BUY!
My dear friends,
Please, find my technical outlook for USOIL below:
The instrument tests an important psychological level 65.00
Bias - Bullish
Technical Indicators: Supper Trend gives a precise Bullish signal, while Pivot Point HL predicts price changes and potential reversals in the market.
Target - 65.50
Recommended Stop Loss - 64.75
About Used Indicators:
Super-trend indicator is more useful in trending markets where there are clear uptrends and downtrends in price.
Disclosure: I am part of Trade Nation's Influencer program and receive a monthly fee for using their TradingView charts in my analysis.
———————————
WISH YOU ALL LUCK
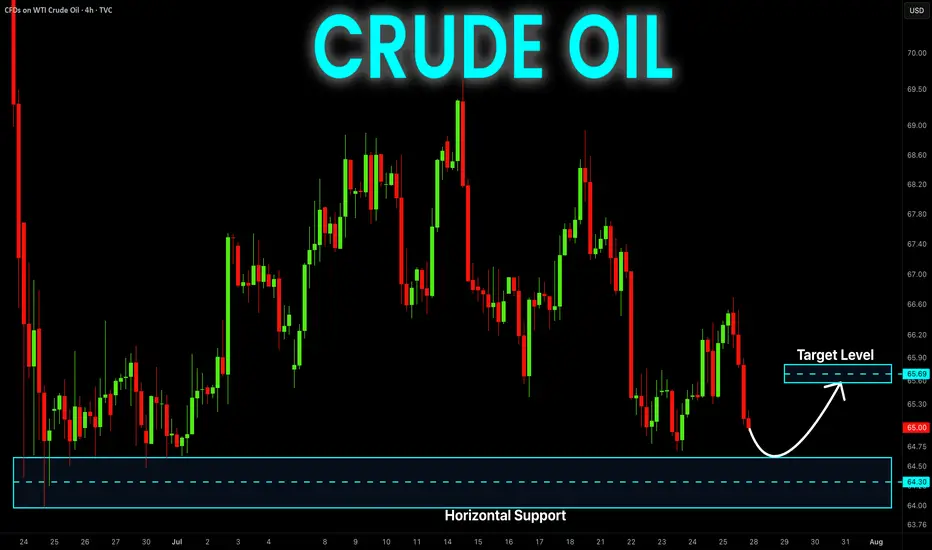
CRUDE OIL Risky Long! Buy!
Hello,Traders!
CRUDE OIL will soon hit
A horizontal support
Of 64.50$ and as it is
A strong level we will be
Expecting a local bullish
Rebound on Monday
Buy!
Comment and subscribe to help us grow!
Check out other forecasts below too!
Disclosure: I am part of Trade Nation's Influencer program and receive a monthly fee for using their TradingView charts in my analysis.
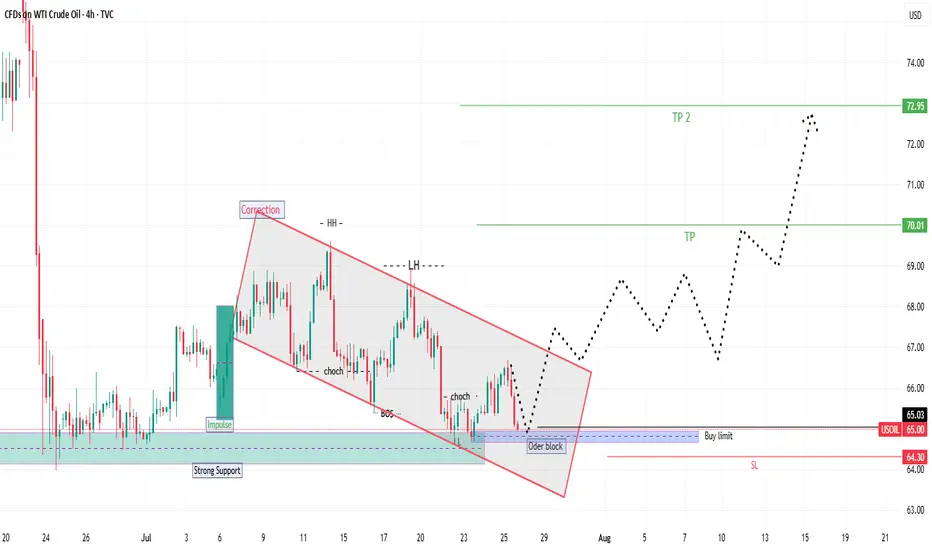
USOIL BUY Smart Money + trend analysis expecting bullish Smart Money + Elliott Wave analysis expecting bullish move after corrective wave (C) completes at demand zone with Order Block, FVG, and liquidity sweep confluence
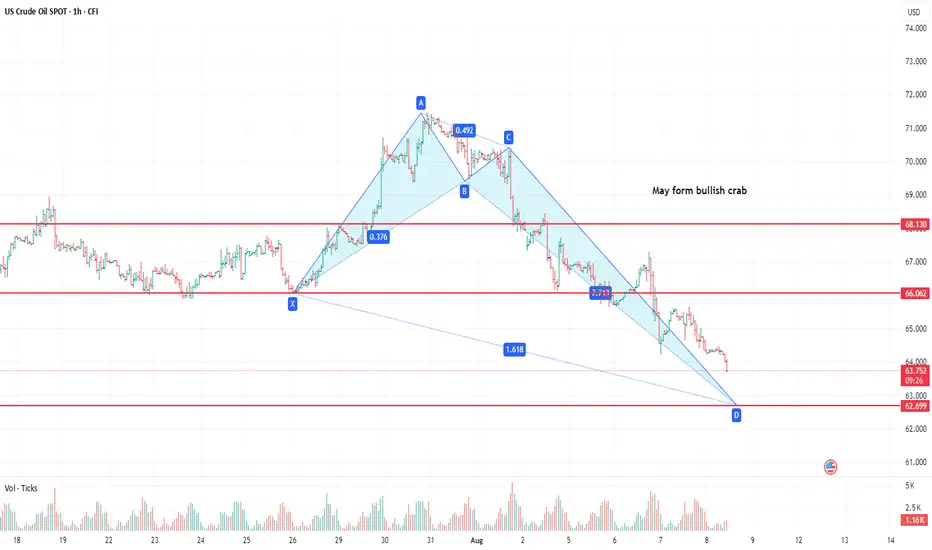
WTI crude spotafter breaching 65.238 wti get more weaker as its wave 3 or c open and may take it to 57-58 $ but one bearish crab again also appear may develop. Levels in chart, sell on rally market but near that level with sl and buy signal one can see reversal. I am not Sebi registered analyst. This is not buy , sell hold recommendation.
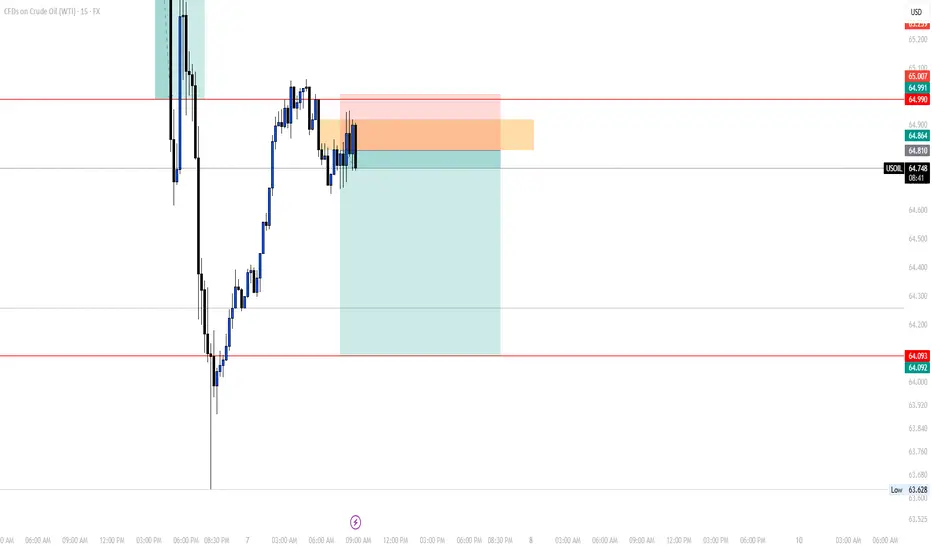
TP REACHEDOur 2nd trade of the day closed with profits.
We choose to close our trade right before it reached the main TP due to one reason, a pullback on a Liquidity lvl we have at 64.178 (5min chart).
It was a great day!
See you tomorrow!
Follow for more!
SELL USOILOur 2nd trade if the day on USOIL is a short one again since the price kept grabbing BSL to continue pushing lower and lower.
You can sell and follow the same levels as mine
Follow for more!
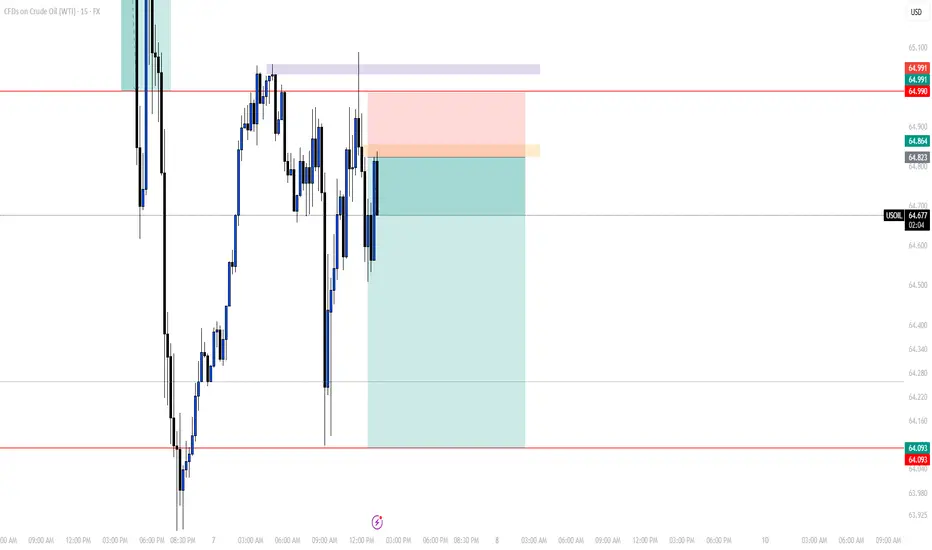
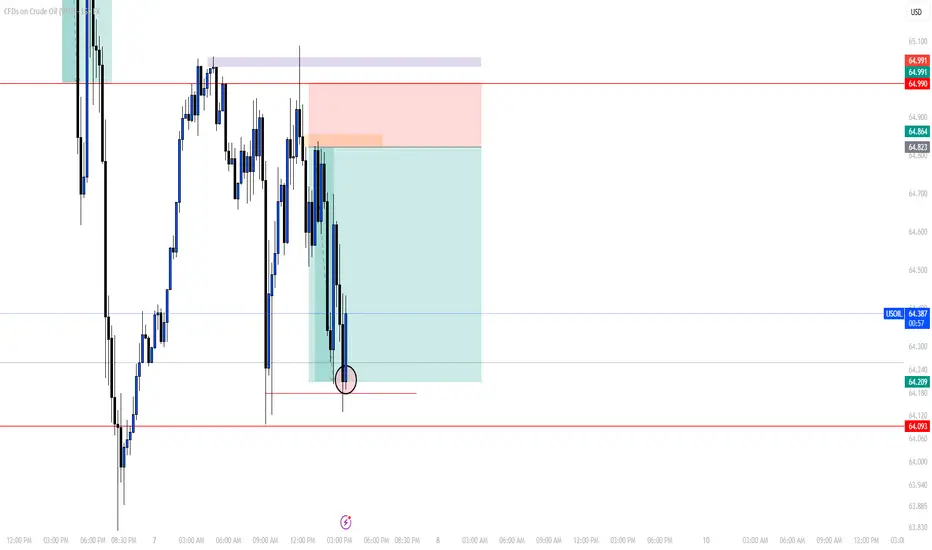
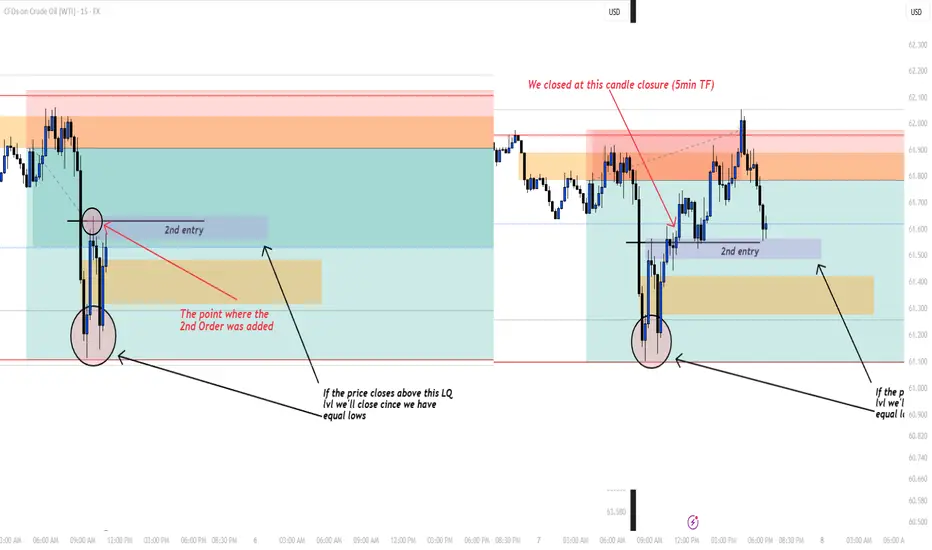
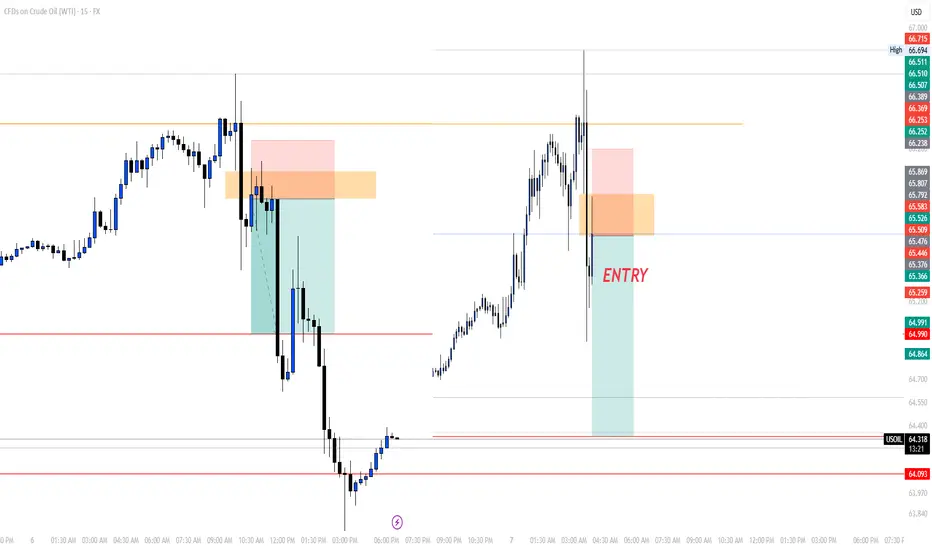
UPDATE ON THIS MORNING'S TRADEEarly in the morning, I posted a trade (Sell USOIL) in which we trargeted the LQ level which the market came closer to and didn't touch, which isn't a big deal.
As you can see on the chart, as I told my students during the LIVE TRADING SESSION they assisted, it's all about trade management.
On the screenshot on the left, we added another order at 50% lvl of the FVG, xhich the market respected at that moment before giving us a double bottom which is a sign to the change of the movement of the market.
For a safe closure of the trade, as you can see in the picture on the left, we waited for the market to break through the 5min LQ we have to close, and that's what exactly happened.
We'll wait for another trade to take later in the US session.
Follow for more!
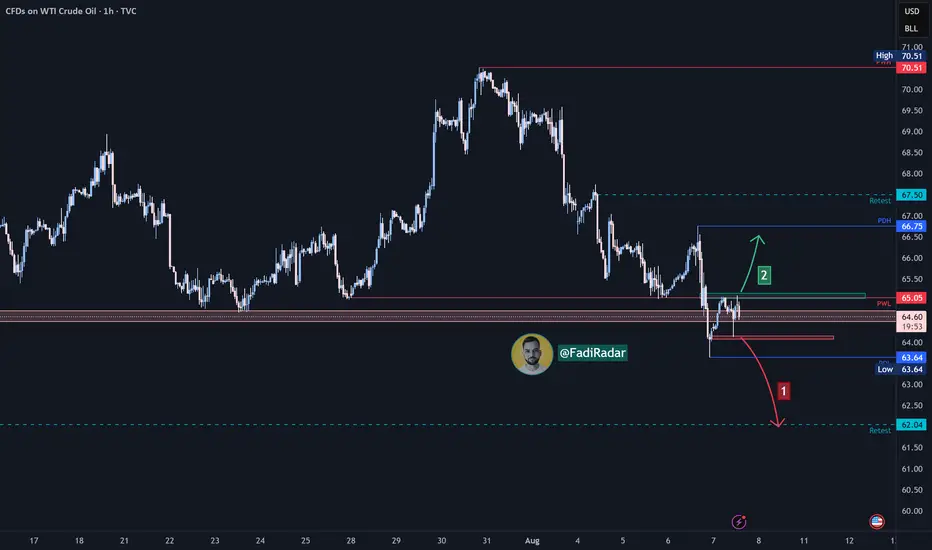
Crude Oil (WTI / USOIL) Analysis:Crude oil is currently trading near a short-term support zone around $64.70.
🔻 Bearish Scenario:
If the price breaks below $64.00 and holds beneath it, we could see a decline toward $63.60 as the first target, followed by $62.00 as a secondary target.
🔺 Bullish Scenario:
On the other hand, if the price regains bullish momentum and breaks above $65.00, we may see a retest of the $66.70 area, and with continued buying pressure, a potential move toward $67.50.
⚠️ Disclaimer:
This analysis is not financial advice. It is recommended to monitor the markets and carefully analyze the data before making any investment decisions.
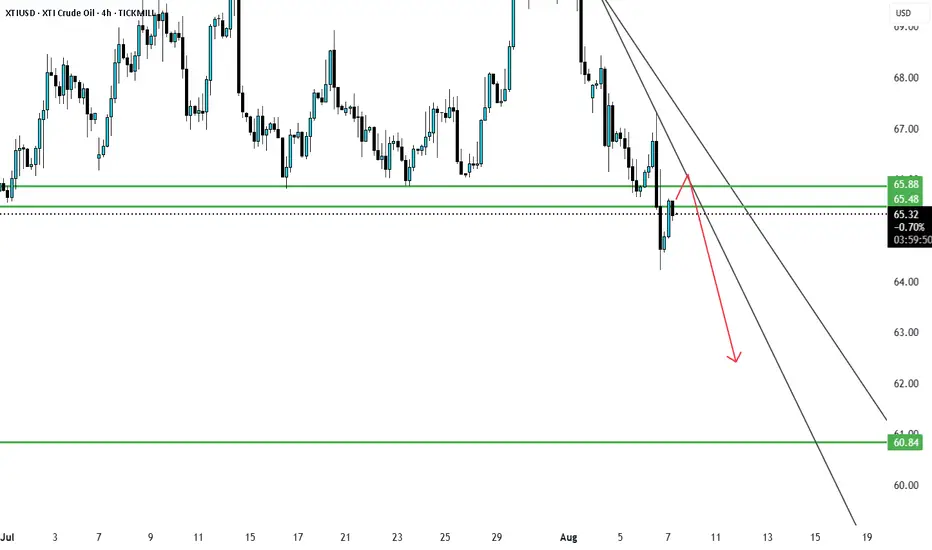
XTIUSD Broken Major support and retesting currentlyXTI/USD has broken a major support level and is currently retesting it. The price is expected to resume its downward movement toward the next support zone. Upcoming news tomorrow may influence the market, so please trade with caution.
SELL USOILThis morning we're going short again on OIL, since as you can see the price grabbed the LQ and gave us a proper rntry point we entered based on 1h ago.
Follow for more!
OUR TRADE FOR THE DAYEarly today, I posted that we'll be waiting for the market to give us an entry after grabbing the liquidity, we did have it and caught it.
I didn't share it since it was given to my students.
As you can see on the chart, the market gave us a FVG after that it did grab the liquidity which we entered based on to target again the LQ level to close with a good margin.
Follow for more!
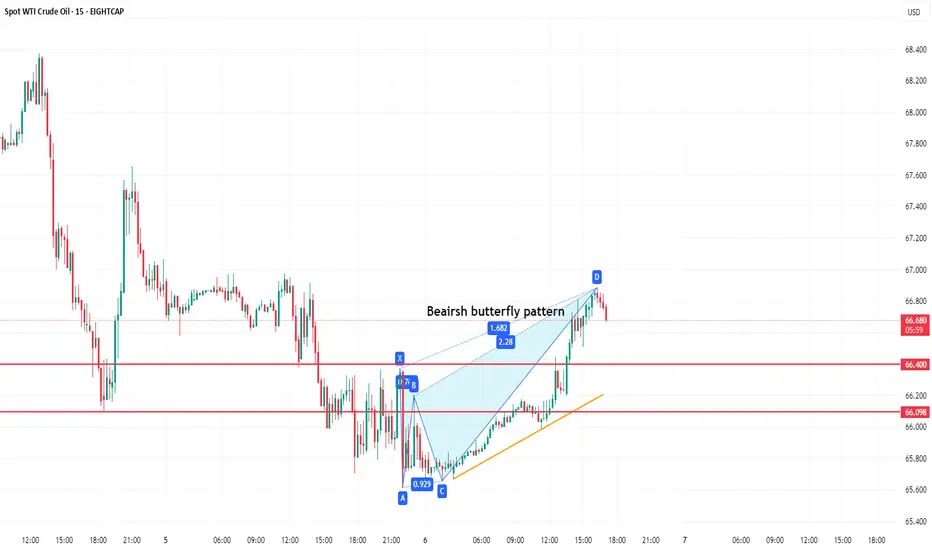
WTI SPOT CRUDEBearish butterfly appear completed, and near completion ratio once reversed, Wave wise also reversal possible wave B in lower degree appear to be completed.
WTI Crude: Bulls on the Back FootWTI crude oil has found plenty of willing buyers beneath $65 per barrel recently, often acting as a launchpad for abrupt squeezes higher. But with supply gushing as OPEC+ returns 2.2 million barrels per day to market at a time when concerns about the U.S. economy are growing, whether that continues remains debatable—especially after the sharp $5-plus slide over the past week.
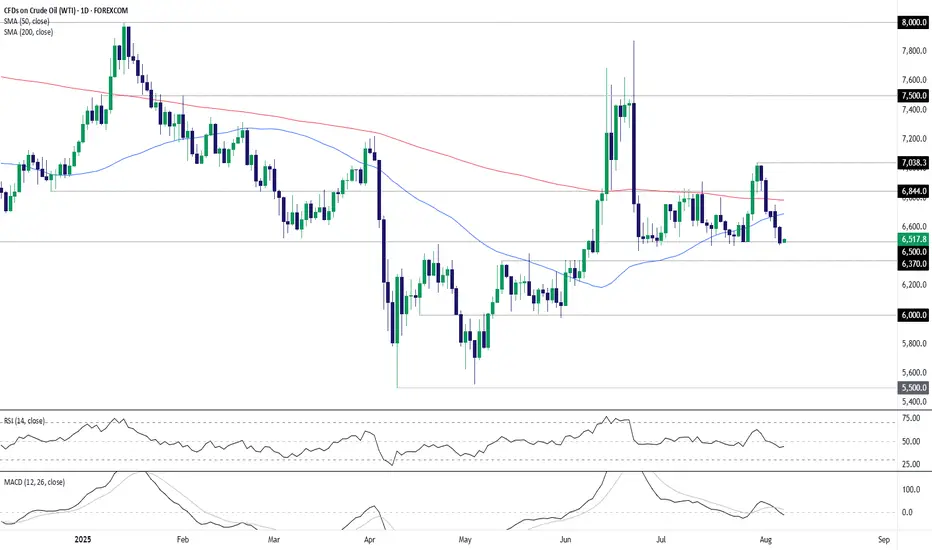
With the price closing at its lowest level since early June on Tuesday, traders should be alert to the risk of an extension of the bearish move.
Given how often the price has been bid up beneath $65, the inclination is not to act immediately if Tuesday’s lows are taken out. Instead, $63.70 is a level to watch, having acted as resistance through May and June. A break below there would create a cleaner setup for shorts, allowing positions to be initiated with a stop just above for protection. $62.00 saw some action earlier in the year, but $60 looks the more compelling downside target.
RSI (14) is beneath 50 while MACD is negative, having already crossed below the signal line—both hinting that selling rallies may work better than buying dips near term.
Of course, if the contract can’t break $65 meaningfully despite the bearish backdrop, the setup could be flipped, allowing for longs to be established above with a stop beneath, targeting either the 200-day moving average or $68.44 resistance.
Good luck!
DS
SELL USOILI'm sharing with you our trade for this morning on OIL, which we caught based on a reversal and the 2:25am (NY Time) FVG.
Follow for more!

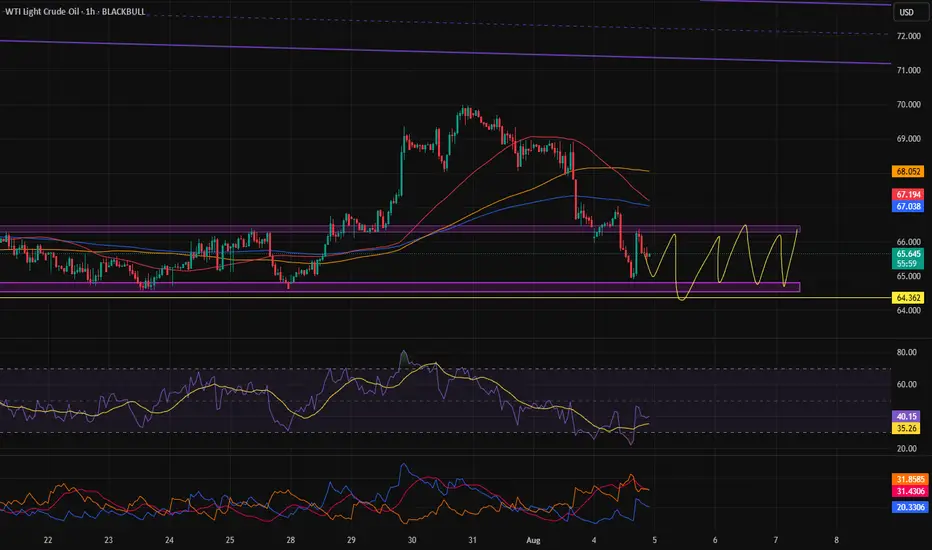
Price returning into the channel is frustrating.After a long time, oil managed to break out of that channel, but we see it has returned back inside the channel again. Hopefully, it will break out from one side soon so we can catch a good opportunity.
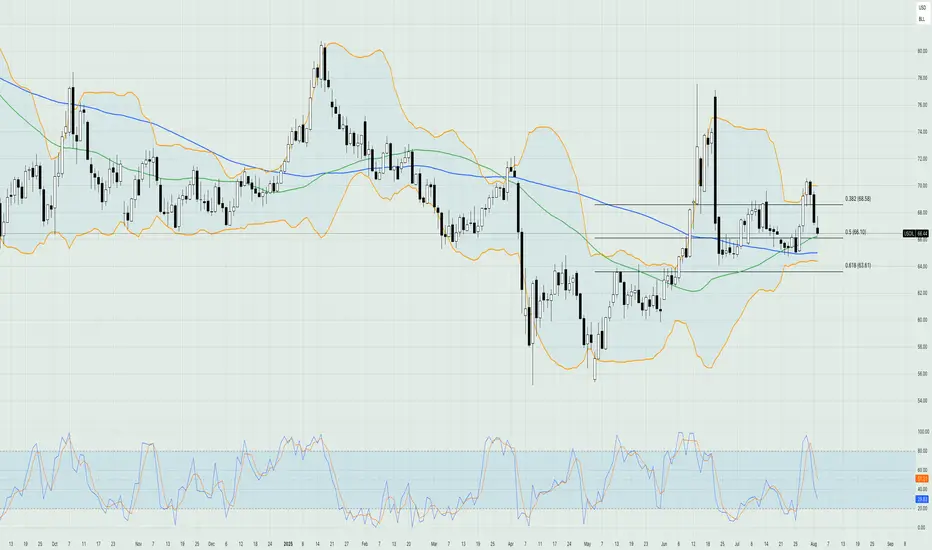
Crude Oil drops below $70, reversal on the radar?Oil opened the week under pressure after OPEC+ confirmed a 547,000 bpd increase for September, completing a 2.5 million bpd reversal of past cuts—about 2.4% of global demand. The group is now undecided—future moves could be more hikes, a pause, or even cuts, depending on market conditions. Actual supply growth may be closer to 1.7 million bpd due to member constraints, while expectations are that this could be the last hike amid slowing demand and rising non-OPEC output. With oil demand softening, a Q4 surplus looming, and prices under $70, holding steady seems likely for now. Meanwhile, geopolitical pressure from Trump over Russian oil adds more uncertainty, where a final call by OPEC may come at the next meeting on September 7.
On the technical side, the price of crude oil is currently testing the support of the 50% weekly Fibonacci retracement level while the moving averages are still validating a bullish trend in the market. The Bollinger bands are expanding, showing that volatility is picking up in the market for crude oil, while the Stochastic oscillator is approaching extreme oversold levels, hinting that a bullish correction might be on the horizon in the upcoming sessions. If this scenario becomes reality, then the first area of potential resistance might be seen around the $70 level, which consists of the psychological resistance of the round number, the upper band of the Bollinger bands, and the previous medium-term high since late July.
Disclaimer: The opinions in this article are personal to the writer and do not reflect those of Exness
USOIL: Long Trade with Entry/SL/TP
USOIL
- Classic bullish pattern
- Our team expects retracement
SUGGESTED TRADE:
Swing Trade
Buy USOIL
Entry - 67.25
Stop - 66.67
Take - 68.53
Our Risk - 1%
Start protection of your profits from lower levels
Disclosure: I am part of Trade Nation's Influencer program and receive a monthly fee for using their TradingView charts in my analysis.
❤️ Please, support our work with like & comment! ❤️


WTIWTI crude oil (West Texas Intermediate) is one of the main global benchmarks for oil pricing, alongside Brent crude. It is a light, sweet crude oil primarily produced in the United States and traded on the New York Mercantile Exchange (NYMEX). WTI is known for its high quality and low sulfur content, making it ideal for refining into gasoline and other fuels. Crude oil prices are influenced by a wide range of factors including global supply and demand dynamics, geopolitical tensions, OPEC+ decisions, US shale production, and macroeconomic trends such as inflation and economic growth.
Over the past two decades, crude oil has experienced significant volatility. Prices surged to over $140 per barrel in 2008, collapsed during the global financial crisis, and again plummeted during the COVID-19 pandemic in 2020, when demand collapsed and prices briefly turned negative for the first time in history. The years following saw a sharp rebound as the global economy reopened and supply constraints persisted. However, rising interest rates, concerns about slowing global growth, and increasing energy transitions toward renewables have put downward pressure on oil demand in recent years.
As of August 2025, WTI crude oil is trading at $66.59 per barrel, reflecting a relatively weak energy market compared to its highs in 2022. The current price suggests concerns over slowing global industrial demand, increased US oil production, and ongoing geopolitical negotiations that have stabilized some of the previous supply shocks. While energy markets remain sensitive to global conflicts, economic shifts, and OPEC+ policy decisions, WTI at this level represents a market balancing between moderate demand and ample supply. It remains a critical asset for energy traders and a key indicator of global economic health.

Oil (WTI) – Upcoming Buy OpportunityBased on the analysis I conducted using fractals, oil is expected to move upward and provide buyers with a 2% gain, equivalent to 140 pips.

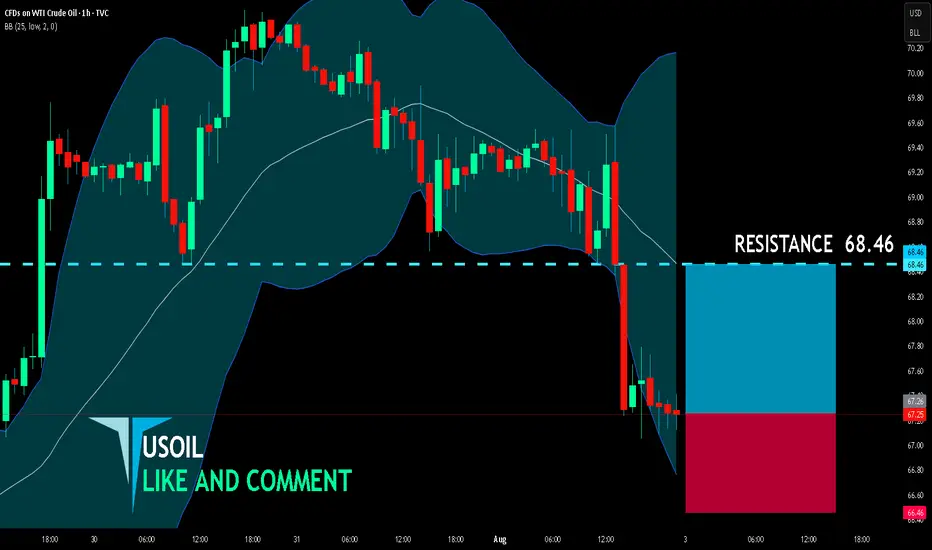
USOIL BULLS ARE STRONG HERE|LONG
USOIL SIGNAL
Trade Direction: short
Entry Level: 67.26
Target Level: 68.46
Stop Loss: 66.46
RISK PROFILE
Risk level: medium
Suggested risk: 1%
Timeframe: 1h
Disclosure: I am part of Trade Nation's Influencer program and receive a monthly fee for using their TradingView charts in my analysis.
✅LIKE AND COMMENT MY IDEAS✅