USOILBroke below strong daily support zone for about two months but came back above and looks to have retested the zone properly. Minor H4/H1 resistance around 66.70 that needs to be broken before possibly moving higher.
USOUSD trade ideas

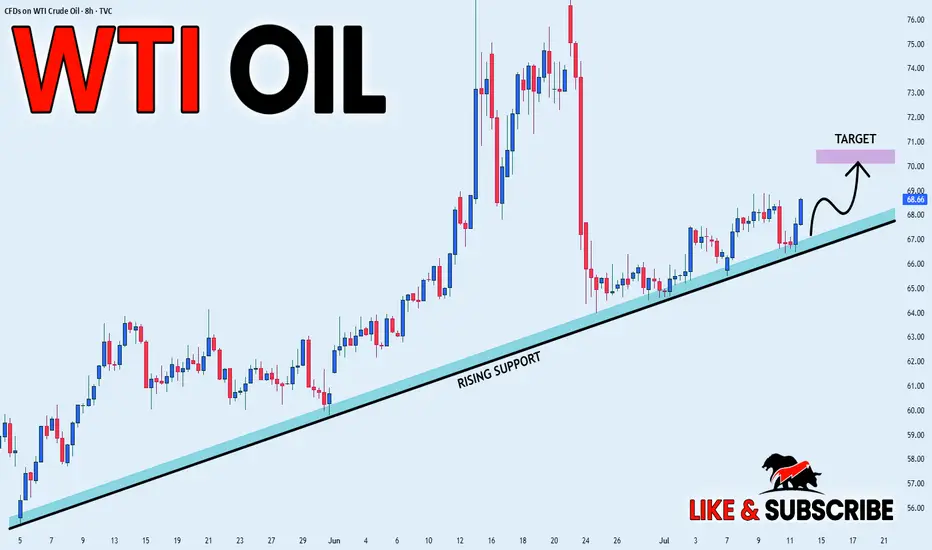
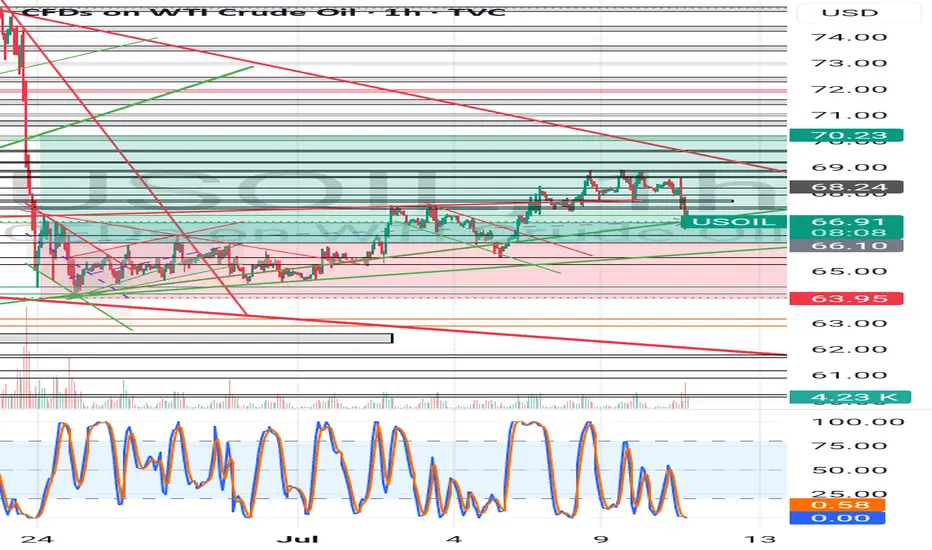
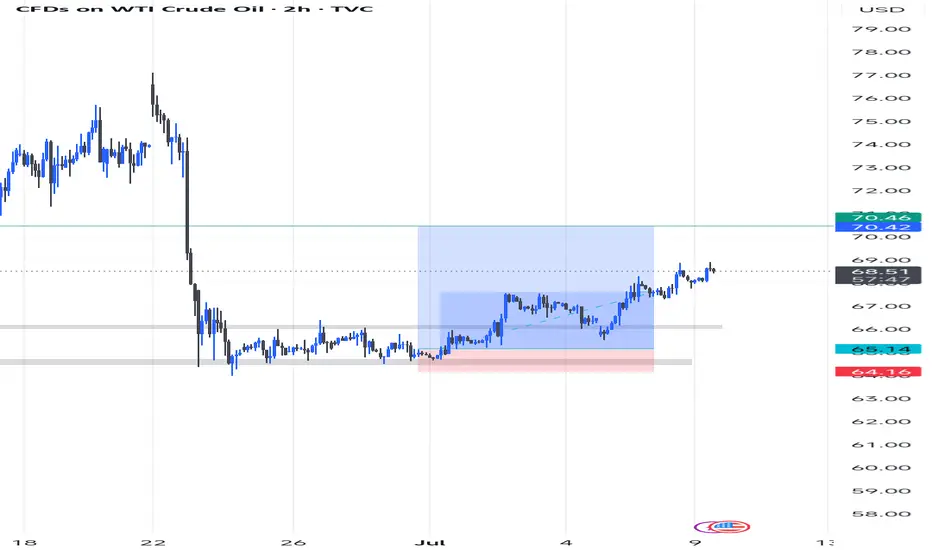
USOIL RISKY LONG|
✅CRUDE OIL is trading along
The rising support line
And as the price is going up now
After the retest of the line
I am expecting the price to keep growing
To retest the supply levels above at 70.20$
LONG🚀
✅Like and subscribe to never miss a new idea!✅
Disclosure: I am part of Trade Nation's Influencer program and receive a monthly fee for using their TradingView charts in my analysis.
WTI Support & Resistance Levels🚀 Here are some key zones I've identified on the 15m timeframe.
These zones are based on real-time data analysis performed by a custom software I personally developed.
The tool is designed to scan the market continuously and highlight potential areas of interest based on price action behavior and volume dynamics.
Your feedback is welcome!

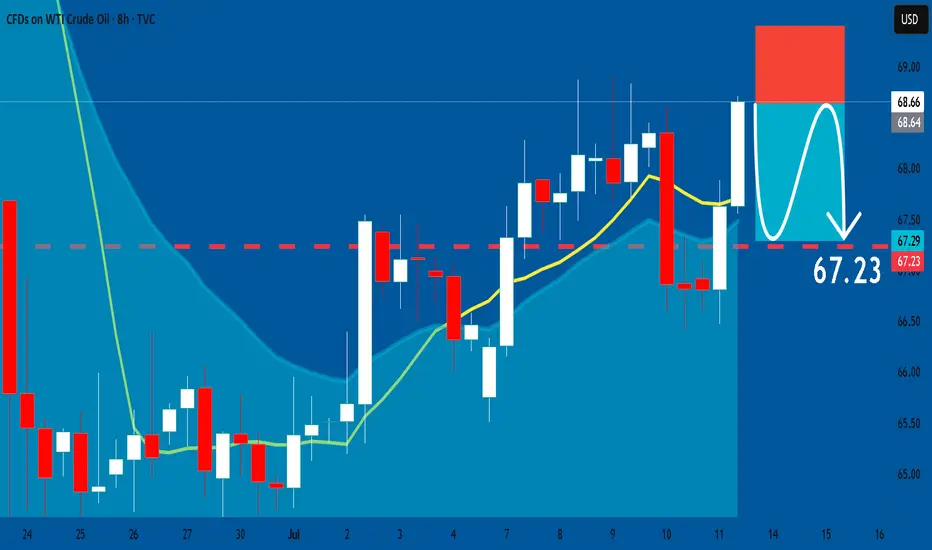
USOIL: Bearish Continuation & Short Trade
USOIL
- Classic bearish setup
- Our team expects bearish continuation
SUGGESTED TRADE:
Swing Trade
Short USOI
Entry Point - 68.66
Stop Loss - 69.40
Take Profit - 67.23
Our Risk - 1%
Start protection of your profits from lower levels
Disclosure: I am part of Trade Nation's Influencer program and receive a monthly fee for using their TradingView charts in my analysis.
❤️ Please, support our work with like & comment! ❤️
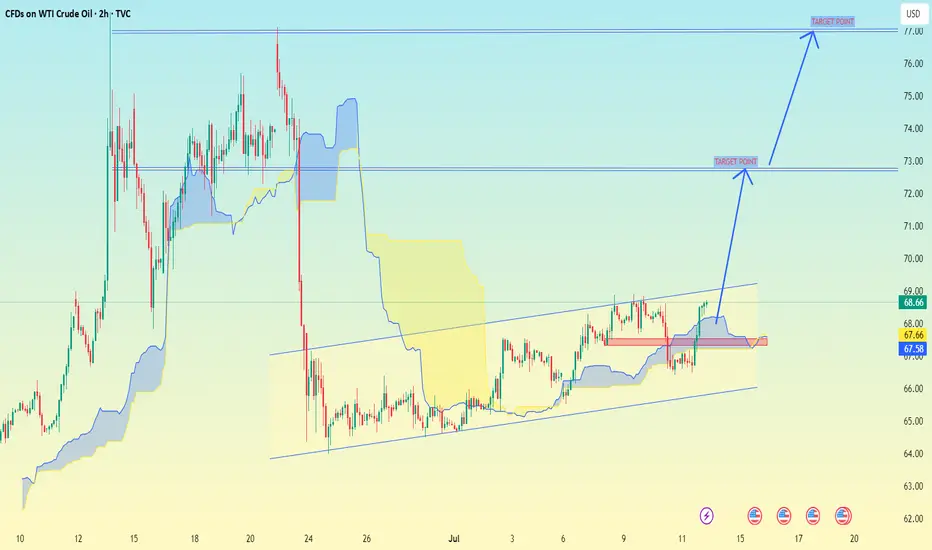
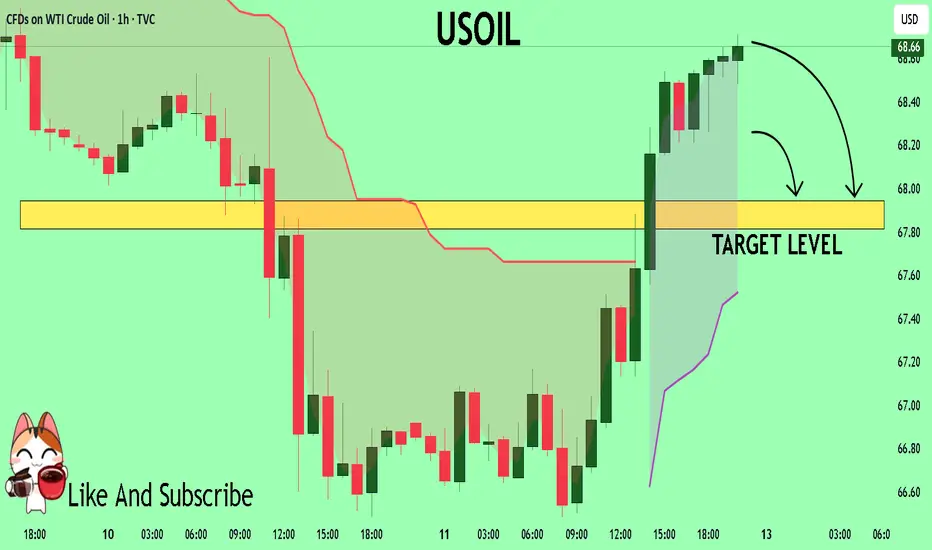
(2-hour timeframe for WTI Crude Oil (USOIL).(2-hour timeframe for WTI Crude Oil (USOIL)), here’s the technical analysis and target zones:
🟦 Key Observations:
Price is trading in an ascending channel.
I'm using the Ichimoku Cloud for trend confirmation.
There are two clear target zones marked with arrows.
---
🎯 Target Levels (as shown on chart):
1. First Target Zone: ~$74.50
This is the intermediate resistance level.
Price is expected to break above ~$69, then head toward this zone.
2. Final Target Zone: ~$76.50–77.00
This is the major resistance area, possibly the upper end of a swing move.
Could be reached if momentum remains strong and no major reversal occurs.
---
📌 Current Price:
$68.66 (Sell) / $68.76 (Buy) — as of the screenshot.
📈 Suggested Strategy (based on the chart setup):
Entry: On breakout above ~$69.00 with volume confirmation.
First TP: ~$74.50
Second TP: ~$76.50–77.00
Stop-Loss: Below the lower channel support (~$66 or tighter, depending on your risk tolerance).
WTI USOIL WTI oil ,watch oil inventory and opec data report for clear directional bias . if the monthly candle closes above the supply roof,it will be a long confirmation if demand holds .the probability of rejection is high, because the current candle is coming as a retest candle to broken demand floor that served as bench mark oil price level 65$-68$ zone for long time .
#oil #opec #usoil #wti

WTI US OIL US Oil (WTI Crude) Price Context
Price: WTI crude oil futures settled at approximately $68.66 per barrel close of friday.
Prices rebounded after a prior decline, supported by strong summer travel demand, high refinery utilization, and supply management efforts by major producers like Russia and Saudi Arabia.
Outlook: Despite near-term supply tightness, the International Energy Agency (IEA) and OPEC forecast a potential surplus later in 2025 and slower demand growth through 2026–2029, especially due to slower Chinese economic growth.
The DXY measures the USD strength against a basket of major currencies and often moves inversely to commodities priced in USD like oil.
When the DXY strengthens, oil prices can face downward pressure due to higher USD value making oil more expensive in other currencies.
Conversely, a weaker DXY tends to support higher oil prices.
Current Dynamics:
If geopolitical risks or supply constraints push oil prices up, the USD may weaken as markets price in inflationary pressures.
Conversely, if the USD strengthens due to safe-haven demand or monetary policy, oil prices may soften.
#usoil

USOIL: Local Bearish Bias! Short!
My dear friends,
Today we will analyse USOIL together☺️
The market is at an inflection zone and price has now reached an area around 68.669 where previous reversals or breakouts have occurred.And a price reaction that we are seeing on multiple timeframes here could signal the next move down so we can enter on confirmation, and target the next key level of 67.925..Stop-loss is recommended beyond the inflection zone.
❤️Sending you lots of Love and Hugs❤️

USOIL Will Collapse! SELL!
My dear subscribers,
USOIL looks like it will make a good move, and here are the details:
The market is trading on 68.66 pivot level.
Bias - Bearish
Technical Indicators: Both Super Trend & Pivot HL indicate a highly probable Bearish continuation.
Target - 67.95
About Used Indicators:
The average true range (ATR) plays an important role in 'Supertrend' as the indicator uses ATR to calculate its value. The ATR indicator signals the degree of price volatility.
Disclosure: I am part of Trade Nation's Influencer program and receive a monthly fee for using their TradingView charts in my analysis.
———————————
WISH YOU ALL LUCK
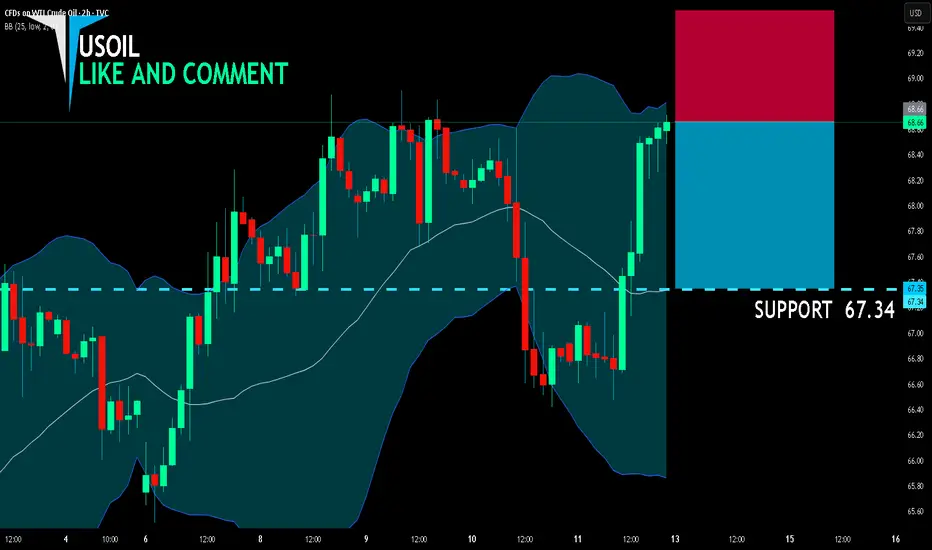
USOIL SENDS CLEAR BEARISH SIGNALS|SHORT
USOIL SIGNAL
Trade Direction: short
Entry Level: 68.66
Target Level: 67.34
Stop Loss: 69.53
RISK PROFILE
Risk level: medium
Suggested risk: 1%
Timeframe: 2h
Disclosure: I am part of Trade Nation's Influencer program and receive a monthly fee for using their TradingView charts in my analysis.
✅LIKE AND COMMENT MY IDEAS✅
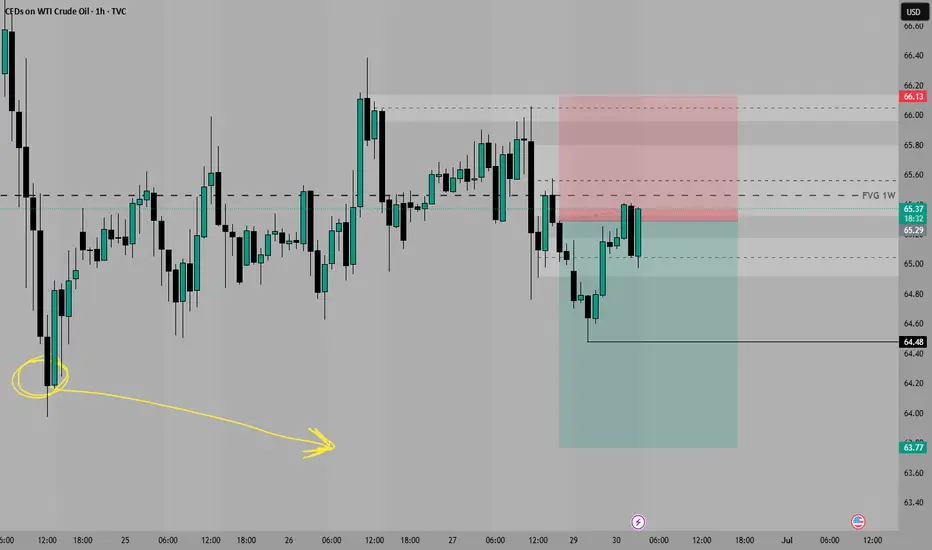
OIL IDEA /30 06 25So we are looking for this Short position, but first we need a better Premium position
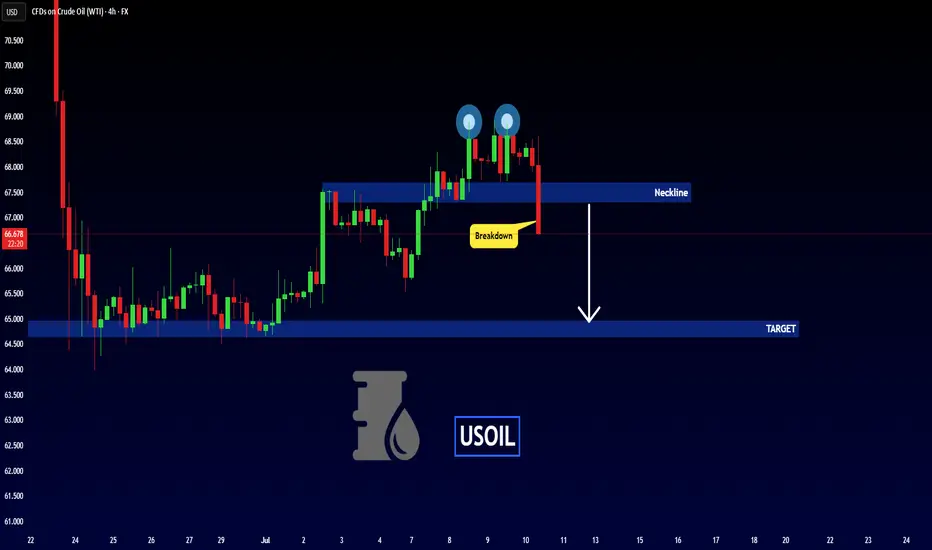
USOIL - Bearish Double TOPHello Traders !
The USOIL failed to create a new higher high.
The price formed a double top pattern.
Currently, The neckline is broken !
So, I expect a bearish move📉
________________
TARGET: 64.970🎯
USOIL long WTI crude oil is approaching strong support around $71, with oversold technicals and stabilizing demand outlook. Geopolitical tensions in the Middle East and potential U.S.–Iran friction may limit downside. A long position targets a rebound from this key level.
Elliot...

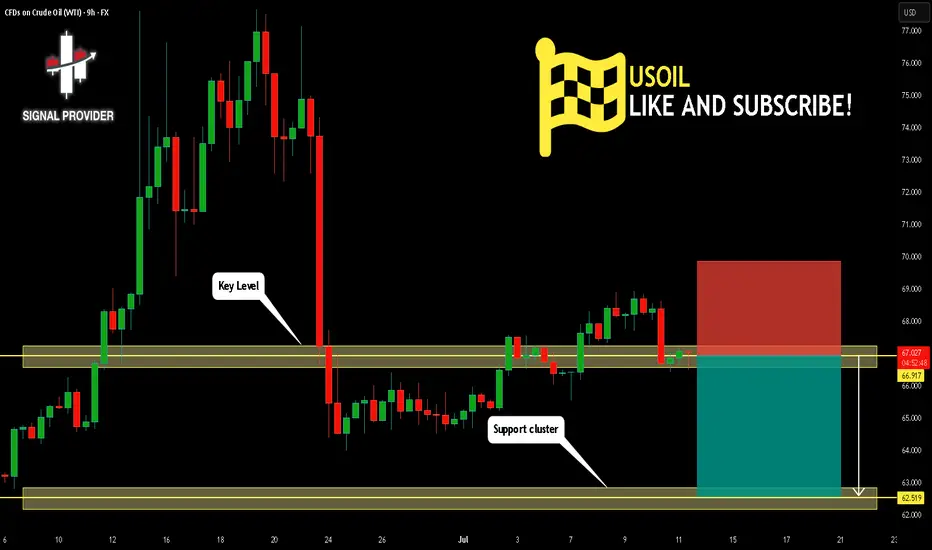
USOIL Will Go Lower! Short!
Please, check our technical outlook for USOIL.
Time Frame: 9h
Current Trend: Bearish
Sentiment: Overbought (based on 7-period RSI)
Forecast: Bearish
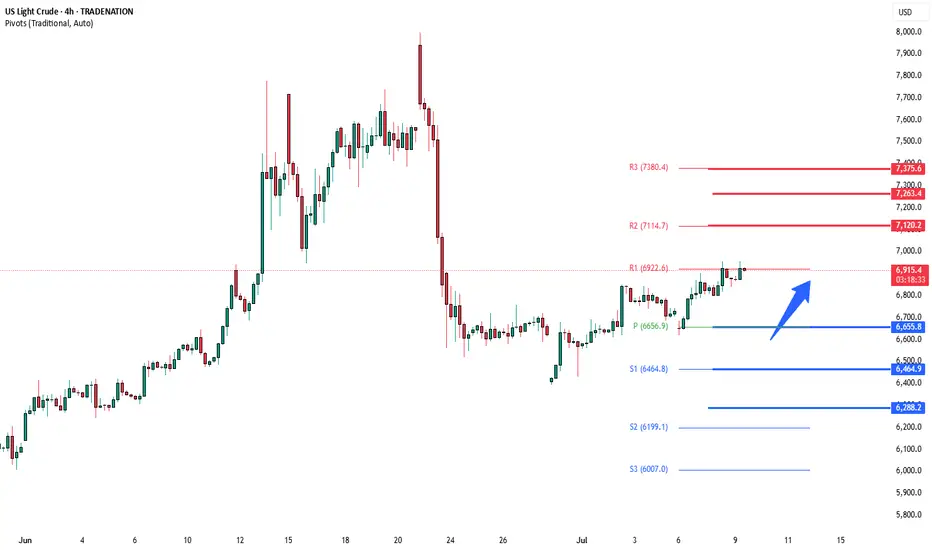
The price is testing a key resistance 66.917.
Taking into consideration the current market trend & overbought RSI, chances will be high to see a bearish movement to the downside at least to 62.519 level.
P.S
Please, note that an oversold/overbought condition can last for a long time, and therefore being oversold/overbought doesn't mean a price rally will come soon, or at all.
Disclosure: I am part of Trade Nation's Influencer program and receive a monthly fee for using their TradingView charts in my analysis.
Like and subscribe and comment my ideas if you enjoy them!
Does someone knows something that we don't?It seems to me we are getting in an accumulation phase on oil. Is there another war rally on the horizon or something else!? They can manipulate price but they can't manipulate volume that easily. Notice that every time price rises, volume rises with it and when price falls, volume decreases with it. My bet would be buying bellow the last lows, where a sea of stop loss rests, before ripping up the page.

TRADING IDEA - US CRUDE OIL - BEARISH FLAG, CONCERNS ON GLOBAL EFOREXCOM:USOIL
The US Crude Oil prices went down yesterday, mostly because of the tariffs and concerns on demand.
Here is what the Bloomberg is writing: " OPEC+ is discussing a pause in its oil production increases from October is fueling concerns about a slowdown in global energy demand. In addition, the intensification of US tariffs risks slowing global economic growth and energy demand after President Trump ramped up tariffs on numerous countries this week, including a 50% tariff on Brazil."
So, despite the pause in oil production increase, which is supposed to be bullish factor the oil prices, we may see the slowdown in global economy and supposedly a recession because of Trump's tariffs. This is a long-term bearish factor for the oil. I think that we will see another bearish impulse here, according to what we observe on the chart.
There is a nice bearish flag and i am planning to short it with a target nearby 6,540.00 support level.
🔽 a pending sell stop order at 6615.3 with
❌a stop loss at 6680.9 and
🤑a take profit at 6544.0
Trade cautiously! Preserve your deposits!

Bullish bounce>WTI Oil (XTI/USD) is falling towards the pivot which acts as a pullback support and could bounce to the 1st resistance.
Pivot: 65.65
1st Support: 63.74
1st Resistance: 68.24
Risk Warning:
Trading Forex and CFDs carries a high level of risk to your capital and you should only trade with money you can afford to lose. Trading Forex and CFDs may not be suitable for all investors, so please ensure that you fully understand the risks involved and seek independent advice if necessary.
Disclaimer:
The above opinions given constitute general market commentary, and do not constitute the opinion or advice of IC Markets or any form of personal or investment advice.
Any opinions, news, research, analyses, prices, other information, or links to third-party sites contained on this website are provided on an "as-is" basis, are intended only to be informative, is not an advice nor a recommendation, nor research, or a record of our trading prices, or an offer of, or solicitation for a transaction in any financial instrument and thus should not be treated as such. The information provided does not involve any specific investment objectives, financial situation and needs of any specific person who may receive it. Please be aware, that past performance is not a reliable indicator of future performance and/or results. Past Performance or Forward-looking scenarios based upon the reasonable beliefs of the third-party provider are not a guarantee of future performance. Actual results may differ materially from those anticipated in forward-looking or past performance statements. IC Markets makes no representation or warranty and assumes no liability as to the accuracy or completeness of the information provided, nor any loss arising from any investment based on a recommendation, forecast or any information supplied by any third-party.

Crude oil under pressure after OPEC+WTI Crude oil had rejected the 20-moving average area, having reversed off the $68 price area after the OPEC+ announcement about the upcoming production increase. The short-term energy outlook forecast from eia.org had lowered the expected fair price for CL futures based on supply and demand estimation for 2025 - the average price is projected around $60 with a possibility to drive lower.
COT reports show the increasing short position for commercial traders, which had almost reached the new bottom - a potential short signal for the oil.
Given the weak sentiment (we’ve seen the massive drop of oil futures after the resolution of Israel-Iran situation) and overall downtrend, we can project the downside move as shown at the chart.
Don't forget - this is just the idea, always do your own reserch and never forget to manage your risk!

US OIL LONG POSITION After the very strong dump in Oil from the major resistance Trendline and zone, but also held and showed signs of rejection from the DTF Support.
I decided to open a Long Position and it's still running, so we'll see how long it can run.
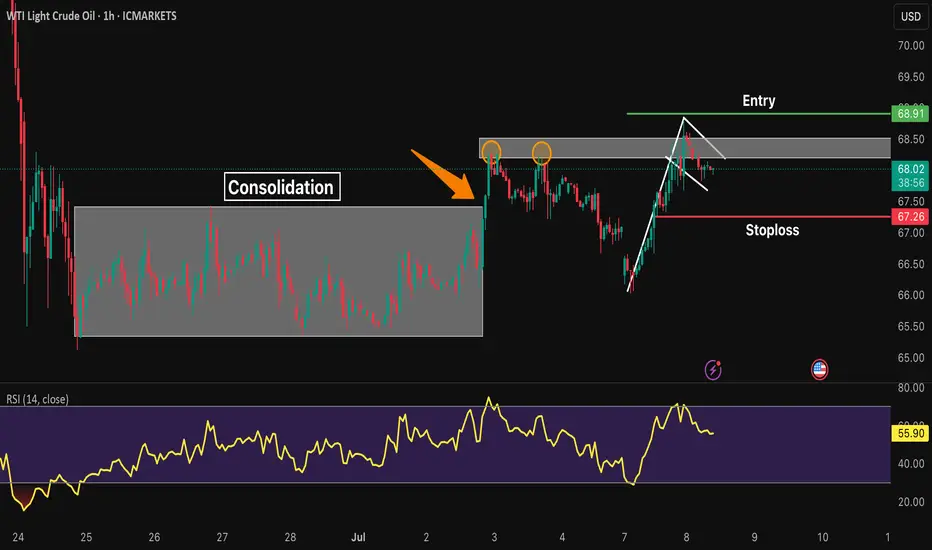
XTIUSD* Bullish Trend after consolidation box break.
* Bullish flag pattern is formed.
* Entry will be taken at the break of the pole.
* Stoploss is below the last HL.
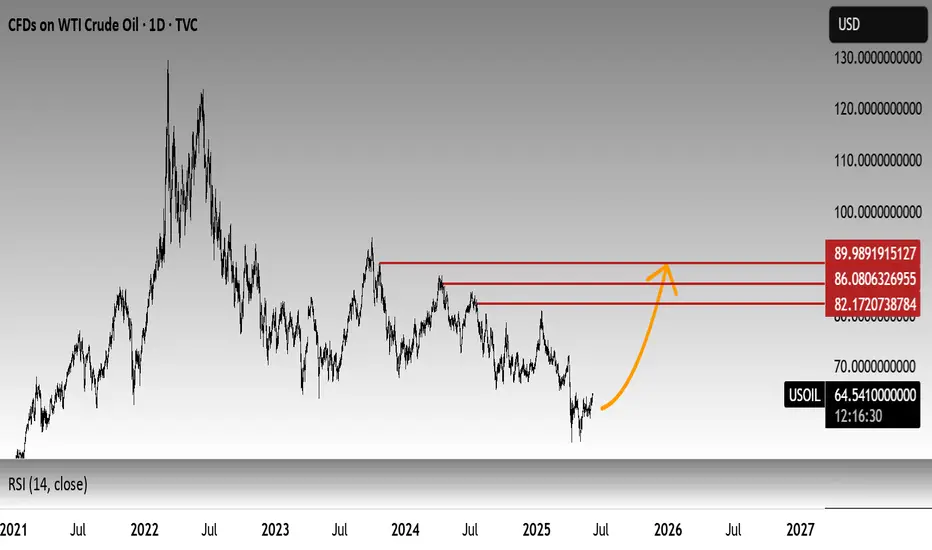
USOIL🛢️ USOIL (WTI Crude Oil) – Technical Outlook & Forecast
Current Price: $64.55
Bias: Bullish Only
Forecast Levels: $82.00 → $85.00 → $90.00+
🔍 Market Overview:
Crude oil (USOIL) is currently trading around $64.55, showing early signs of a potential bullish reversal from multi-month lows. Despite recent volatility and macroeconomic uncertainties, the technical structure indicates the formation of a solid accumulation base, potentially preparing for a significant upward move.
📈 Technical Perspective:
Price Action: Oil is attempting to reclaim key support zones that have held historically during large-scale recoveries.
Momentum: Oscillators (like RSI/MACD) may be turning up from oversold territory (subject to chart confirmation), further supporting the bullish scenario.
Volume Profile: Accumulation at lower levels hints at smart money interest around the $60–$65 zone.
🎯 Bullish Targets:
$82.00 – Psychological and technical resistance
$85.00 – Previous swing high / Fib extension zone
$90.00+ – Medium-term projection if momentum sustains
🧭 Conclusion:
The bias for USOIL remains bullish only while the $60–$62 zone holds firm as support. Breakout above near-term resistances could open the way for a strong move toward $82, $85, and even $90+. Keep an eye on macro events and inventory data for short-term volatility.
🟢 Trade Setup Idea (For Reference Only):
Long bias above $64–$65 support zone, targeting $82–$90 over the coming weeks/months. Use proper risk management.
Usoil buy trade am holding since last week📈 USOIL Trade Update – Long Position Holding Strong Since Last Week 🔥
Guess I didn't post this last week...
Caught this buy from the demand zone around $64.16, with a clean structure shift and bullish momentum confirmation.
The market is respecting structure with higher highs and higher lows forming beautifully. As price approaches my target zone, I’m locking in profits and managing risk. Trade has been running smoothly for days 💪🏽
SL at break even now, Holding patiently for that final push to the $70+ area. Let's see how the market reacts at that key zone.
WTI Crude Oil volatility spikeWTI prices ticked higher as renewed Houthi attacks in the Red Sea raised supply and shipping risk concerns.
A drone and speedboat strike on a Greek-operated vessel killed four crew members, marking the second attack in a day and signaling a fresh escalation after a temporary Middle East truce.
The Red Sea remains a critical route for crude flows, and heightened tensions could support oil prices due to potential disruptions.
However, US inventory data is a key counterweight:
The API reported a surprise 7.1 million barrel build in crude stockpiles last week (vs. expected 2.8M draw).
This adds to an 11 million barrel increase in inventories year-to-date, which could limit upside momentum in WTI.
Traders now await the official EIA report later today, which could confirm or challenge API’s bearish signal.
Trading Implications:
Geopolitical premium is re-entering the market—bullish for WTI in the short term.
Inventory build limits gains—if confirmed by EIA, could lead to price pullbacks.
Key levels and positioning will hinge on EIA stock data and any further escalation in shipping threats.
Bias:
Short-term: Bullish with upside risk from Red Sea conflict
Medium-term: Capped by high U.S. stock levels unless demand outlook improves
Key Support and Resistance Levels
Resistance Level 1: 7120
Resistance Level 2: 7260
Resistance Level 3: 7375
Support Level 1: 6650
Support Level 2: 6460
Support Level 3: 6290
This communication is for informational purposes only and should not be viewed as any form of recommendation as to a particular course of action or as investment advice. It is not intended as an offer or solicitation for the purchase or sale of any financial instrument or as an official confirmation of any transaction. Opinions, estimates and assumptions expressed herein are made as of the date of this communication and are subject to change without notice. This communication has been prepared based upon information, including market prices, data and other information, believed to be reliable; however, Trade Nation does not warrant its completeness or accuracy. All market prices and market data contained in or attached to this communication are indicative and subject to change without notice.