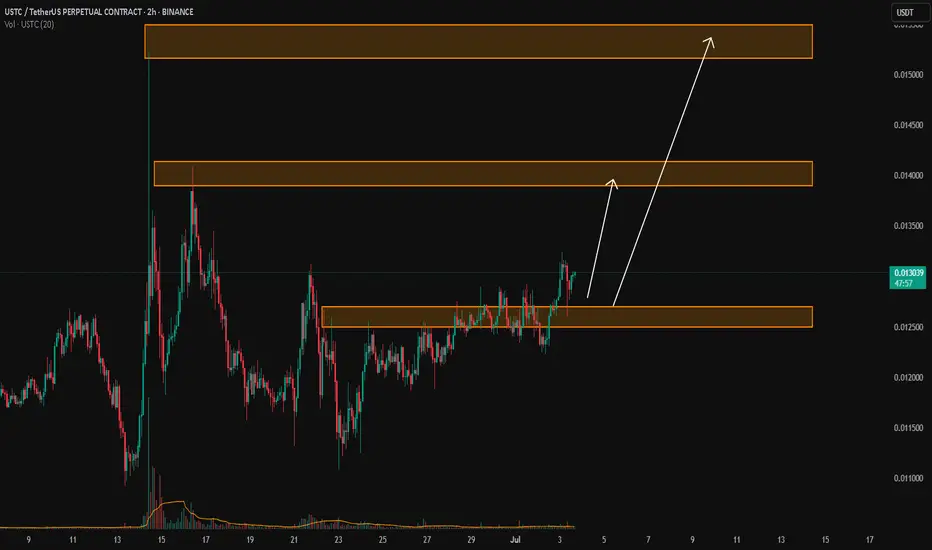
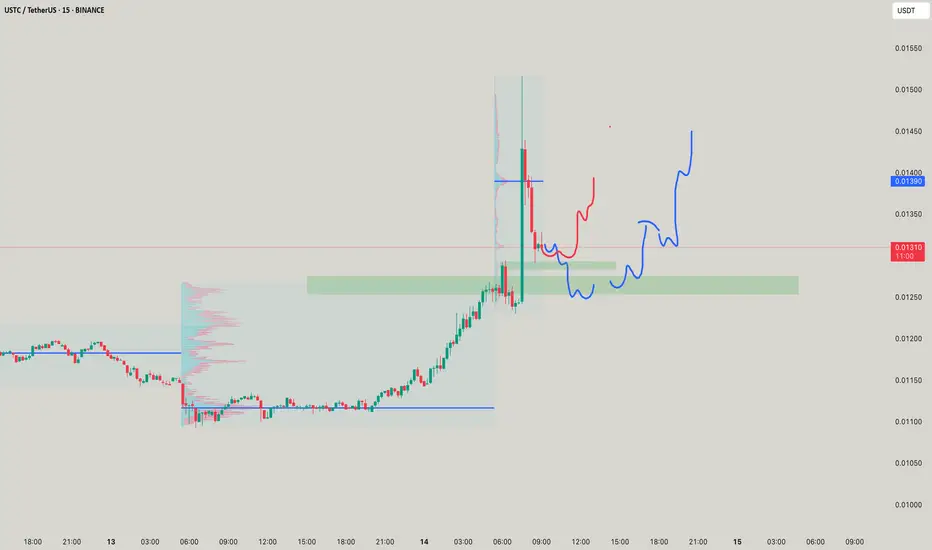
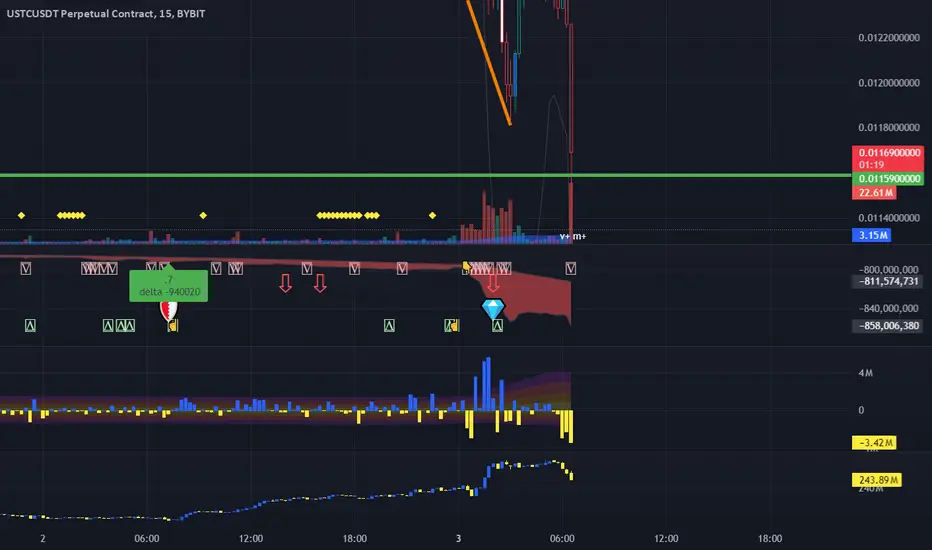
USTC/USDTKey Level Zone: 0.012500 - 0.012700
LMT v2.0 detected.
The setup looks promising—price previously trended upward with rising volume and momentum, then retested this zone cleanly. This presents an excellent reward-to-risk opportunity if momentum continues to align.
Introducing LMT (Levels & Momentum Trading)
- Over the past 3 years, I’ve refined my approach to focus more sharply on the single most important element in any trade: the KEY LEVEL.
- While HMT (High Momentum Trading) served me well—combining trend, momentum, volume, and structure across multiple timeframes—I realized that consistently identifying and respecting these critical price zones is what truly separates good trades from great ones.
- That insight led to the evolution of HMT into LMT – Levels & Momentum Trading.
Why the Change? (From HMT to LMT)
Switching from High Momentum Trading (HMT) to Levels & Momentum Trading (LMT) improves precision, risk control, and confidence by:
- Clearer Entries & Stops: Defined key levels make it easier to plan entries, stop-losses, and position sizing—no more guesswork.
- Better Signal Quality: Momentum is now always checked against a support or resistance zone—if it aligns, it's a stronger setup.
- Improved Reward-to-Risk: All trades are anchored to key levels, making it easier to calculate and manage risk effectively.
- Stronger Confidence: With clear invalidation points beyond key levels, it's easier to trust the plan and stay disciplined—even in tough markets.
Whenever I share a signal, it’s because:
- A high‐probability key level has been identified on a higher timeframe.
- Lower‐timeframe momentum, market structure and volume suggest continuation or reversal is imminent.
- The reward‐to‐risk (based on that key level) meets my criteria for a disciplined entry.
***Please note that conducting a comprehensive analysis on a single timeframe chart can be quite challenging and sometimes confusing. I appreciate your understanding of the effort involved.
Important Note: The Role of Key Levels
- Holding a key level zone: If price respects the key level zone, momentum often carries the trend in the expected direction. That’s when we look to enter, with stop-loss placed just beyond the zone with some buffer.
- Breaking a key level zone: A definitive break signals a potential stop‐out for trend traders. For reversal traders, it’s a cue to consider switching direction—price often retests broken zones as new support or resistance.
My Trading Rules (Unchanged)
Risk Management
- Maximum risk per trade: 2.5%
- Leverage: 5x
Exit Strategy / Profit Taking
- Sell at least 70% on the 3rd wave up (LTF Wave 5).
- Typically sell 50% during a high‐volume spike.
- Move stop‐loss to breakeven once the trade achieves a 1.5:1 R:R.
- Exit at breakeven if momentum fades or divergence appears.
The market is highly dynamic and constantly changing. LMT signals and target profit (TP) levels are based on the current price and movement, but market conditions can shift instantly, so it is crucial to remain adaptable and follow the market's movement.
If you find this signal/analysis meaningful, kindly like and share it.
Thank you for your support~
Sharing this with love!
From HMT to LMT: A Brief Version History
HM Signal :
Date: 17/08/2023
- Early concept identifying high momentum pullbacks within strong uptrends
- Triggered after a prior wave up with rising volume and momentum
- Focused on healthy retracements into support for optimal reward-to-risk setups
HMT v1.0:
Date: 18/10/2024
- Initial release of the High Momentum Trading framework
- Combined multi-timeframe trend, volume, and momentum analysis.
- Focused on identifying strong trending moves high momentum
HMT v2.0:
Date: 17/12/2024
- Major update to the Momentum indicator
- Reduced false signals from inaccurate momentum detection
- New screener with improved accuracy and fewer signals
HMT v3.0:
Date: 23/12/2024
- Added liquidity factor to enhance trend continuation
- Improved potential for momentum-based plays
- Increased winning probability by reducing entries during peaks
HMT v3.1:
Date: 31/12/2024
- Enhanced entry confirmation for improved reward-to-risk ratios
HMT v4.0:
Date: 05/01/2025
- Incorporated buying and selling pressure in lower timeframes to enhance the probability of trending moves while optimizing entry timing and scaling
HMT v4.1:
Date: 06/01/2025
- Enhanced take-profit (TP) target by incorporating market structure analysis
HMT v5 :
Date: 23/01/2025
- Refined wave analysis for trending conditions
- Incorporated lower timeframe (LTF) momentum to strengthen trend reliability
- Re-aligned and re-balanced entry conditions for improved accuracy
HMT v6 :
Date : 15/02/2025
- Integrated strong accumulation activity into in-depth wave analysis
HMT v7 :
Date : 20/03/2025
- Refined wave analysis along with accumulation and market sentiment
HMT v8 :
Date : 16/04/2025
- Fully restructured strategy logic
HMT v8.1 :
Date : 18/04/2025
- Refined Take Profit (TP) logic to be more conservative for improved win consistency
LMT v1.0 :
Date : 06/06/2025
- Rebranded to emphasize key levels + momentum as the core framework
LMT v2.0
Date: 11/06/2025
USTUSDT trade ideas
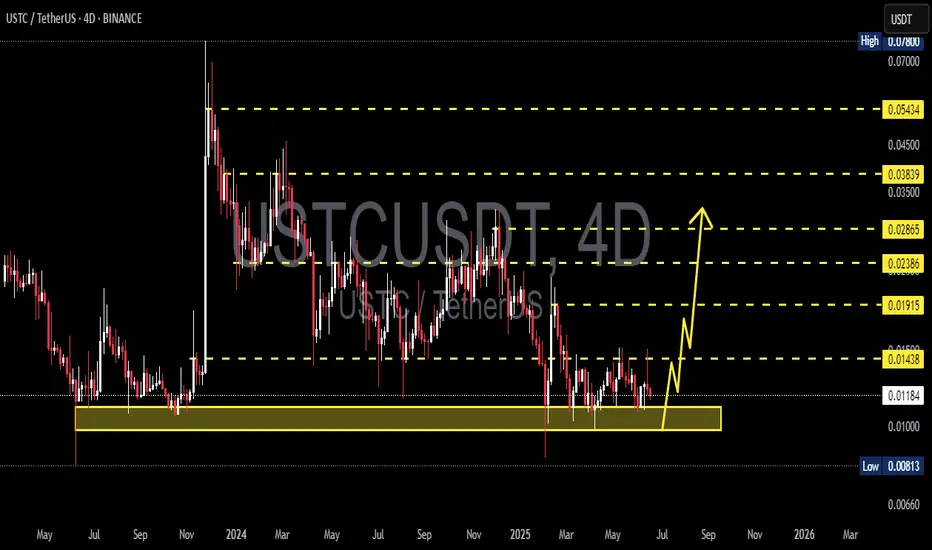
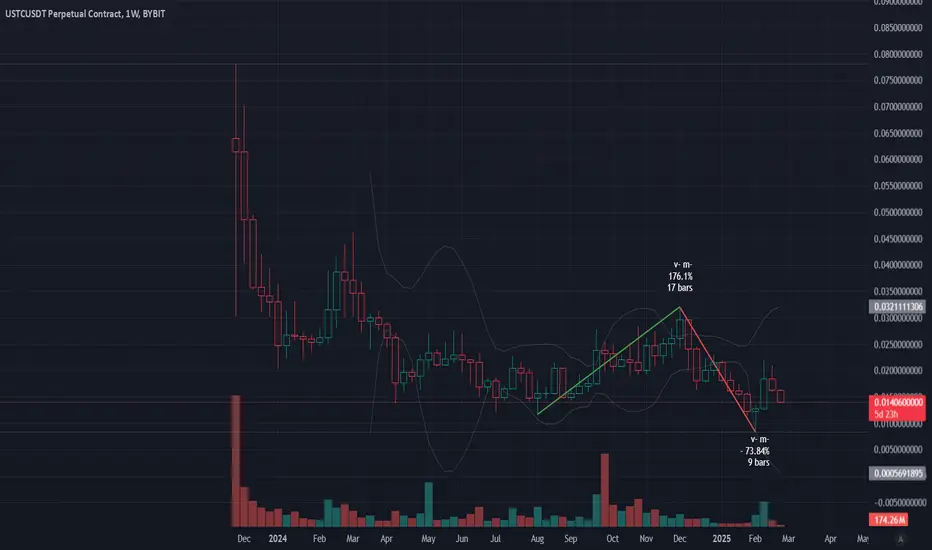
USTCUSDT 4D AnalysisUSTC ~ 4D Analysis
#USTC This trade is very high risk. Buy if you still have confidence in this coin. With a short term target of at least 15%++
USTCUSDT Forming Bullish WaveUSTCUSDT is currently displaying a bullish wave pattern, indicating the formation of a higher low structure that typically leads to strong continuation moves. This pattern, combined with increasing volume, suggests growing investor interest and the potential for a significant upside move. Technically, the pair looks well-positioned to achieve a breakout, with projected gains estimated between 40% to 50%+, making this a highly attractive opportunity for both short-term traders and long-term investors.
The current wave formation reflects healthy market behavior, with each pullback being met by strong buying pressure — a clear sign of accumulation. As momentum builds, USTCUSDT could target higher resistance levels quickly, particularly if broader market sentiment remains favorable. Traders watching this pair should pay close attention to volume spikes and confirmation candles, which will signal the start of a possible breakout move.
On a fundamental level, renewed activity surrounding algorithmic stablecoin narratives and the legacy of Terra projects has brought USTC back into the spotlight. While still a controversial asset for some, speculative interest has been surging, especially from traders seeking high-volatility setups. This resurgence in trading activity has helped lift volume and build technical structures with bullish potential.
If USTCUSDT maintains its current trajectory and continues to respect the bullish wave formation, we could see a rapid price acceleration. The blend of technical momentum, increasing trading volume, and market speculation presents a prime setup for explosive gains in the coming sessions.
✅ Show your support by hitting the like button and
✅ Leaving a comment below! (What is You opinion about this Coin)
Your feedback and engagement keep me inspired to share more insightful market analysis with you!
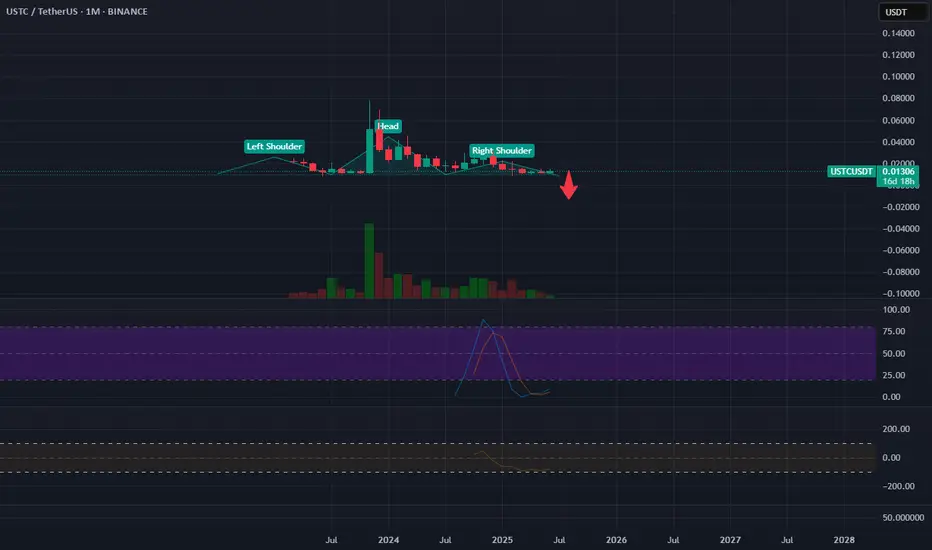
It is shoulder-head-shoulder formation.SHORT USTC ! ALL IS TRABLook at the big pictures. IT IS BIG trab. MAKE YOUR OWN RESARCH. IT IS ONLY EDUCATIONAL WORK.
Is USTC going to just die again?The moves of USTC really moved in a swift motion, however I would like to say in this manner where as shown and is shown in red as given
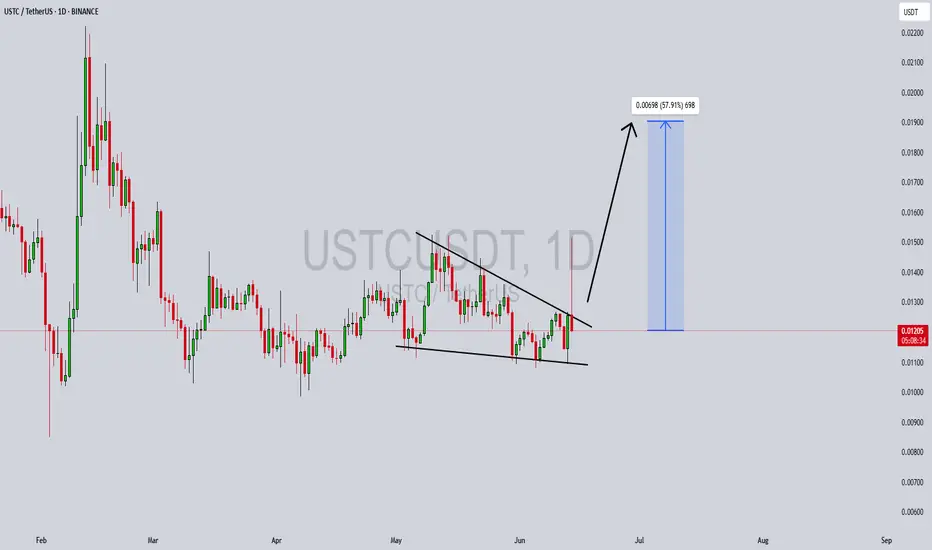
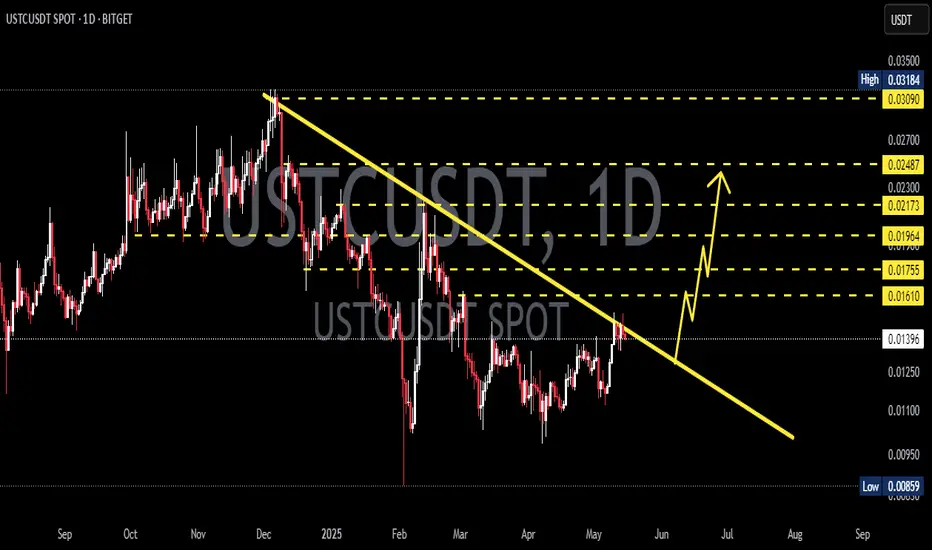
USTCUSDT 1D Analysis USTC ~ 1D Analysis
#USTC Buy after successfully breaking through this resistance line with a short-term target of at least 15%++ from here.
USTCUSDT 4D Analysis USTC ~ 4D Analysis
#USTC This trade is very high risk
Buy gradually if you still have confidence in this coin with a short term target of at least 10%+.

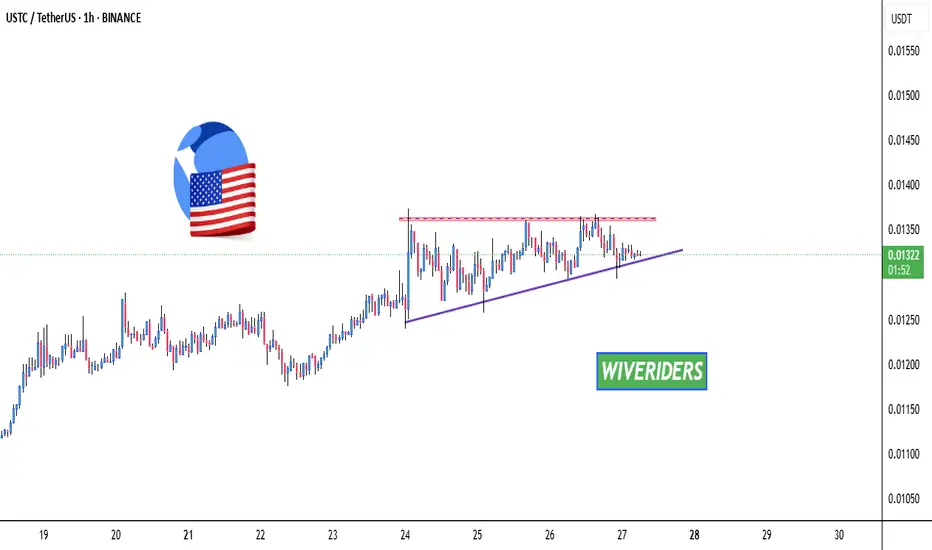
$USTC Forming Ascending Triangle🚨 OTC:USTC Forming Ascending Triangle 🚨
OTC:USTC is forming an ascending triangle pattern and is approaching a key red resistance zone. A breakout above this level could signal a strong bullish move.
📈 Technical Overview:
Pattern: Ascending Triangle
Resistance Zone: Red area currently being tested.
LONG USTC News about TerraLoss claims
prevois day were small pump , and this day , that could be just gathering stop lossess to go higher
REPEG ? Imagine that some of the stablecoin going to be swing .... you should know the coin which have had at least more stable than other.
That price 0,15 is good level for last 2 years time and show activity
CVD are not decreasing much , just nobody buy while snow ball falling, that is reason for hitting out weakhands. It can't fall because no one sell it in a big quantities , that price it's not about real estimation.
CZ says that FTX been involved in crash of Luna and DO Kwon going to reveal someting in USA court soon , he's been extradited already under USA controll . It's good way for appearing a another owners of Terra ecosystem.
One of the whales that is Binance, which better repeg them than just lost this asset And for over 2 years they are not showing signs of selling that
so what i want to say , in era of shitcoins , it looks not as bad as some other and especially by that price
it could be not repeg , but at least rise to 0,03
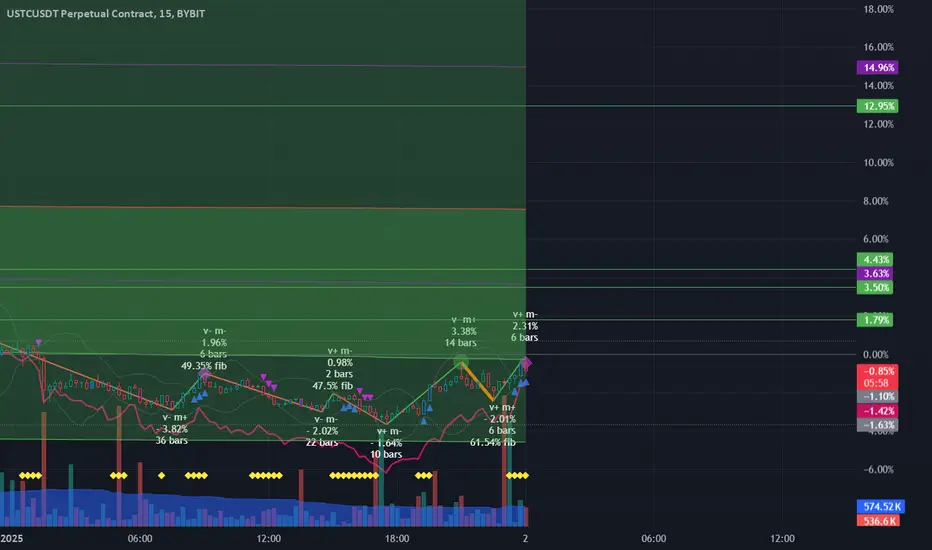
USTC/USDTKey Level Zone: 0.019000 - 0.019500
HMT v5 detected. The setup looks promising, supported by a previous upward/downward trend with increasing volume and momentum, presenting an excellent reward-to-risk opportunity.
HMT (High Momentum Trending):
HMT is based on trend, momentum, volume, and market structure across multiple timeframes. It highlights setups with strong potential for upward movement and higher rewards.
Whenever I spot a signal for my own trading, I’ll share it. Please note that conducting a comprehensive analysis on a single timeframe chart can be quite challenging and sometimes confusing. I appreciate your understanding of the effort involved.
Important Note :
Role of Key Levels:
- These zones are critical for analyzing price trends. If the key level zone holds, the price may continue trending in the expected direction. However, momentum may increase or decrease based on subsequent patterns.
- Breakouts: If the key level zone breaks, it signals a stop-out. For reversal traders, this presents an opportunity to consider switching direction, as the price often retests these zones, which may act as strong support-turned-resistance (or vice versa).
My Trading Rules
Risk Management
- Maximum risk per trade: 2.5%.
- Leverage: 5x.
Exit Strategy
Profit-Taking:
- Sell at least 70% on the 3rd wave up (LTF Wave 5).
- Typically, sell 50% during a high-volume spike.
- Adjust stop-loss to breakeven once the trade achieves a 1.5:1 reward-to-risk ratio.
- If the market shows signs of losing momentum or divergence, ill will exit at breakeven.
The market is highly dynamic and constantly changing. HMT signals and target profit (TP) levels are based on the current price and movement, but market conditions can shift instantly, so it is crucial to remain adaptable and follow the market's movement.
If you find this signal/analysis meaningful, kindly like and share it.
Thank you for your support~
Sharing this with love!
HMT v2.0:
- Major update to the Momentum indicator
- Reduced false signals from inaccurate momentum detection
- New screener with improved accuracy and fewer signals
HMT v3.0:
- Added liquidity factor to enhance trend continuation
- Improved potential for momentum-based plays
- Increased winning probability by reducing entries during peaks
HMT v3.1:
- Enhanced entry confirmation for improved reward-to-risk ratios
HMT v4.0:
- Incorporated buying and selling pressure in lower timeframes to enhance the probability of trending moves while optimizing entry timing and scaling
HMT v4.1:
- Enhanced take-profit (TP) target by incorporating market structure analysis
HMT v5 :
Date: 23/01/2025
- Refined wave analysis for trending conditions
- Incorporated lower timeframe (LTF) momentum to strengthen trend reliability
- Re-aligned and re-balanced entry conditions for improved accuracy

USTC/USDTKey Level Zone: 0.017160 - 0.017440
HMT v5 detected. The setup looks promising, supported by a previous upward/downward trend with increasing volume and momentum, presenting an excellent reward-to-risk opportunity.
HMT (High Momentum Trending):
HMT is based on trend, momentum, volume, and market structure across multiple timeframes. It highlights setups with strong potential for upward movement and higher rewards.
Whenever I spot a signal for my own trading, I’ll share it. Please note that conducting a comprehensive analysis on a single timeframe chart can be quite challenging and sometimes confusing. I appreciate your understanding of the effort involved.
Important Note :
Role of Key Levels:
- These zones are critical for analyzing price trends. If the key level zone holds, the price may continue trending in the expected direction. However, momentum may increase or decrease based on subsequent patterns.
- Breakouts: If the key level zone breaks, it signals a stop-out. For reversal traders, this presents an opportunity to consider switching direction, as the price often retests these zones, which may act as strong support-turned-resistance (or vice versa).
My Trading Rules
Risk Management
- Maximum risk per trade: 2.5%.
- Leverage: 5x.
Exit Strategy
Profit-Taking:
- Sell at least 70% on the 3rd wave up (LTF Wave 5).
- Typically, sell 50% during a high-volume spike.
- Adjust stop-loss to breakeven once the trade achieves a 1.5:1 reward-to-risk ratio.
- If the market shows signs of losing momentum or divergence, ill will exit at breakeven.
The market is highly dynamic and constantly changing. HMT signals and target profit (TP) levels are based on the current price and movement, but market conditions can shift instantly, so it is crucial to remain adaptable and follow the market's movement.
If you find this signal/analysis meaningful, kindly like and share it.
Thank you for your support~
Sharing this with love!
HMT v2.0:
- Major update to the Momentum indicator
- Reduced false signals from inaccurate momentum detection
- New screener with improved accuracy and fewer signals
HMT v3.0:
- Added liquidity factor to enhance trend continuation
- Improved potential for momentum-based plays
- Increased winning probability by reducing entries during peaks
HMT v3.1:
- Enhanced entry confirmation for improved reward-to-risk ratios
HMT v4.0:
- Incorporated buying and selling pressure in lower timeframes to enhance the probability of trending moves while optimizing entry timing and scaling
HMT v4.1:
- Enhanced take-profit (TP) target by incorporating market structure analysis
HMT v5 :
Date: 23/01/2025
- Refined wave analysis for trending conditions
- Incorporated lower timeframe (LTF) momentum to strengthen trend reliability
- Re-aligned and re-balanced entry conditions for improved accuracy

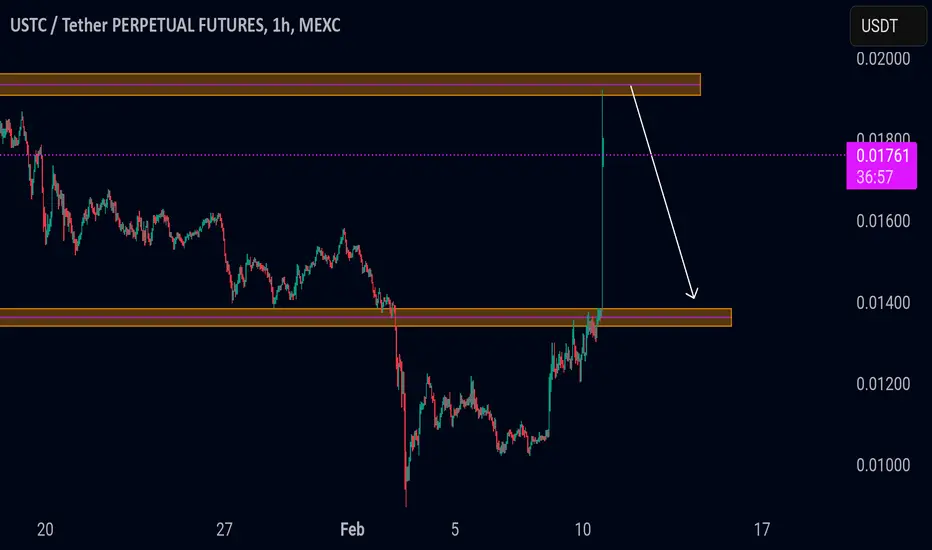
USTC trade planUSTC trade plan
USTC/USDT is not going to break this range resistance in one attempt. A 15-30% drop is coming.
key points
- strong resistance holding
- expecting a rejection and pullback
- risk is under your control, manage accordingly
- not financial advice, do your own research
trade wisely, stay disciplined
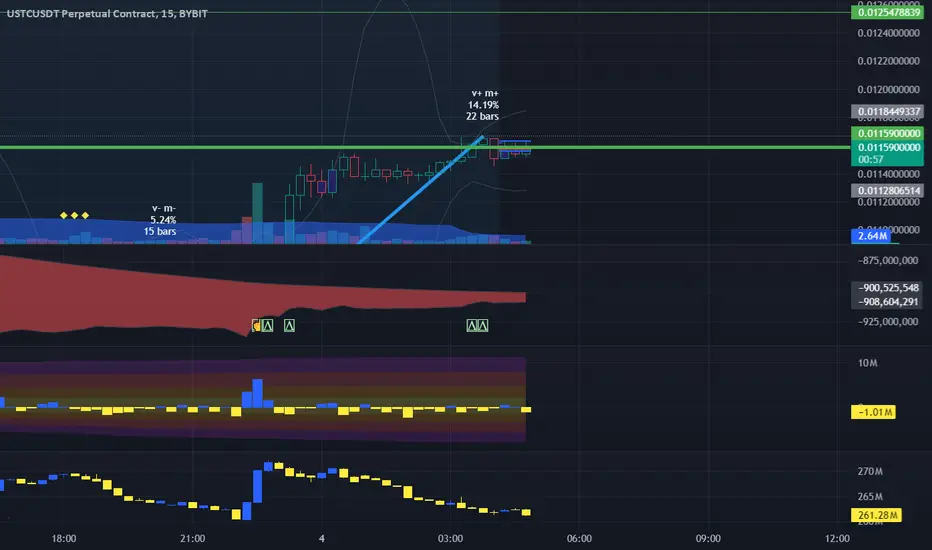
LONG USTC Bullish setup, - shorts are retreating and we so lot of times just go through a levels.
Havn't high volumes, that a strange , but probably some still believe in falling
we have serial of dodji on 1H TF, each one higher then previos , it show right befor big move
We going to take a hammer on a day ( still not ) but 4 hours remain , which going to mean high move to up too , about 0,0125
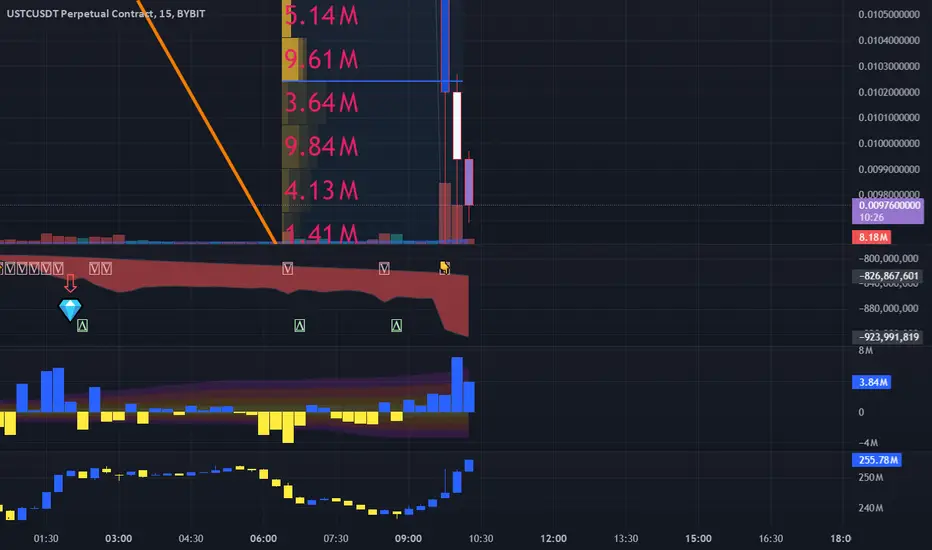
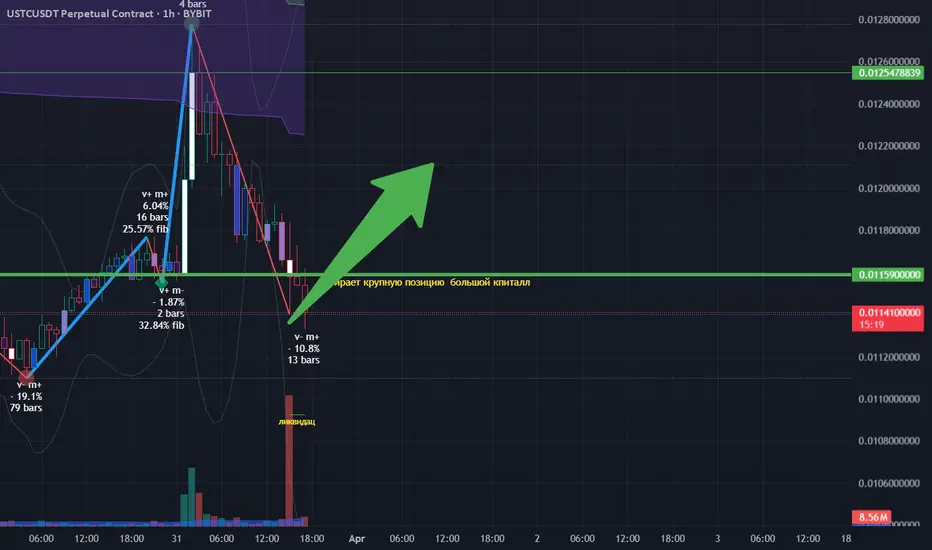
LONG USDT High volatility and low liquidity instrument :)
but some times due to this it rise so high .
OI already shows up .
It could burst it by this way
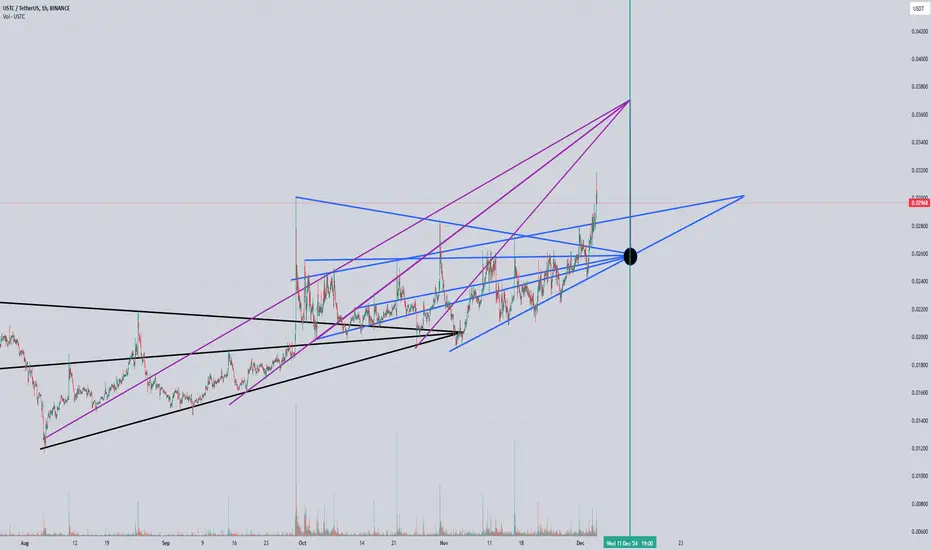
USTC - BLACKHOLL UPDATEA triangular system works perfectly on justs, you can also add a gann box there that intersects with the Dec 11-12 date, it will be a reversal zone, where to? Depends on where the price will be at that time, if down then strong growth, if there is a local high then the price will go down. This is a local situation, not thinking that it will somehow affect the trend globally. This can be useful to you for local trading as well as smart profit taking, my targets are strongly high as before
Translated with DeepL.com (free version)
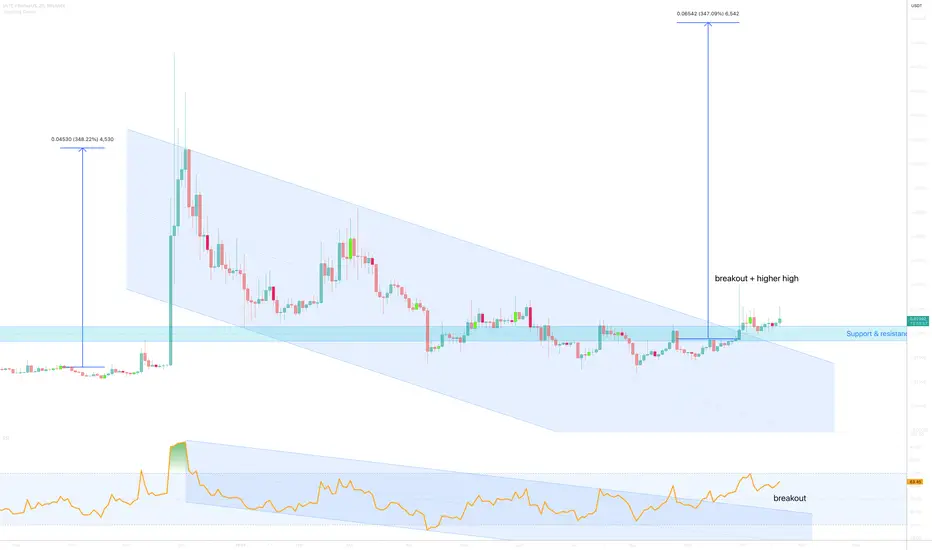
USTC/USDT Breakout & RetestUstc/usdt has confirmed its breakout and is currently retesting the breakout level. If this retest holds successfully, we could see a strong bullish move soon. Such retests often signal the continuation of a trend and present an opportunity to enter the market at a favorable level.
Key observations:
- The breakout above a major resistance level shows that buyers are in control.
- The pullback to the breakout zone is a healthy market action that validates the level.
- If the retest holds, it could attract more buyers, fueling a strong upward move.
Trading tips:
- Wait for a clear candle close above the retest zone on the 4H or daily chart to confirm support.
- Monitor trading volume, as a volume increase during the retest often confirms market strength.
- Use technical indicators like rsi or macd to ensure momentum aligns with the bullish scenario.
Risk management:
- Set a stop-loss slightly below the retest level to protect against invalidation.
- Adjust your position size to match your risk tolerance.
- Avoid rushing into the trade; allow the retest to play out fully to confirm its validity.
This analysis is for educational purposes only. Always conduct your own research and trade responsibly.

USTC BLACKHOLL - MEGA PUMPThe lines form arteries that run between the chart, crossing the reversal zones and connecting them from different zones and points into one whole. The pumping potential is huge. It is very likely that the pumping will start in December

Is TerraClassicUSD (USTC) about to moon?On the above 2 day chart price action has corrected over 80% since November 2023. A number of reasons now exist to be bullish. They include:
1) Price action and RSI resistance breakouts.
2) Trend reversal. higher highs higher lows replace lower highs lower lows.
3) Support on past resistance. Look left.
4) Everything that was said above (1 through 3) is also true for the USTC.BTC pair (see chart below). This level of confluence should not be ignored.
Is it possible price action continues correcting? Sure.
Is it probable? No
Ww
Type: trade
Risk: you decide
Timeframe for long: hours
Return: 300%
2 day USTC / BTC pair
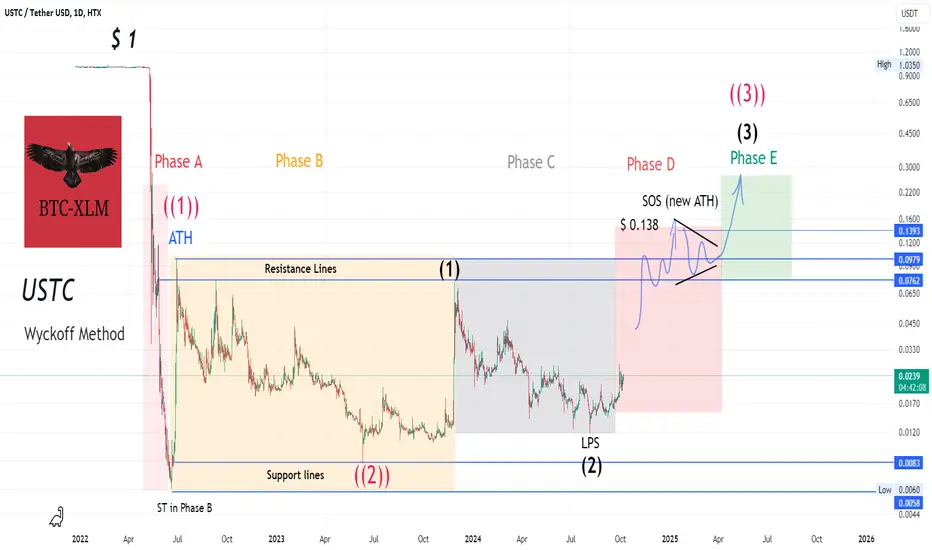
Revision 1 (Phase D- Sign Of Strength (SOS))
Graphical abstract:
consider this analogy
Technical Section:
USTC is completing the 3rd wave of the third leg of a 5-wave rally
Trade Plan:
Bias: Bullish (Wyckoff Method)
Trade entry = $ 0.023 - $ 0.025
Target-1 = $ 0.038
Target-2 = $ 0.07
Target-3 = $ 0.138 (New ATH)
Stop level: $ 0.015
That is what we are all striving for
Appendix:
USTC, Out of Slumber soon. Multiple X Surge Prospect!USTC recently suprised everyone when it suddenly woke up from its deep slumber from its 0.10 range to surge at 0.18 level. It corrected back to 0.13 range as we speak. The sudden spike conveys a buying volatility is already in order.
Expect another upside attempt from here on with possible significant breakout.
This one is very sensitive to pump at the current range.
Recent development conveys a permanent omission of minting of the coin to support its repeg.
Spotted at 0.013.
TAYOR.
