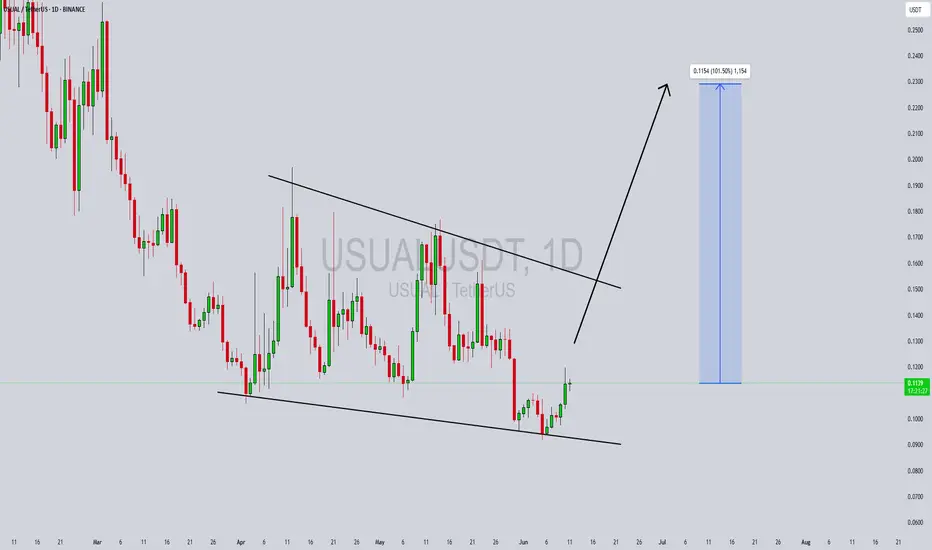
USUALUSDT Forming Falling WedgeUSUALUSDT is currently displaying a falling wedge pattern, a powerful bullish reversal signal in technical analysis. This formation typically precedes a breakout to the upside, particularly when accompanied by increasing volume, which is present here. The compression of price within the wedge signal
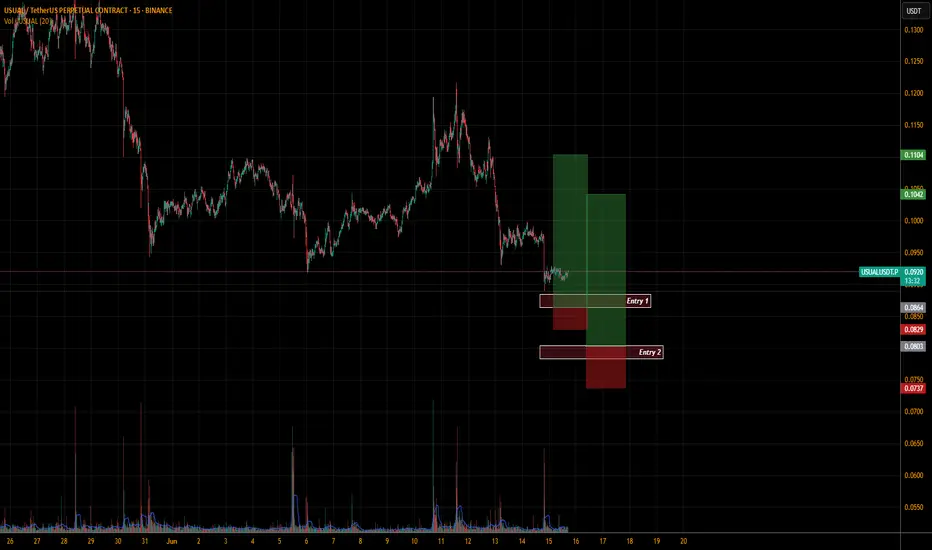
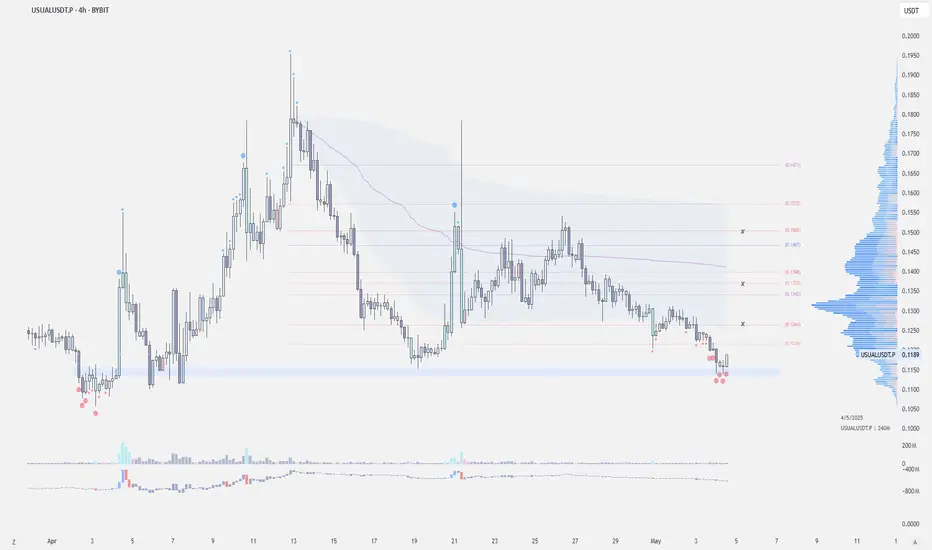
USUALUSDT.PLong setup for usual has been marked on the chart..
I will suggest the entry 2 for safer entry.
The entry 1 only if we see it makes a good support there.
DYOR
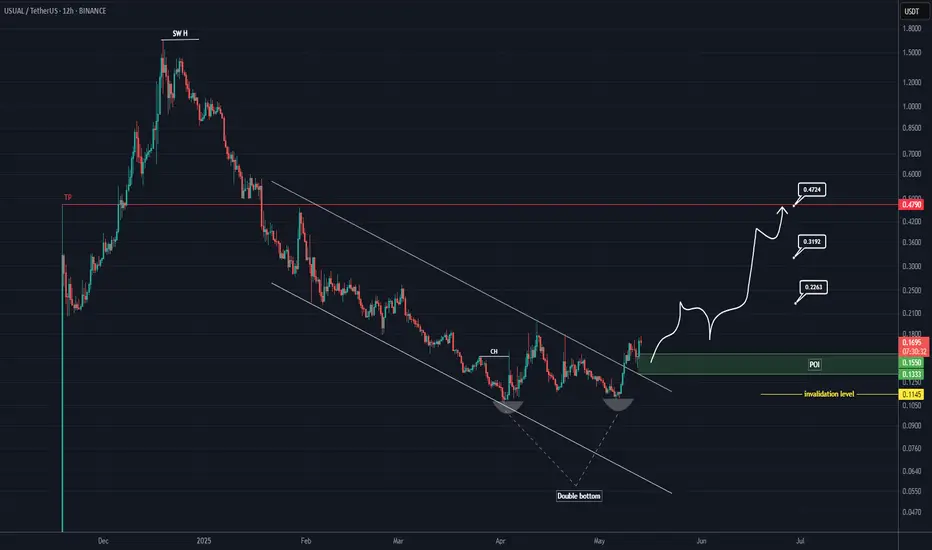
USUAL Looks Bullish (12H)A double bottom pattern has formed on the chart, leading to a breakout from the price channel.
A support zone has been established, and a bullish CH has appeared on the chart.
Considering the breakout and the bullish structure, we can set up a buy position on this coin.
Targets are marked on the
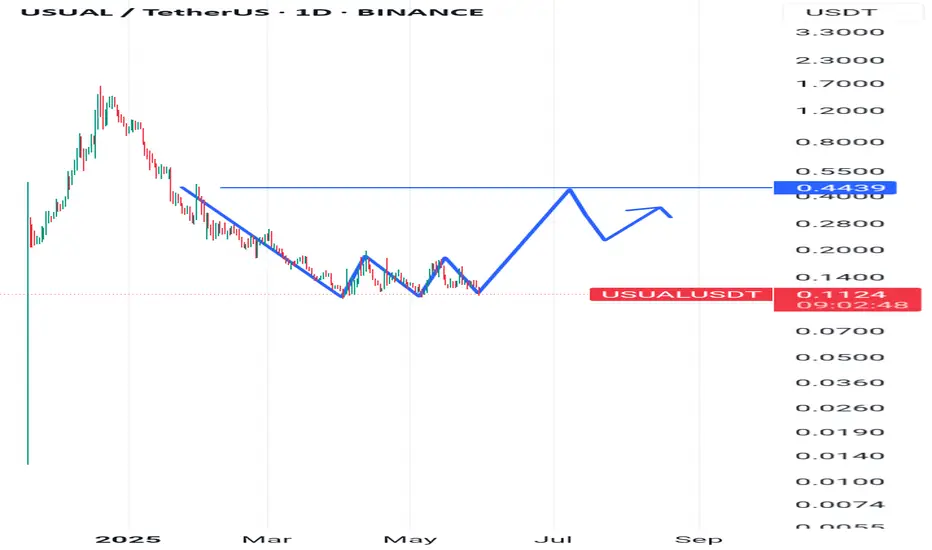
USUALUSDT 1D Analysis USUAL ~ 1D Analysis
#USUAL Buy gradually from here with a short term target of at least 15%+ from here. These are the early signs when whales start to accumulate.

$USUAL - Triple Bottom Scalp Long$USUAL | 4h
**Weekend scalp long setup**
We're seeing a potential **triple bottom** forming on the local timeframe, indicating strong demand around this support zone. Price has tested this level three times without a breakdown, suggesting seller exhaustion.
If we hold above the most recent low,
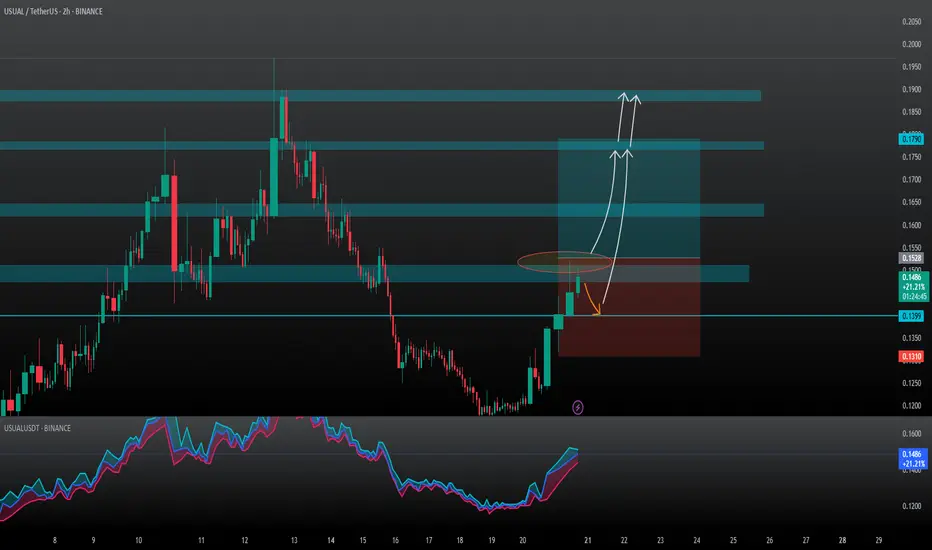
USUAL Idea - USUAL/TheterHey traders!
Sorry, no chart Analysis!
My suggestion is to enter above the $0.1530 price range
With targets:
1- $0.1650
2- $0.1790
3- $0.1900
There is a possibility of a price correction to the $0.1400 range
Good luck

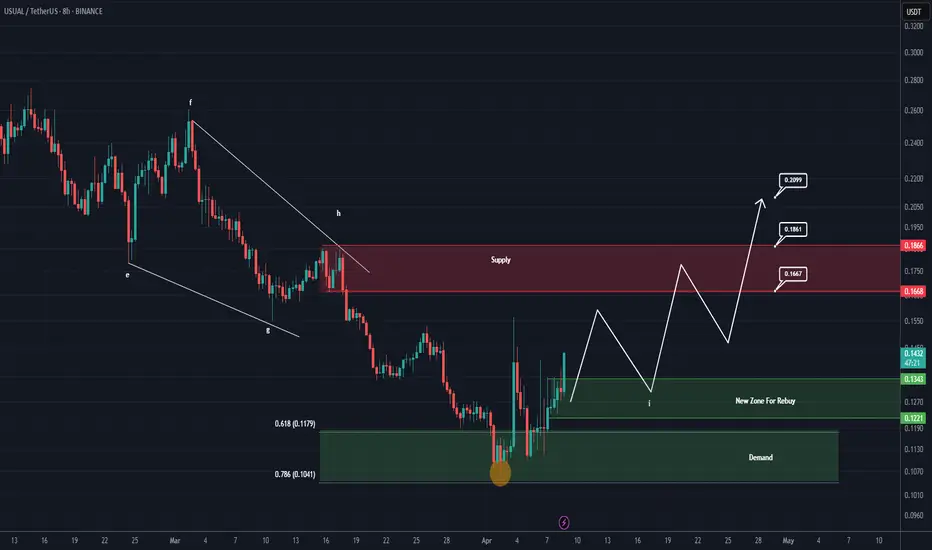
USUAL is waking up - the beginning of a new bullish wave?This analysis is an update of the analysis you see in the "Related publications" section
We previously had accurate analyses of USUAL, correctly identifying the highs and lows.
Based on the type of custom order flow visible on the chart and recent candlestick formations, it seems that the buy orde
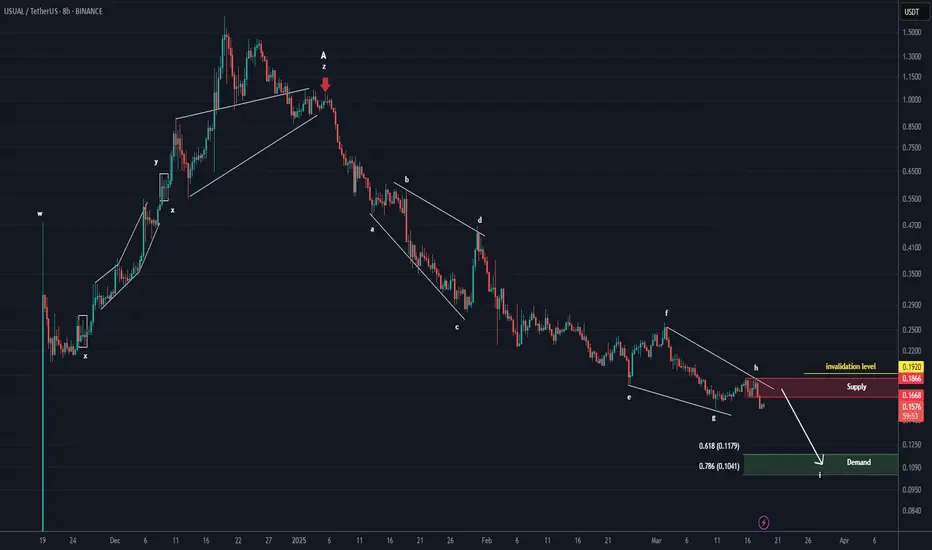
USUAL ANALYSIS (8H)After wave A was completed, from the point where we placed the red arrow on the chart, it seems the price has entered wave B.
Wave B is a bearish symmetrical wave, and it currently appears that we are in the early stages of wave I, which is a bearish wave.
From the supply zone, we expect a rejecti
See all ideas
Summarizing what the indicators are suggesting.
Oscillators
Neutral
SellBuy
Strong sellStrong buy
Strong sellSellNeutralBuyStrong buy
Oscillators
Neutral
SellBuy
Strong sellStrong buy
Strong sellSellNeutralBuyStrong buy
Summary
Neutral
SellBuy
Strong sellStrong buy
Strong sellSellNeutralBuyStrong buy
Summary
Neutral
SellBuy
Strong sellStrong buy
Strong sellSellNeutralBuyStrong buy
Summary
Neutral
SellBuy
Strong sellStrong buy
Strong sellSellNeutralBuyStrong buy
Moving Averages
Neutral
SellBuy
Strong sellStrong buy
Strong sellSellNeutralBuyStrong buy
Moving Averages
Neutral
SellBuy
Strong sellStrong buy
Strong sellSellNeutralBuyStrong buy
Displays a symbol's price movements over previous years to identify recurring trends.