vanausdtthis altcoin is very strong in fall down btc
its in accumulation phase
buy and hold
when it want go to the moon?! when you sell it :D

#VANA/USDT#VANA
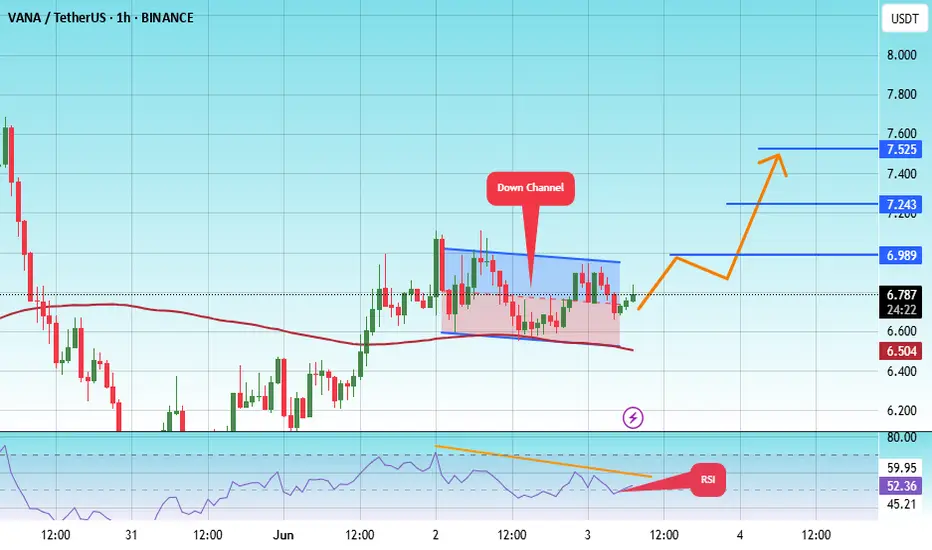
The price is moving within a descending channel on the 1-hour frame, adhering well to it, and is heading for a strong breakout and retest.
We are seeing a bounce from the lower boundary of the descending channel, which is support at 6.52.
We are seeing a downtrend on the RSI indicator that
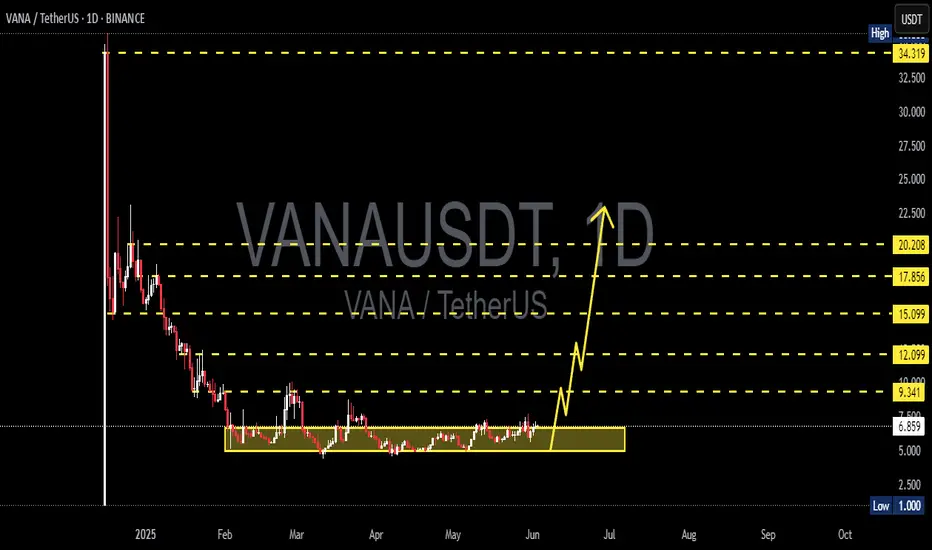
VANAUSDT 1D AnalysisVANA ~ 1D Analysis
#VANA Looks familiar, like an accumulation area where whales are doing it. Buy gradually with a short term target of at least 15%+ from here.
Vana, Easy Short-Term 180% Target—Profits vs Greed—350% NextI am giving you this one as a short-term chart setup. Vana has been rising since mid-March and I sense this chart becoming stronger by the day. The fact that the action is still happening at bottom prices after months of sideways is also good. This means that the breakout will be a surprise and supe

Vana 1111% Potential? Consolidation Continues (Trading Strategy)Consolidation as in bullish consolidation because prices have been moving up for months, the bottom was hit mid-March.
Good evening my fellow Cryptocurrency trader, I hope you are having everything that you wish to have in this moment in this time in this life.
I hope you are having a beautiful we

VANA superbThe news of tokenisation has hit the Fbuy print on vana and from there you can see how the price spiked. The next uptrend levels are in the range of 9, 11 and so on
for indicator access, you can contact me
DYOr
goodluck

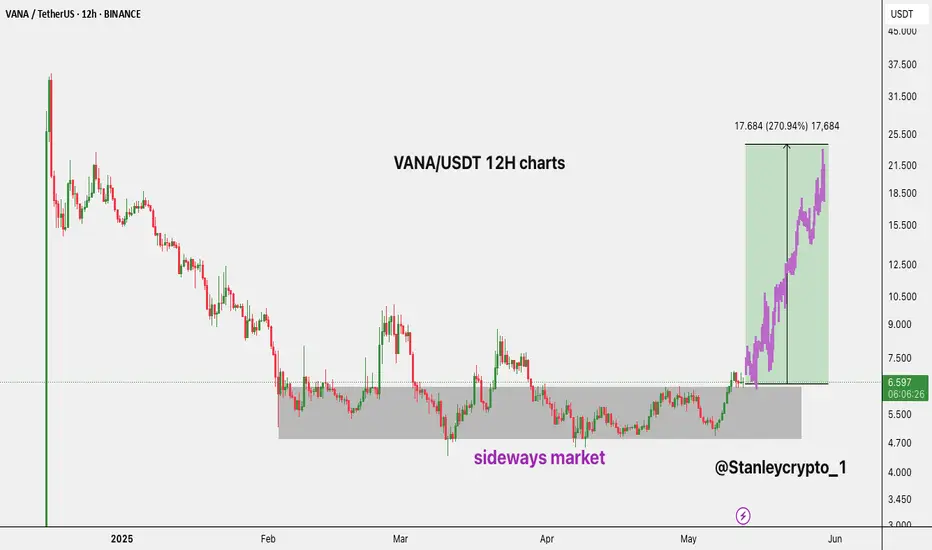
$VANA/USDT BREAKOUT ALERT🚨 BREAKOUT ALERT $VANA/USDT 🚨
After months of grinding in a sideways market, BME:VANA has finally broken out with strong momentum! 270% upside potential from the breakout zone is now on the table!
📈 Accumulation done. Expansion phase activated.
Are you riding this wave?
DYRO, NFA
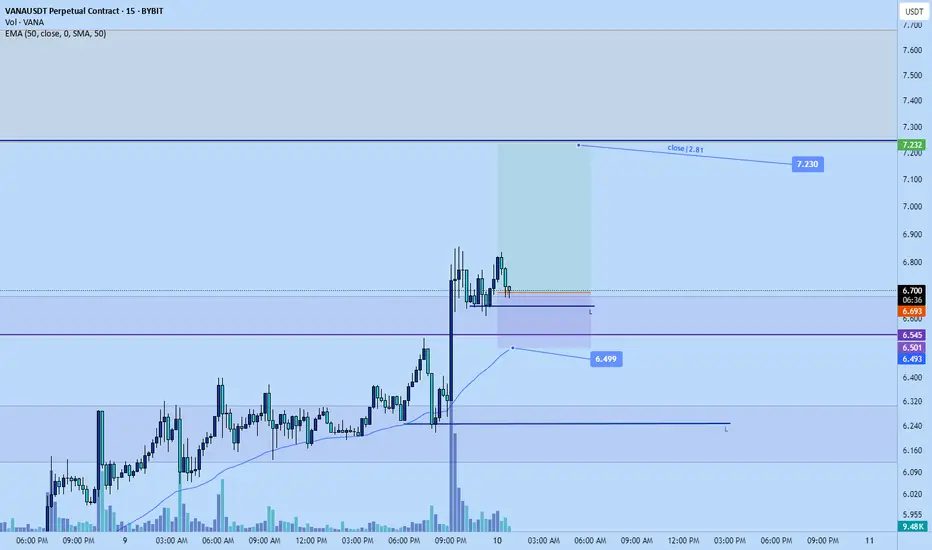
Vana long to $7.23Just now opened a long position on #vana
Target: $7.23
Stop: $6.5 or lower
Roughly 2.8RR
Betting on trend momentum with this one as i didn't wait for confirmation just because I think perhaps by the time I do the RR would be less than I would like and market might push strongly so made an except
Vana scalp long to $5.740Just now opened a long position on vana. Expecting a continuation breakout to the upside towards $5.740
Stop: $5.5 Stop or lower
Roughly 2RR
Market already pumped quite a bit so ideally don't want to be holding this for long

Vanausdt long to $5.563Just now opened a long position on vana. targetting $5.563 area
Got in a bit late. Roughly 2 RR.
Stop: $5.295 area

See all ideas
Summarizing what the indicators are suggesting.
Oscillators
Neutral
SellBuy
Strong sellStrong buy
Strong sellSellNeutralBuyStrong buy
Oscillators
Neutral
SellBuy
Strong sellStrong buy
Strong sellSellNeutralBuyStrong buy
Summary
Neutral
SellBuy
Strong sellStrong buy
Strong sellSellNeutralBuyStrong buy
Summary
Neutral
SellBuy
Strong sellStrong buy
Strong sellSellNeutralBuyStrong buy
Summary
Neutral
SellBuy
Strong sellStrong buy
Strong sellSellNeutralBuyStrong buy
Moving Averages
Neutral
SellBuy
Strong sellStrong buy
Strong sellSellNeutralBuyStrong buy
Moving Averages
Neutral
SellBuy
Strong sellStrong buy
Strong sellSellNeutralBuyStrong buy
Displays a symbol's price movements over previous years to identify recurring trends.