US30SIGNAL: BUY
A) SETUP: B (h1 wave5 to Correction)
B) CONFIRMATION:
1) SBT: done
2) RSI DIVERGENCE: done
3) MOMENTUM CANDLE: done
C) RR = 1:3
DJ30 trade ideas

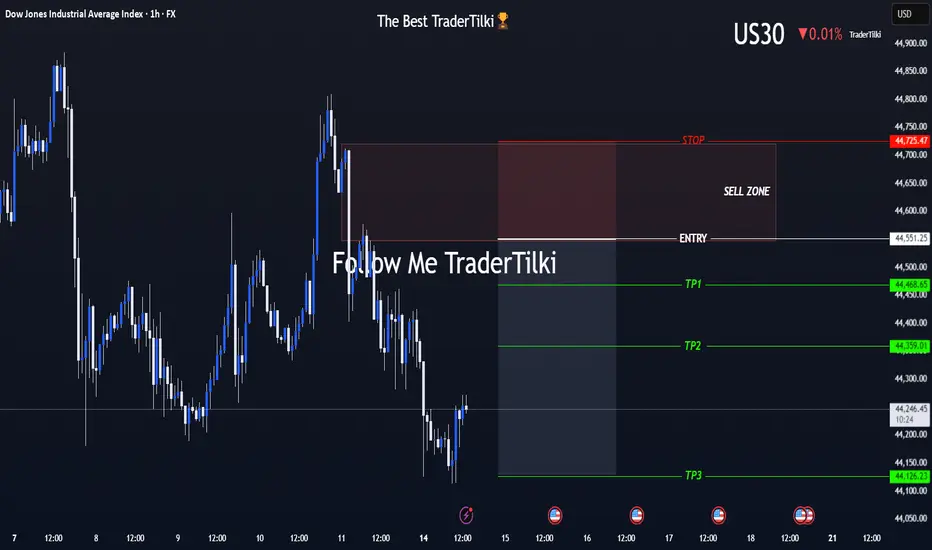
US30 (Dow Jones) Is On My Radar — The Moment’s Getting Close!Hey Guys,
I've marked my sell zone on the Dow Jones (US30) chart.
Once price reaches my entry range, I’ll be jumping into this high-probability trade setup.
🚪 Entry Levels: 44,551 – 44,632 – 44,677
🛑 Stop Loss: 44,725
🎯 Targets:
• TP1: 44,468
• TP2: 44,359
• TP3: 44,126
📐 Risk-to-Reward Ratio: Approximately 2.41 from the 44,551 entry
Your likes and support are what keep me motivated to share these analyses consistently.
Huge thanks to everyone who shows love and appreciation! 🙏
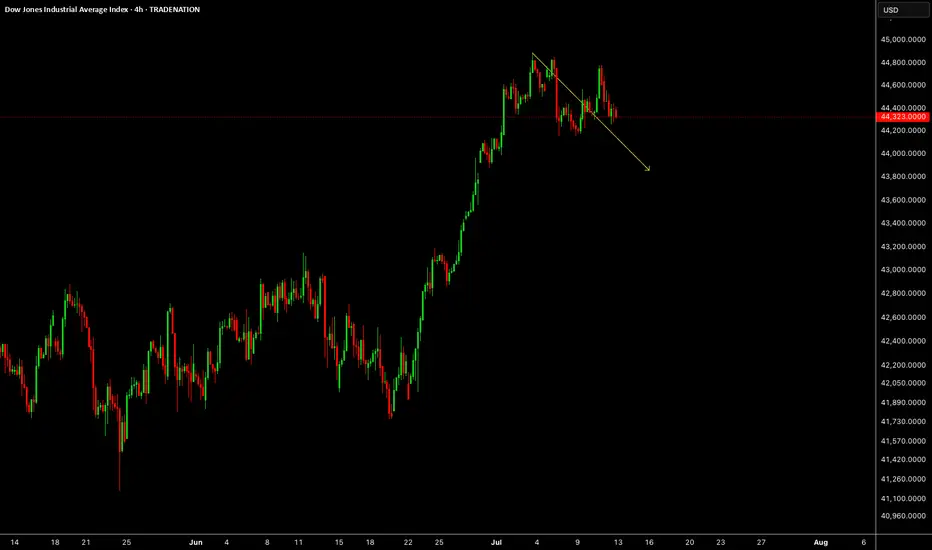
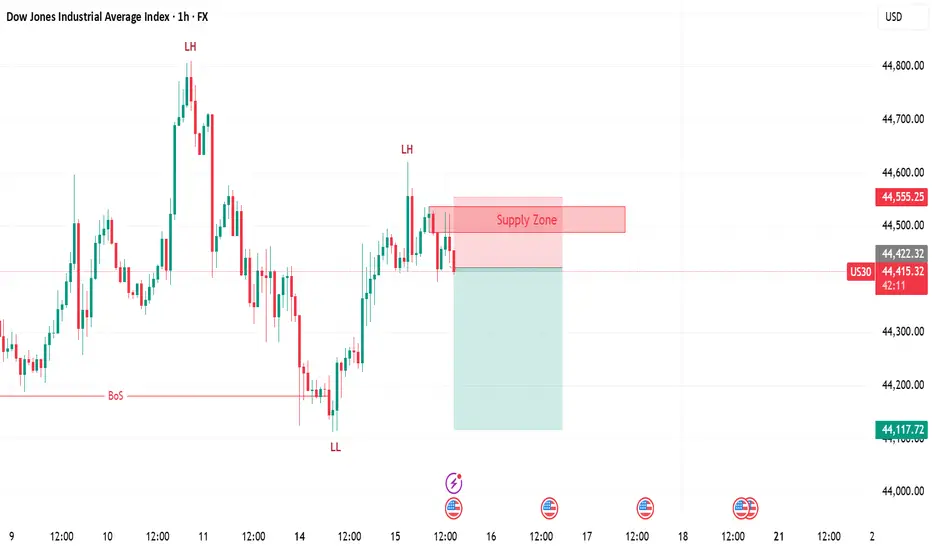
Us30 h4 next move Rejection near BoS
2. Break below support zone
3. Lower high formation
4. Bearish continuation towards 43,250
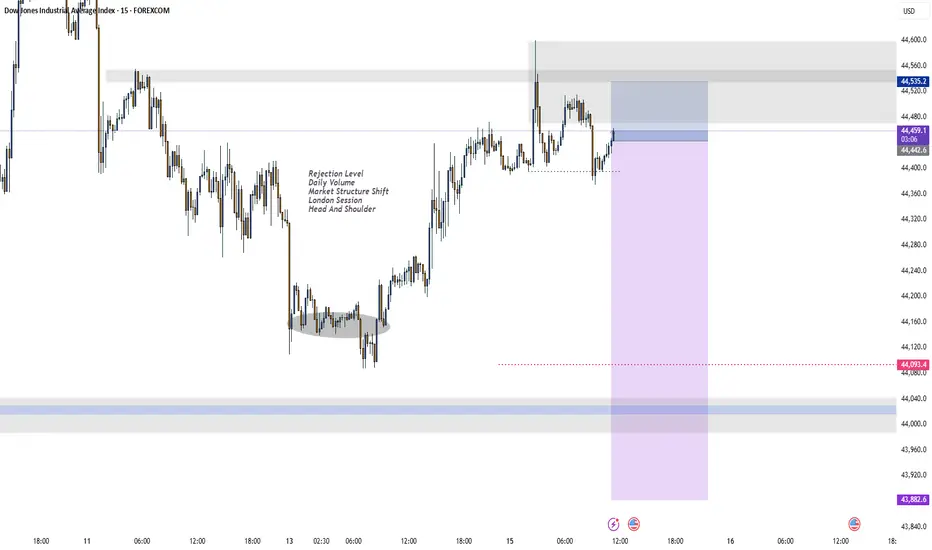
14.07.25 Morning ForecastPairs on Watch -
FX:NZDCAD
FX:USDJPY
FX:EURUSD
OANDA:US30USD
A short overview of the instruments I am looking at for today, multi-timeframe analysis down to what I will be looking at for an entry. Enjoy!

Dow Jones Potential DownsidesHey Traders, in today's trading session we are monitoring US30 for a selling opportunity around 44,450 zone. Dow Jones is trading in a downtrend and currently is in a correction phase in which it is approaching the trend at 44,450 support and resistance area.
Trade safe, Joe.

US30: Bears Are Winning! Short!
My dear friends,
Today we will analyse US30 together☺️
The price is near a wide key level
and the pair is approaching a significant decision level of 44,420.7 Therefore, a strong bearish reaction here could determine the next move down.We will watch for a confirmation candle, and then target the next key level of 44,379.6..Recommend Stop-loss is beyond the current level.
❤️Sending you lots of Love and Hugs❤️
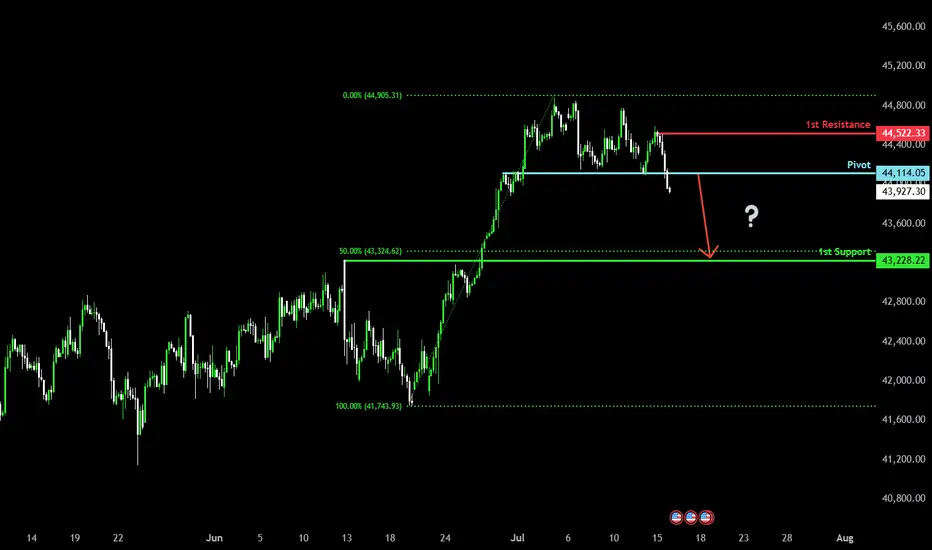
Bearish drop?Dow Jones (US30) has reacted off the pivot and could drop to the 1st support which has been identified as a pullback support.
Pivot: 44,114.05
1st Support: 43,228.22
1st Resistance: 44,522.33
Risk Warning:
Trading Forex and CFDs carries a high level of risk to your capital and you should only trade with money you can afford to lose. Trading Forex and CFDs may not be suitable for all investors, so please ensure that you fully understand the risks involved and seek independent advice if necessary.
Disclaimer:
The above opinions given constitute general market commentary, and do not constitute the opinion or advice of IC Markets or any form of personal or investment advice.
Any opinions, news, research, analyses, prices, other information, or links to third-party sites contained on this website are provided on an "as-is" basis, are intended only to be informative, is not an advice nor a recommendation, nor research, or a record of our trading prices, or an offer of, or solicitation for a transaction in any financial instrument and thus should not be treated as such. The information provided does not involve any specific investment objectives, financial situation and needs of any specific person who may receive it. Please be aware, that past performance is not a reliable indicator of future performance and/or results. Past Performance or Forward-looking scenarios based upon the reasonable beliefs of the third-party provider are not a guarantee of future performance. Actual results may differ materially from those anticipated in forward-looking or past performance statements. IC Markets makes no representation or warranty and assumes no liability as to the accuracy or completeness of the information provided, nor any loss arising from any investment based on a recommendation, forecast or any information supplied by any third-party.
Dow Jones Potential DownsidesHey Traders, in the coming week we are monitoring US30 for a selling opportunity around 44,270 zone, US30 is trading in an uptrend and currently seems to be attempting to break it down, if we get dips below the trend we will be looking for a potential retrace towards further downsides.
Trade safe, Joe.

US30 Price close below Bullish reversal Then drop to 43,800The US30 is currently in a consolidation phase after a strong bullish rally, but is now showing signs of weakness. The index is facing resistance near 44,700, and as long as the price remains below this level, the bearish correction is expected to continue.
If the price fails to break above 44,700 and closes below this resistance, we could see a push toward the support zones at 44,004 and 43,800. A bullish reversal may only be considered if the price successfully holds above 44,700 on a strong candle close.
For now, bearish bias remains intact unless a confirmed breakout occurs above key resistance.
Ps Support with like and comments for more better analysis share with you Thanks for Supporting.

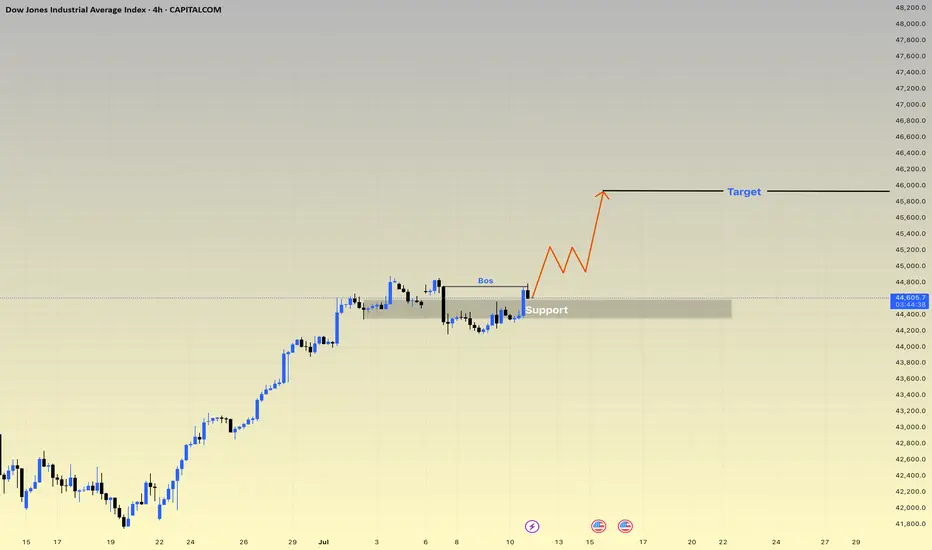
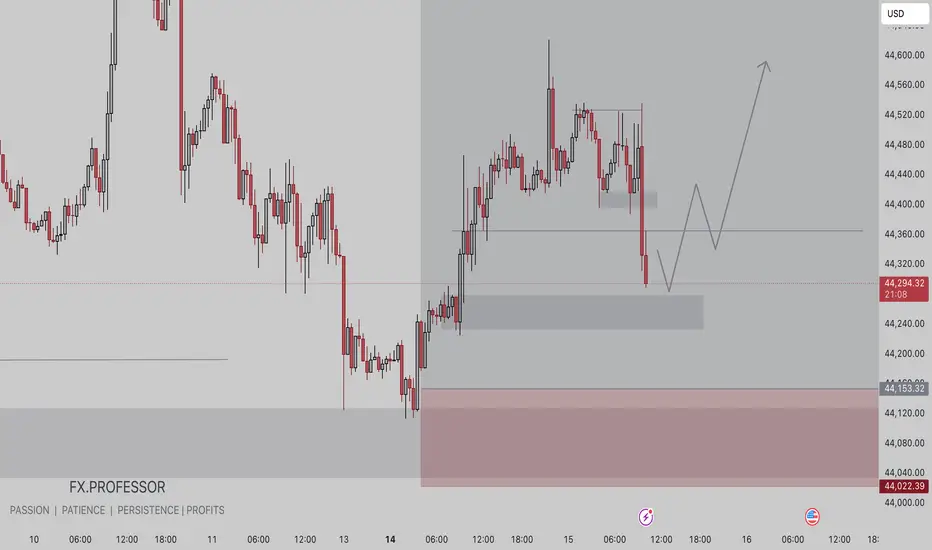
US30 prepare for the bullish 1. there is double bottom at 44152 level, i will tend to wait for the sweep meaning the price go down and hit the 4hr order block.
2. wait for 15m/ 30m TF a strong bullish momentum.
3. retest the 44152 around level or 0.618 to enter the market to long
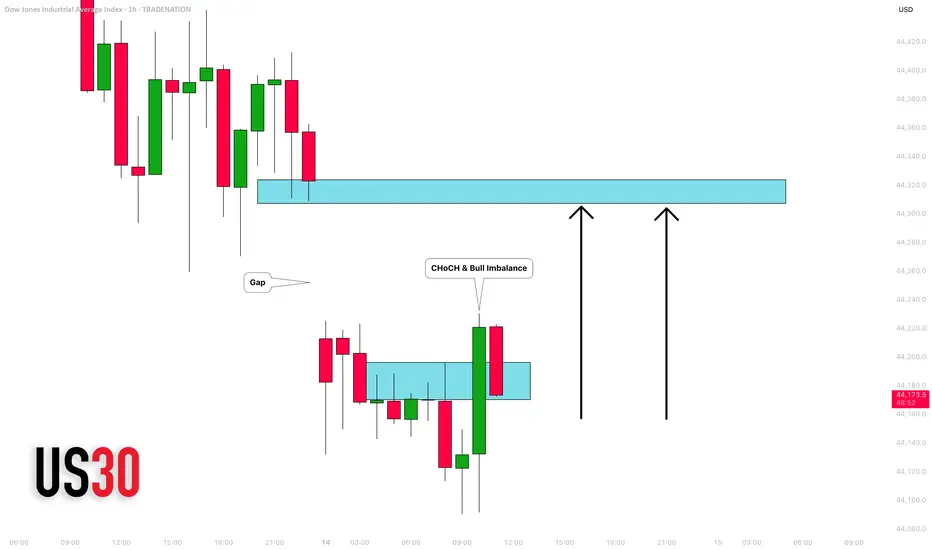
DOW JONES INDEX (US30): Classic Gap Trade
I see a gap down opening on US30 index.
As always, there is a high chance that this gap is going to be filled.
A bullish imbalance candle and a local change of character CHoCH
indicate a highly probable rise to a gap opening level.
Target - 44300
❤️Please, support my work with like, thank you!❤️
I am part of Trade Nation's Influencer program and receive a monthly fee for using their TradingView charts in my analysis.
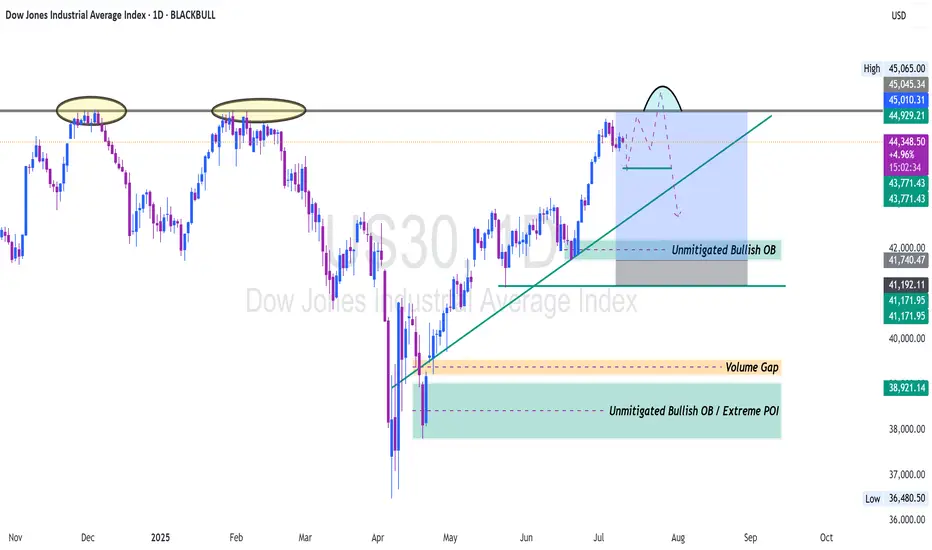
US 30 is still bullish OverallThe Buy set up remains higher probability set up till we get a bearish confirmation and if that happens very instructively, then the extreme POI would be a great TP target and the next higher probability buy trade set up
US30 SCALING OPPORTUNITYThere could be a potential scaling opportunity on US30. I have secured partials on this instrument so scaling up will have to be done very carefully with little risk.
Crystal ball market Crystal ball market ..market insights are invaluable! Their team provides actionable advice and their customer service is top-notch. A trusted broker in this industry!
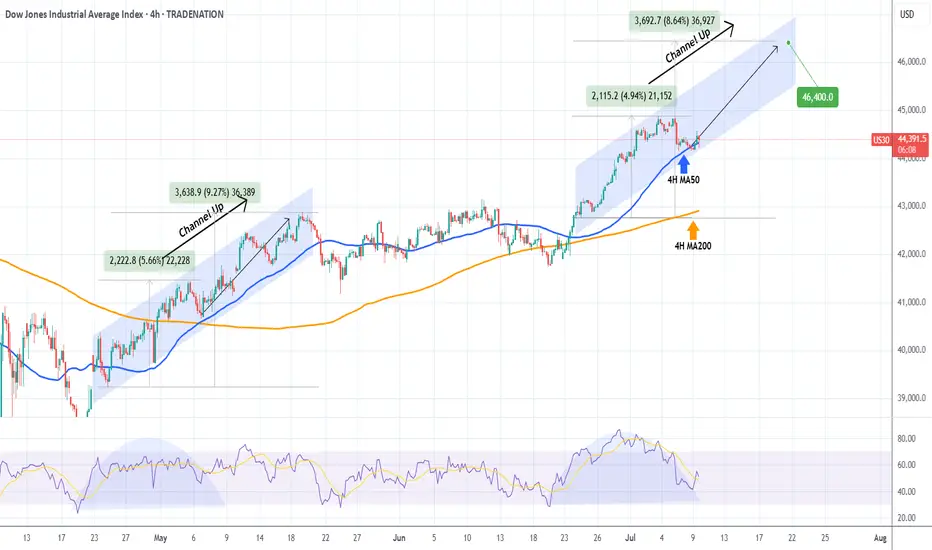
DOW JONES repeating May's pattern.Dow Jones (DJI) has been testing its 4H MA50 (blue trend-line) since yesterday, following 2 straight weeks of trading strongly above it.
If it holds and rebounds, the pattern will draw even more similarities with May's Channel Up, which after the May 06 Low, it resumed the uptrend to peak on a +9.27% rise from the bottom, before breaking below the 4H MA50.
Since the current rise is -0.70% weaker (+4.94% against +5.66%) from May's fractal, we can assume that as long as the 4H MA50 holds, we can expect a peak at 46400.
-------------------------------------------------------------------------------
** Please LIKE 👍, FOLLOW ✅, SHARE 🙌 and COMMENT ✍ if you enjoy this idea! Also share your ideas and charts in the comments section below! This is best way to keep it relevant, support us, keep the content here free and allow the idea to reach as many people as possible. **
-------------------------------------------------------------------------------
Disclosure: I am part of Trade Nation's Influencer program and receive a monthly fee for using their TradingView charts in my analysis.
💸💸💸💸💸💸
👇 👇 👇 👇 👇 👇
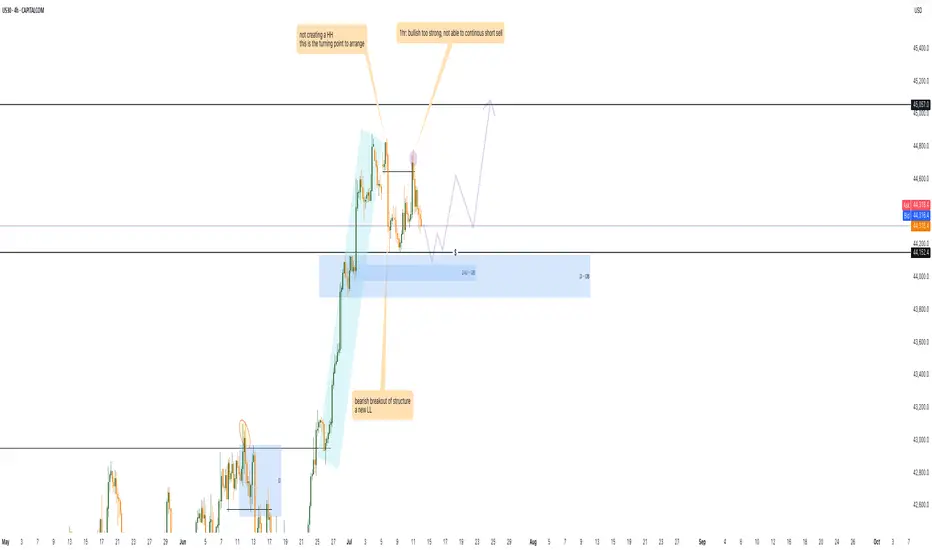
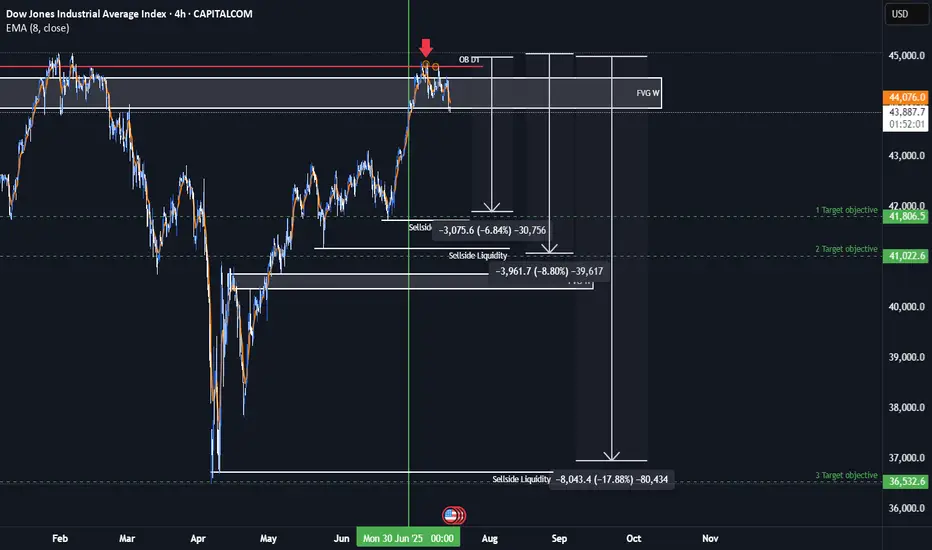
US30 Bearish IdeaAs we can see this is a anticipation of us being in a quarterly shift in the markets and having an assumption that we had a retracement up to collect more orders for smart money to go short. We have relative strength with US30 against both NASDAQ and the SP500. We have seen resistance in our premium arrays of our weekly FVG and daily order block
* Fundamental analysis:
We are are having a shift in our bond yields which could potentially effect the dollar giving it strength and you add the fact that dollar is under valued when we have a stronger dollar rate than the rest of the basket currencies we could see it negatively effect the Dow this quarter. The Dow is very over valued and we have had consistent quantitative easing from the Fed and the Fed balance sheet has been still consistently decreasing. The commercial interest have also seen a great rise of buying dollar and if dollar is being bought up then something would need to be sold.
US30 Bearish Below 44490 – Watching 44180 US30 Analysis
US30 remains bearish below 44490, with downside targets at 44180 and 43960.
A 1H close below 44180 would confirm continuation toward 43630.
To turn bullish, price must break above 44490.
Pivot: 44430
Resistance: 44460, 44550, 44760
Support: 44180, 43960, 43630
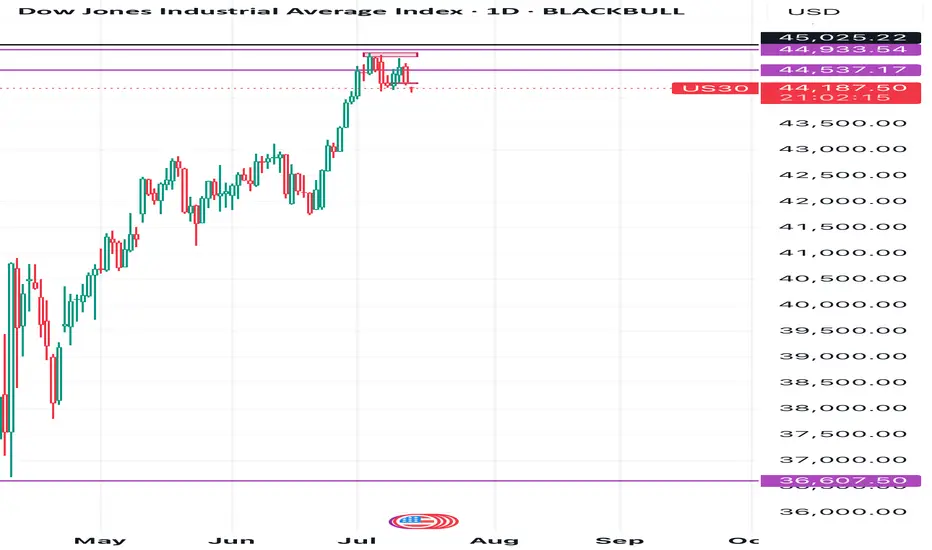
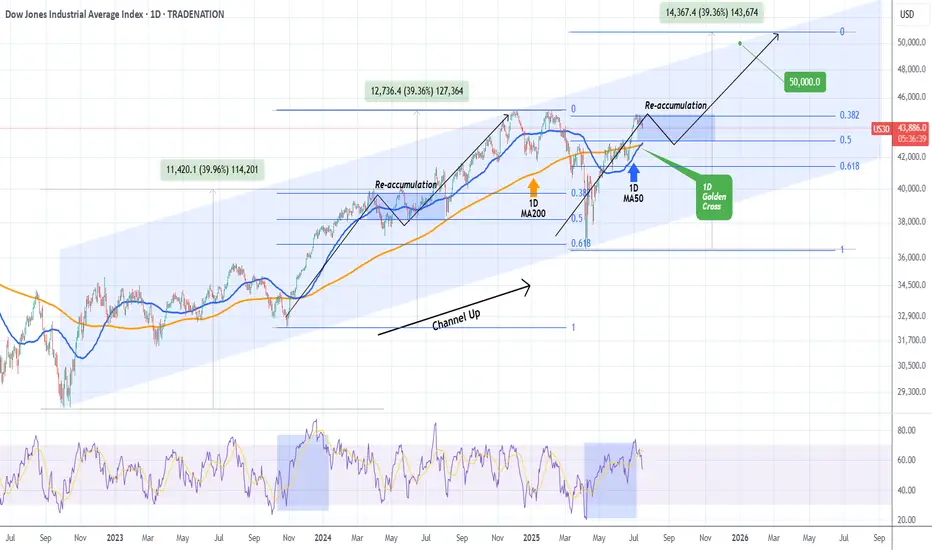
DOW JONES formed 1st 1D Golden Cross since 2022!Dow Jones (DJIA) completed on Monday its 1st Golden Cross on the 1D time-frame since December 12 2022! This powerful bullish pattern comes with the price close to its All Time High (ATH).
Being inside almost a 3-year Channel Up, the current rise is the pattern's latest Bullish Leg following the April 07 2025 bottom (Higher Low). Both previous Bullish Legs rose by +39.96% before forming a Higher High.
Based on the Fibonacci retracement levels, last time the previous Bullish Leg was within the 0.382 - 0.5 Fibonacci Zone, it formed a Re-accumulation Phase for 3 months. As a result, we shouldn't dismiss the fact of trading sideways for the rest of the Summer and then picking up the pace. Our end-of-year Target remains 50000.
-------------------------------------------------------------------------------
** Please LIKE 👍, FOLLOW ✅, SHARE 🙌 and COMMENT ✍ if you enjoy this idea! Also share your ideas and charts in the comments section below! This is best way to keep it relevant, support us, keep the content here free and allow the idea to reach as many people as possible. **
-------------------------------------------------------------------------------
Disclosure: I am part of Trade Nation's Influencer program and receive a monthly fee for using their TradingView charts in my analysis.
💸💸💸💸💸💸
👇 👇 👇 👇 👇 👇
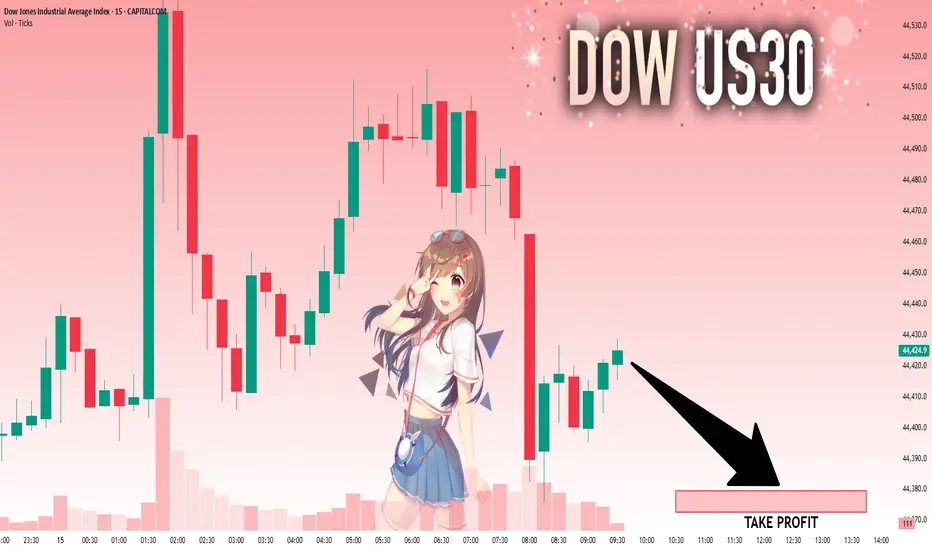
US30 | SELLConfirmation from 15 minute timeframe.
General trend in 1H is downward.
Trading with impulse.
US30 – Bearish Outlook Below 44,500 as CPI Looms US30 – Bearish Outlook Below 44,500 as CPI Looms
US30 rallied and successfully reached our resistance target, as expected in the previous analysis.
However, with today’s CPI release, the market is likely to see increased volatility. As long as the index trades below 44,500–44,570, the bias remains bearish, with downside targets at 44,210 and 43,960.
• If CPI prints below 2.6%, we may see a bullish breakout toward 45,100
• Above or equal to 2.6% supports continuation of the bearish move
However, we expect a 2.7% reading, driven by tariff-related price increases, which would support the bearish scenario.
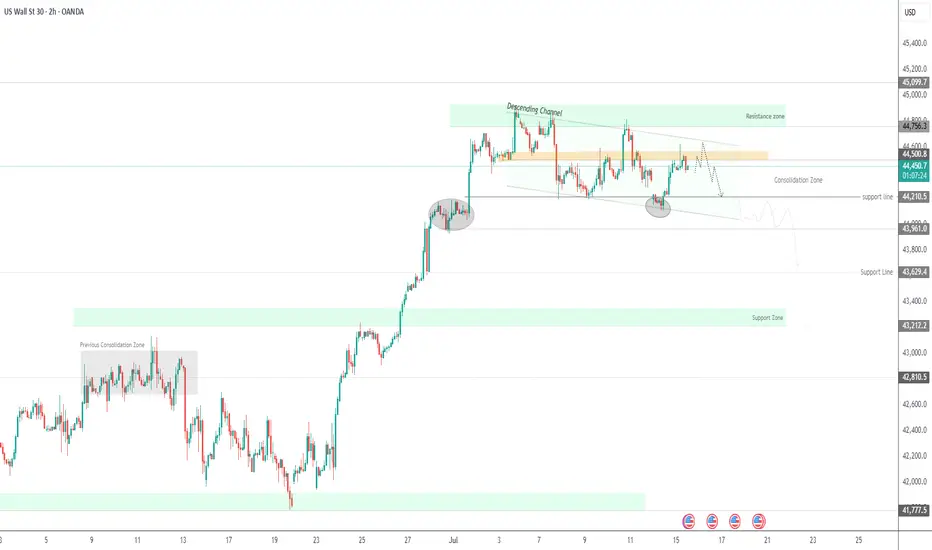
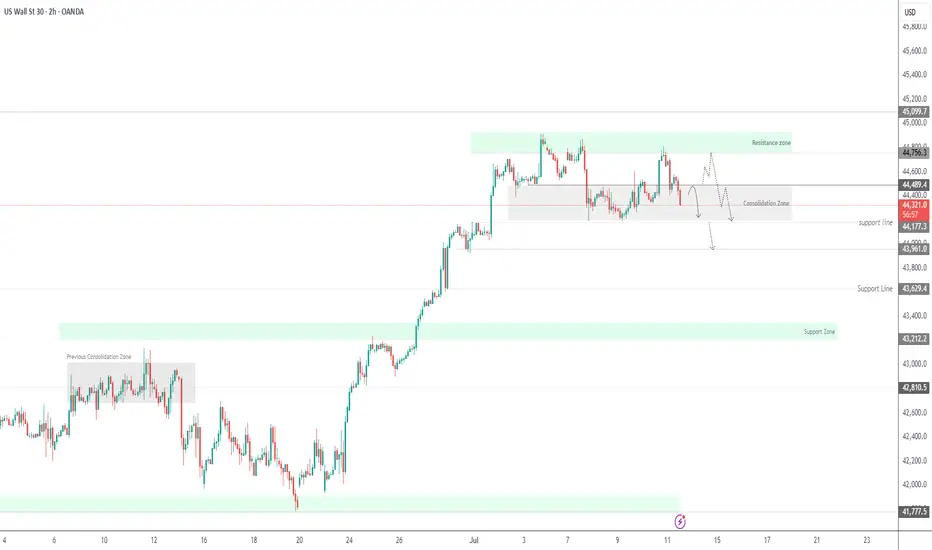
US30 Consolidates Below Resistance – Tariff Risks LoomUS30 – Market Overview
The price is currently consolidating within the range of 44490 to 44180, awaiting a breakout to determine the next directional move.
Bearish Scenario:
As long as the price trades below 44490, we expect bearish volatility to retest 44180.
A confirmed 1H close below 44180 would open the path toward 43960 and 43760.
Bullish Scenario:
If the price closes above 44490, it will likely trigger a bullish move toward 44750, with potential extension to 44970 ATH and beyond.
Note: Market sentiment remains sensitive to tariff-related developments, which may drive sharp moves in either direction.
Pivot Level: 44490
Support: 44180, 43960, 43770
Resistance: 44750, 44960, 45100
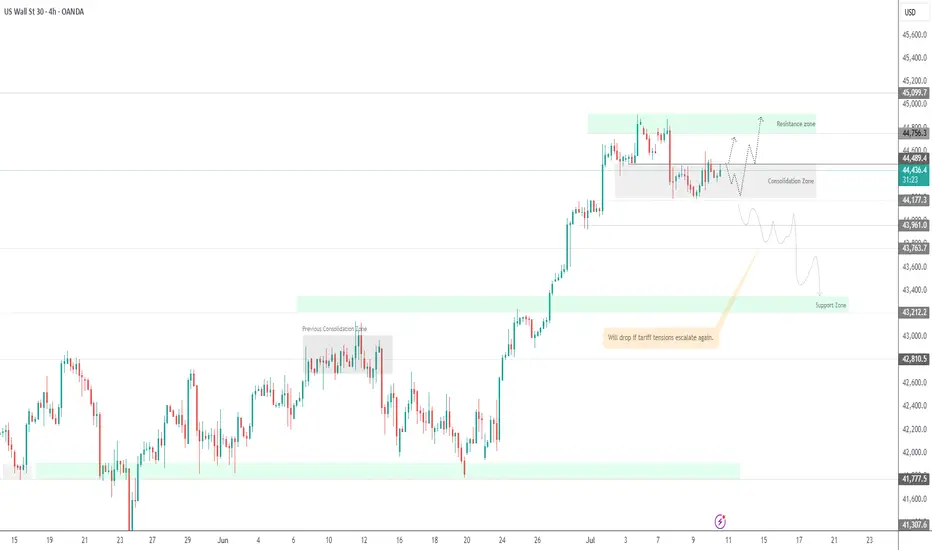
US30US30 needs some more correction before we go bullish again.
Disclosure: We are part of Trade Nation's Influencer program and receive a monthly fee for using their TradingView charts in our analysis.