Dow Jones Index Cash CFD (USD) forum
US data was good. Still possible to drop?
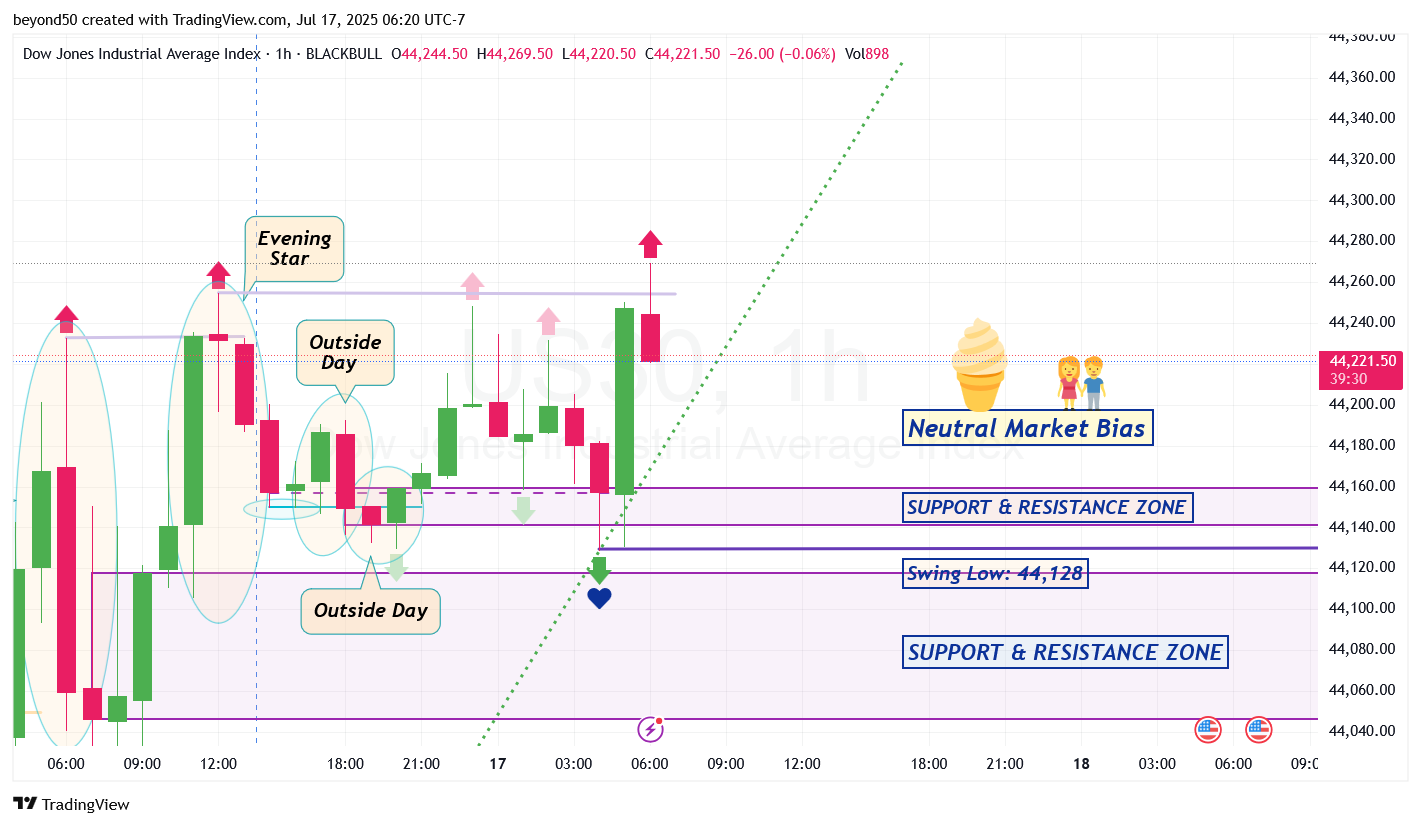
We'll see if that happens. If it does, then the bears can head for the S&R Zone below that starts at 44,159. But if the bears reject the Bullish Trendline (in green dotted line), then the bullish rally can resume.
*Side Note: Price action is "magnetically attracted" to trendlines to cross.
2/2 📈 Summary of Key Levels
Daily & 4-Hour Support and Resistance
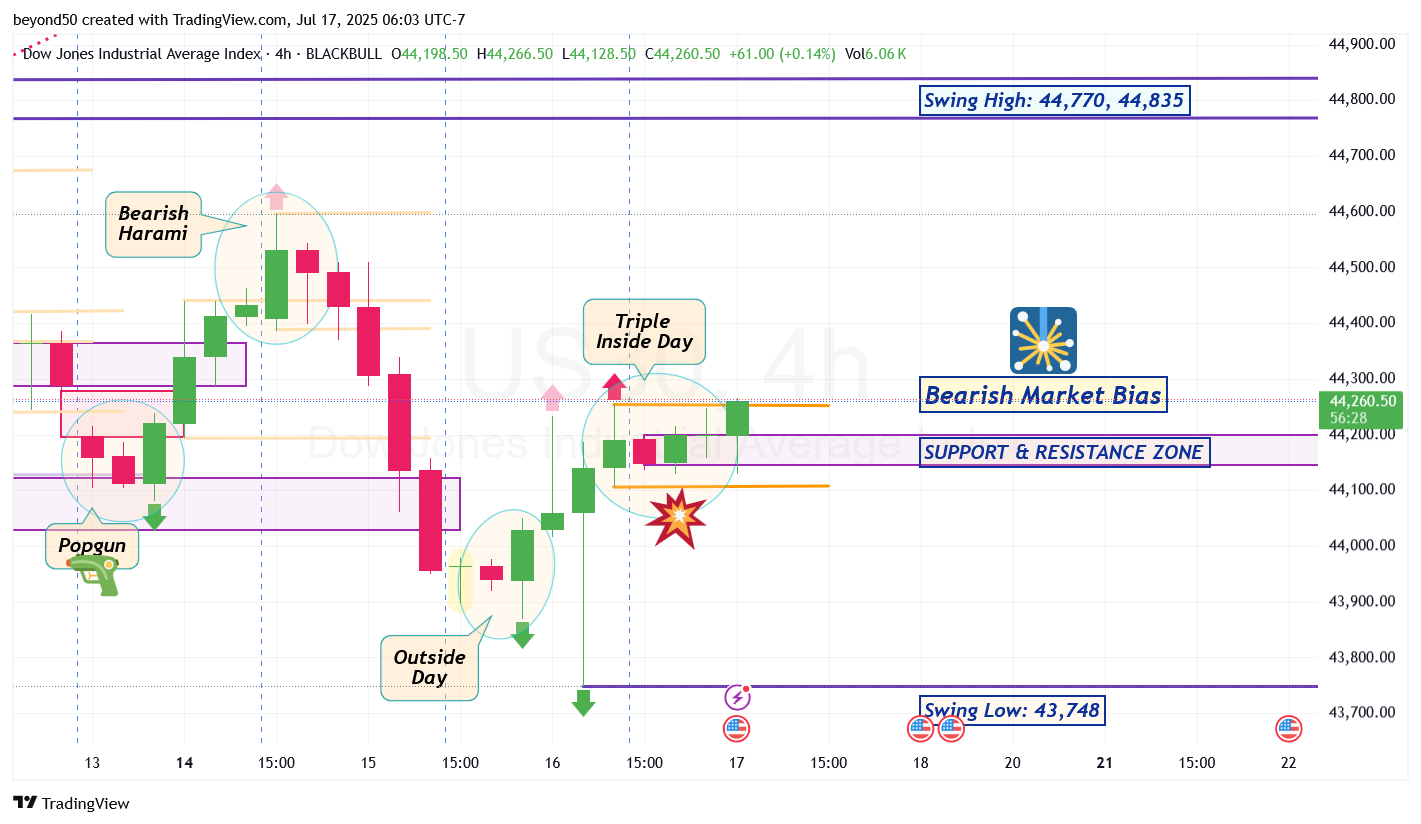
Daily Support: 44,126, 44,200, 44,350
Daily Resistance: 44,500, 44,700, 44,866
4-Hour Support: 44,126, 44,180, 44,250
4-Hour Resistance: 44,400, 44,500, 44,700
Exponential Moving Average (EMA) Levels
Daily EMA Levels:
EMA 50: 44,350
EMA 100: 44,250
EMA 200: 44,180
EMA 400: 44,050
4-Hour EMA Levels:
EMA 50: 44,280
EMA 100: 44,220
EMA 200: 44,150
EMA 400: 44,100
Weekly Pivots
Weekly Pivot Point: 44,400
Weekly Resistance: 44,700, 44,800
Weekly Support: 44,200, 44,100
Daily Pivots
Daily Pivot Point: 44,350
Daily Resistance: 44,500, 44,700
Daily Support: 44,200, 44,126
Fibonacci Retracement Levels
23.6%: 44,522
38.2%: 44,423
50%: 44,497
61.8%: 44,373
📊 Fundamental Analysis and USD News
As we look ahead, several important USD news events could significantly impact the US30 market. Key upcoming releases include:
Consumer Price Index (CPI) Report: Scheduled for July 25, this report will provide insights into inflation trends, which are crucial for monetary policy decisions. A higher-than-expected CPI could lead to increased volatility in the US30 as traders adjust their positions based on anticipated Federal Reserve actions.
Federal Reserve Meeting Minutes: Set to be released on July 28, these minutes will shed light on the central bank's future policy direction. Any hints of interest rate changes could lead to sharp movements in the US30.
Jobless Claims Data: Expected on July 20, this data will offer insights into the labor market's health. A significant increase in claims could signal economic weakness, potentially impacting investor sentiment and the US30.
1/1 🟡 US30 Daily Market Analysis—July 17, 2025
🔍 Market Analysis Overview
As we delve into the current market dynamics of the US30, trading at 44,200 USD, we will analyze key technical indicators across daily and 4-hour time frames. This analysis will incorporate Fibonacci Retracement Levels, Exponential Moving Averages (EMA), RSI Divergence, Weekly and Daily Pivots, Smart Money Concepts (SMC), Support & Resistance Levels, Order Blocks, and MACD to provide a comprehensive view of market sentiment and potential price movements.
Support & Resistance Levels
Daily Time Frame:
Resistance Levels:
44,866 (Swing High)
44,700 (Psychological Resistance)
44,500 (Recent High)
Support Levels:
44,126 (Swing Low)
44,350 (Recent Low)
44,200 (Current Price Level)
4-Hour Time Frame:
Resistance Levels:
44,700 (Short-term Resistance)
44,500 (Previous High)
44,400 (Intraday Resistance)
Support Levels:
44,126 (Swing Low)
44,180 (4-Hour Support)
44,250 (Recent Low)
Fibonacci Retracement Levels
Using the swing high of 44,866 and swing low of 44,126, we can identify significant Fibonacci retracement levels:
23.6% Retracement: 44,522
38.2% Retracement: 44,423
50% Retracement: 44,497
61.8% Retracement: 44,373
These levels serve as potential reversal points and are crucial for identifying entry and exit strategies.
Exponential Moving Averages (EMA)
Daily Time Frame:
EMA 50: 44,350
EMA 100: 44,250
EMA 200: 44,180
EMA 400: 44,050
The daily EMAs indicate a bullish trend as the price remains above the 50, 100, and 200 EMAs, suggesting upward momentum.
4-Hour Time Frame:
EMA 50: 44,280
EMA 100: 44,220
EMA 200: 44,150
EMA 400: 44,100
In the 4-hour time frame, the EMAs also reflect bullish sentiment, with the price trading above key EMA levels.
RSI Divergence
The Relative Strength Index (RSI) currently shows a divergence on both daily and 4-hour time frames. While the price has been making higher highs, the RSI is not confirming this move, indicating a potential weakening of the bullish momentum. Traders should watch for a possible correction or consolidation phase.
Order Blocks
Identifying order blocks on the daily chart reveals significant buying activity around the 44,200 level, suggesting that this area may act as a strong support zone. Conversely, the area near 44,700 has shown selling pressure, indicating a potential resistance zone.
MACD Analysis
The Moving Average Convergence Divergence (MACD) indicator supports the bullish outlook, as the MACD line is above the signal line. However, traders should remain cautious of potential crossovers that could signal a trend reversal.