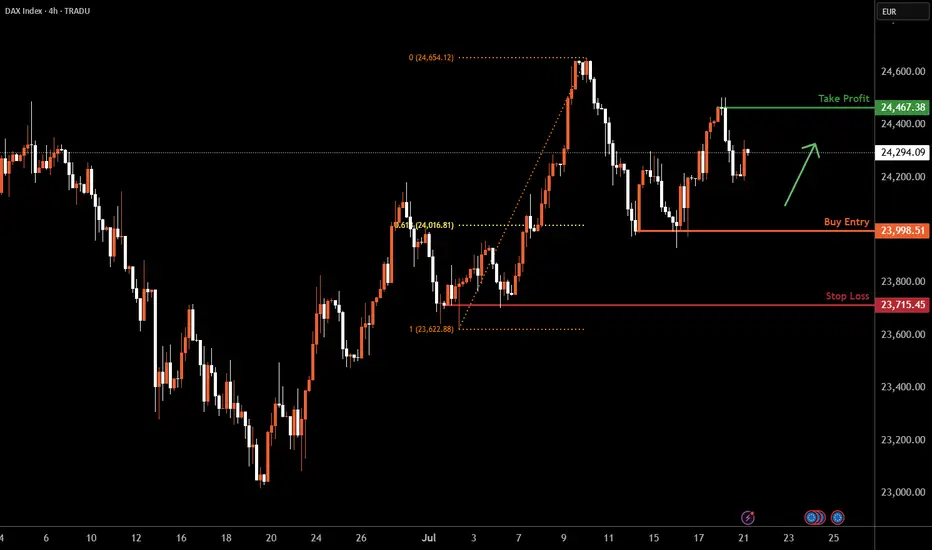
DAX H4 | Multi-swing-low support at 61.8% Fibonacci retracementThe DAX (GER30) is falling towards a multi-swing-low support and could potentially bounce off this level to climb higher.
Buy entry is at 23,998.51 which is a multi-swing-low support that aligns with the 61.8% Fibonacci retracement.
Stop loss is at 23,715.45 which is a swing-low support.
Take profit is at 24,467.38 which is a swing-high resistance.
High Risk Investment Warning
Trading Forex/CFDs on margin carries a high level of risk and may not be suitable for all investors. Leverage can work against you.
Stratos Markets Limited (tradu.com ):
CFDs are complex instruments and come with a high risk of losing money rapidly due to leverage. 66% of retail investor accounts lose money when trading CFDs with this provider. You should consider whether you understand how CFDs work and whether you can afford to take the high risk of losing your money.
Stratos Europe Ltd (tradu.com ):
CFDs are complex instruments and come with a high risk of losing money rapidly due to leverage. 66% of retail investor accounts lose money when trading CFDs with this provider. You should consider whether you understand how CFDs work and whether you can afford to take the high risk of losing your money.
Stratos Global LLC (tradu.com ):
Losses can exceed deposits.
Please be advised that the information presented on TradingView is provided to Tradu (‘Company’, ‘we’) by a third-party provider (‘TFA Global Pte Ltd’). Please be reminded that you are solely responsible for the trading decisions on your account. There is a very high degree of risk involved in trading. Any information and/or content is intended entirely for research, educational and informational purposes only and does not constitute investment or consultation advice or investment strategy. The information is not tailored to the investment needs of any specific person and therefore does not involve a consideration of any of the investment objectives, financial situation or needs of any viewer that may receive it. Kindly also note that past performance is not a reliable indicator of future results. Actual results may differ materially from those anticipated in forward-looking or past performance statements. We assume no liability as to the accuracy or completeness of any of the information and/or content provided herein and the Company cannot be held responsible for any omission, mistake nor for any loss or damage including without limitation to any loss of profit which may arise from reliance on any information supplied by TFA Global Pte Ltd.
The speaker(s) is neither an employee, agent nor representative of Tradu and is therefore acting independently. The opinions given are their own, constitute general market commentary, and do not constitute the opinion or advice of Tradu or any form of personal or investment advice. Tradu neither endorses nor guarantees offerings of third-party speakers, nor is Tradu responsible for the content, veracity or opinions of third-party speakers, presenters or participants.
GER40 trade ideas
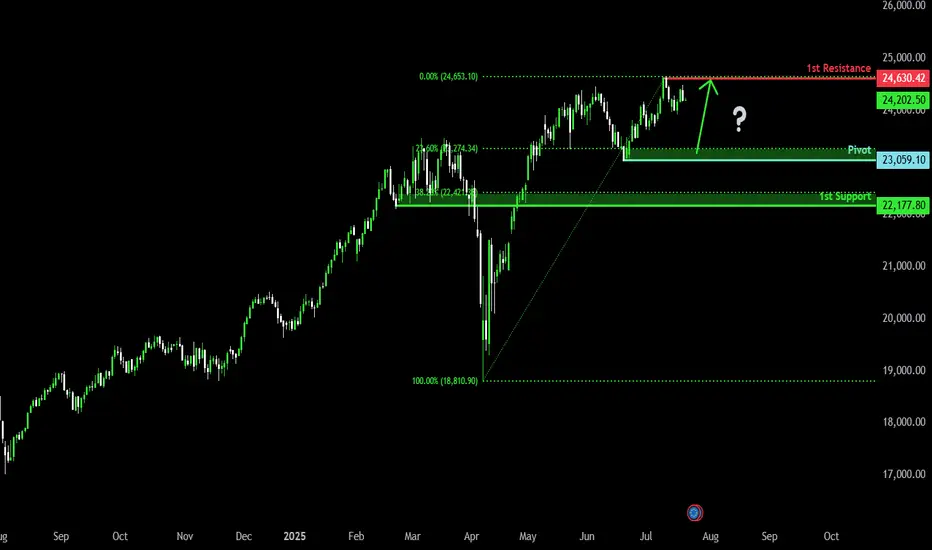
Bullish momentum to extend?DAX40 (DE40) is falling towards the pivot which has been identified as a pullback support and could bounce to the pullback resistance.
Pivot: 23,059.10
1st Support: 22,177.80
1st Resistance: 24,630.42
Risk Warning:
Trading Forex and CFDs carries a high level of risk to your capital and you should only trade with money you can afford to lose. Trading Forex and CFDs may not be suitable for all investors, so please ensure that you fully understand the risks involved and seek independent advice if necessary.
Disclaimer:
The above opinions given constitute general market commentary, and do not constitute the opinion or advice of IC Markets or any form of personal or investment advice.
Any opinions, news, research, analyses, prices, other information, or links to third-party sites contained on this website are provided on an "as-is" basis, are intended only to be informative, is not an advice nor a recommendation, nor research, or a record of our trading prices, or an offer of, or solicitation for a transaction in any financial instrument and thus should not be treated as such. The information provided does not involve any specific investment objectives, financial situation and needs of any specific person who may receive it. Please be aware, that past performance is not a reliable indicator of future performance and/or results. Past Performance or Forward-looking scenarios based upon the reasonable beliefs of the third-party provider are not a guarantee of future performance. Actual results may differ materially from those anticipated in forward-looking or past performance statements. IC Markets makes no representation or warranty and assumes no liability as to the accuracy or completeness of the information provided, nor any loss arising from any investment based on a recommendation, forecast or any information supplied by any third-party.
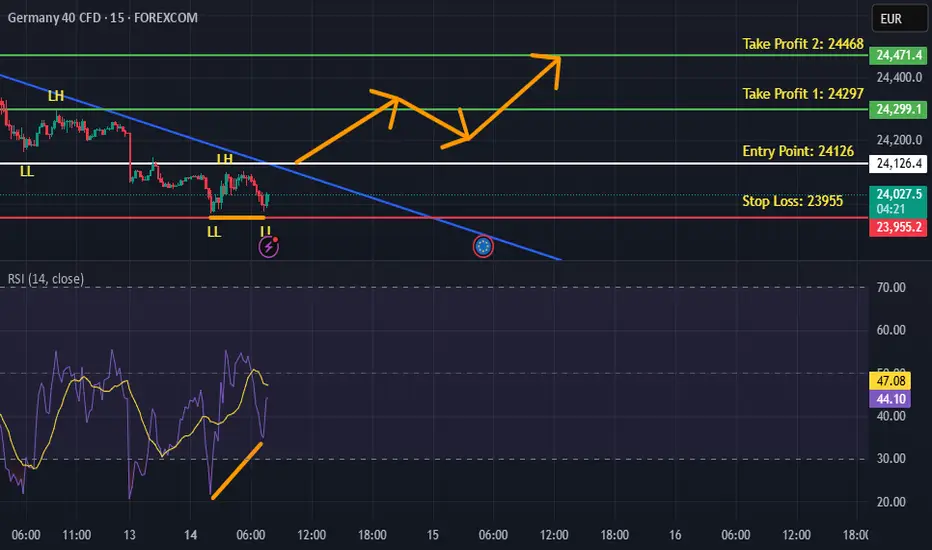
How To Trade A Bullish 2618 Setup on the GER40A walkthrough of the 2618 Trading Strategy which is a secondary or more conservative way to enter a double top/bottom. In this case, due to the overall directional analysis of the Dax, this also might be a good opportunity to hop on a pullback for a larger bullish trend continuation trade.
2618 RULES
Step 1 - Look for double top or double bottom.
Step 2 - Wait for violation of peak.
Step 3 - Look for pullback into a minimum 61.8 Fibonacci retracement.
Hope you guys have a great week of trading and remember to let me know which profit target method you think you would go with.
Akil

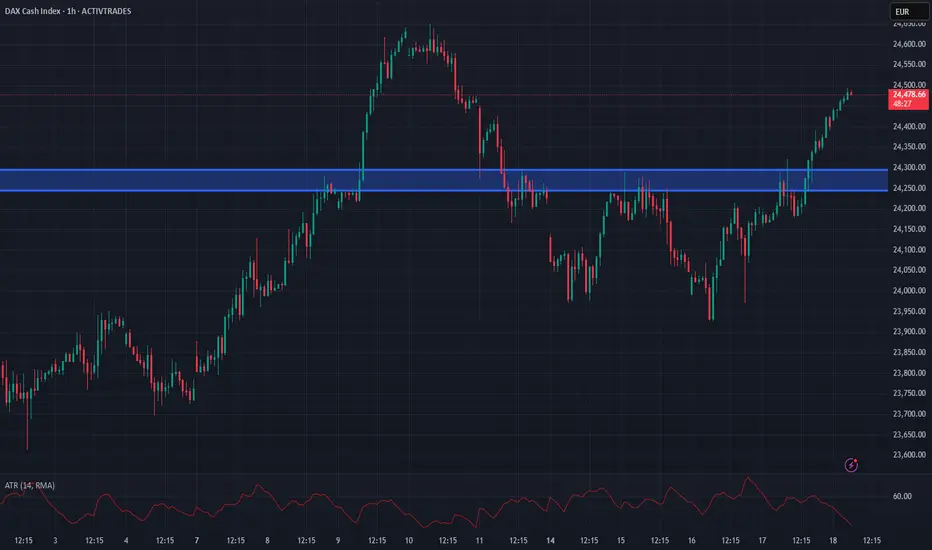
Dax Breaks Higher to keep the bullish toneDax has moved back above the 24245-24295 zone impulsively and we retain the overall bullish tone
Retests of this area can provide an opportunity to get long
Stops need to be below 24170
Targets can be back towards 24400 and even hold a runner back to the All time highs
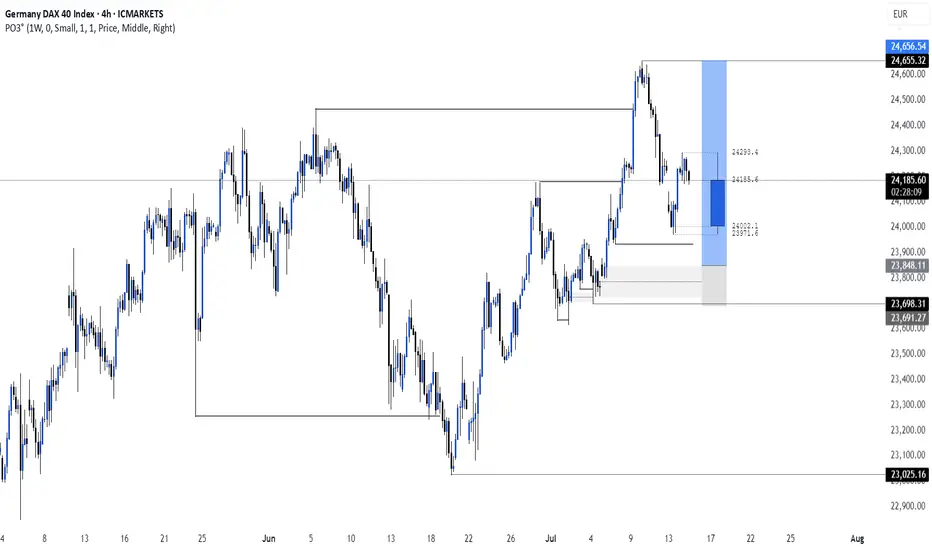
DE40 HTF DistributionI'm watching the DE40 closely here. It's putting in distribution over distribution, which simultaneously leads to the creation of a potential higher time frame distribution model. There are many other indices with a similar behaviour, but this one looks the cleanest so far. I'm waiting for invalidations/confirmations at the POI's.
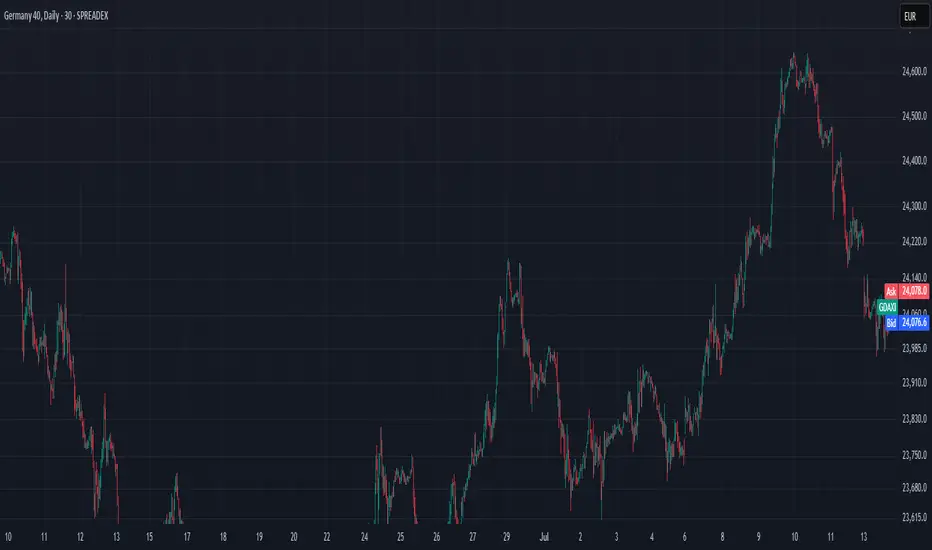
Germany 40 – Preparing For A Short Term Range BreakoutTariff worries, including new comments from President Trump stating that he is likely to impose fresh import charges on pharmaceuticals, have continued to dominate the thinking of Germany 40 traders this week. This has lead to some choppy price action for the index, which after opening on Monday at 24140, has bounced between a Tuesday high of 24293 and a Wednesday low of 23923, before settling back into the middle of that range.
Throw into the mix, the start of Q2 earnings season for European corporates and an upcoming ECB interest rate decision in a week's time and you can see how price action could become increasingly volatile moving forward into the end of July.
Earnings season has so far got off to a slow start in Europe and Germany 40 traders may have to wait until SAP, the company carrying the highest market capitalisation ($352 billion) and index weighting (14.5%), reports its results next Tuesday (after the close) for further insight into where prices may move next.
In terms of the ECB rate decision next Thursday (July 24th), market expectations may currently be indicating that another rate cut is unlikely, although it could be a close call. Traders seem to be focusing on recent commentary from policymakers which suggests the balance of power for the time being has shifted to the more hawkish committee members, who have stated that with inflation sitting on the central bank's target of 2% there is no need to cut rates further. Choosing instead to wait for more clarity on the outcome of trade negotiations with the US, which could decide whether a trade war between the world's first and third biggest economies may be something they need to navigate.
Technical Update: Assessing Current Pirce Action
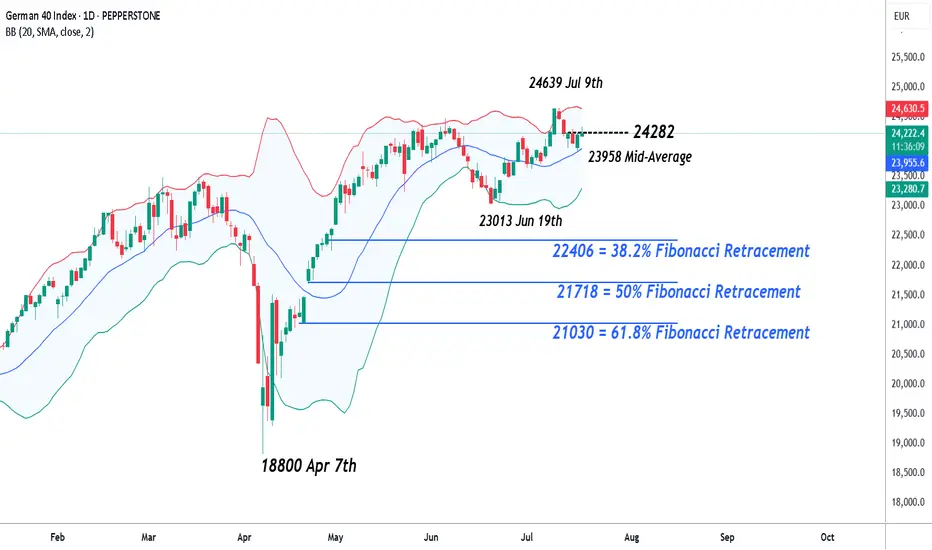
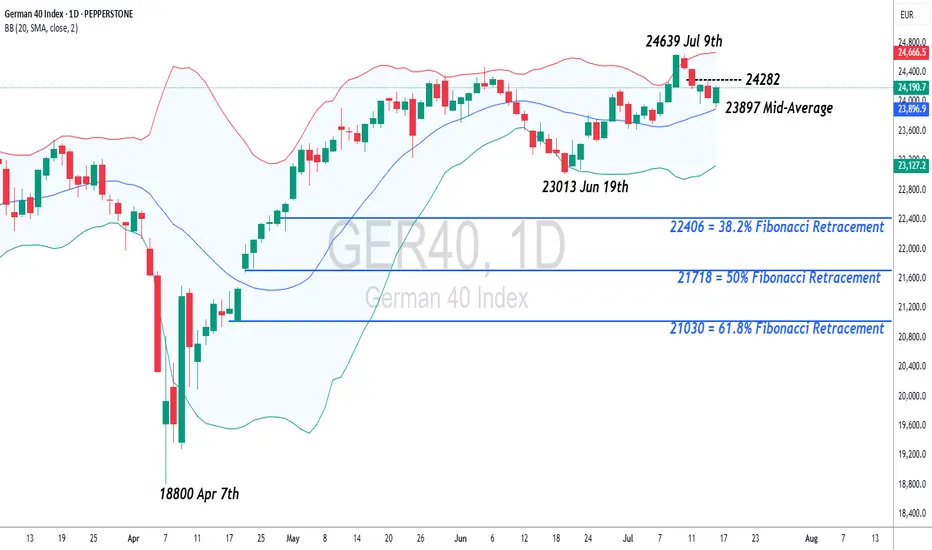
Having posted a new all-time high at 24639 on July 9th the Germany 40 index has entered a corrective period in price. However, while much will depend on future market sentiment and price trends, traders may well be asking, whether current price declines can develop into a more extended phase of weakness, or if the downside move could be limited as buyers return once again.
Time will tell, but in the meantime, technical analysis may help pinpoint potential support and resistance levels which can aid traders in establishing the next possible trends and directional risks.
Potential Support Levels:
Having recently posted a new all-time high at 24639, it might be argued this is still a positive price trend, especially as the Bollinger mid-average is currently rising. The mid-average stands at 23954, so may mark the first support focus for traders over coming sessions.
However, if closing breaks of this 23954 level materialise, it might lead towards a further phase of price weakness towards 23013, the June 19th session low, even 22406, which is the 38.2% Fibonacci retracement of April to July 2025 price strength.
Potential Resistance Levels:
If the 23954 mid-average successfully holds the current price setback, it could prompt further attempts to extend recent strength.
The first resistance might then stand at 24282, which is equal to half of the latest weakness, with successful closing breaks above this level possibly opening scope back to the 24639 all-time high and maybe further, if this in turn gives way.
The material provided here has not been prepared accordance with legal requirements designed to promote the independence of investment research and as such is considered to be a marketing communication. Whilst it is not subject to any prohibition on dealing ahead of the dissemination of investment research, we will not seek to take any advantage before providing it to our clients.
Pepperstone doesn’t represent that the material provided here is accurate, current or complete, and therefore shouldn’t be relied upon as such. The information, whether from a third party or not, isn’t to be considered as a recommendation; or an offer to buy or sell; or the solicitation of an offer to buy or sell any security, financial product or instrument; or to participate in any particular trading strategy. It does not take into account readers’ financial situation or investment objectives. We advise any readers of this content to seek their own advice. Without the approval of Pepperstone, reproduction or redistribution of this information isn’t permitted.
Germany 40 – Preparing For A Short Term Range BreakoutTariff worries, including new comments from President Trump stating that he is likely to impose fresh import charges on pharmaceuticals, have continued to dominate the thinking of Germany 40 traders this week. This has lead to some choppy price action for the index, which after opening on Monday at 24140, has bounced between a Tuesday high of 24293 and a Wednesday low of 23923, before settling back into the middle of that range.
Throw into the mix, the start of Q2 earnings season for European corporates and an upcoming ECB interest rate decision in a week's time and you can see how price action could become increasingly volatile moving forward into the end of July.
Earnings season has so far got off to a slow start in Europe and Germany 40 traders may have to wait until SAP, the company carrying the highest market capitalisation ($352 billion) and index weighting (14.5%), reports its results next Tuesday (after the close) for further insight into where prices may move next.
In terms of the ECB rate decision next Thursday (July 24th), market expectations may currently be indicating that another rate cut is unlikely, although it could be a close call. Traders seem to be focusing on recent commentary from policymakers which suggests the balance of power for the time being has shifted to the more hawkish committee members, who have stated that with inflation sitting on the central bank's target of 2% there is no need to cut rates further. Choosing instead to wait for more clarity on the outcome of trade negotiations with the US, which could decide whether a trade war between the world's first and third biggest economies may be something they need to navigate.
Technical Update: Assessing Current Pirce Action
Having posted a new all-time high at 24639 on July 9th the Germany 40 index has entered a corrective period in price. However, while much will depend on future market sentiment and price trends, traders may well be asking, whether current price declines can develop into a more extended phase of weakness, or if the downside move could be limited as buyers return once again.
Time will tell, but in the meantime, technical analysis may help pinpoint potential support and resistance levels which can aid traders in establishing the next possible trends and directional risks.
Potential Support Levels:
Having recently posted a new all-time high at 24639, it might be argued this is still a positive price trend, especially as the Bollinger mid-average is currently rising. The mid-average stands at 23954, so may mark the first support focus for traders over coming sessions.
However, if closing breaks of this 23954 level materialise, it might lead towards a further phase of price weakness towards 23013, the June 19th session low, even 22406, which is the 38.2% Fibonacci retracement of April to July 2025 price strength.
Potential Resistance Levels:
If the 23954 mid-average successfully holds the current price setback, it could prompt further attempts to extend recent strength.
The first resistance might then stand at 24282, which is equal to half of the latest weakness, with successful closing breaks above this level possibly opening scope back to the 24639 all-time high and maybe further, if this in turn gives way.
The material provided here has not been prepared accordance with legal requirements designed to promote the independence of investment research and as such is considered to be a marketing communication. Whilst it is not subject to any prohibition on dealing ahead of the dissemination of investment research, we will not seek to take any advantage before providing it to our clients.
Pepperstone doesn’t represent that the material provided here is accurate, current or complete, and therefore shouldn’t be relied upon as such. The information, whether from a third party or not, isn’t to be considered as a recommendation; or an offer to buy or sell; or the solicitation of an offer to buy or sell any security, financial product or instrument; or to participate in any particular trading strategy. It does not take into account readers’ financial situation or investment objectives. We advise any readers of this content to seek their own advice. Without the approval of Pepperstone, reproduction or redistribution of this information isn’t permitted.
Germany 40 – Preparing For A Short Term Range BreakoutTariff worries, including new comments from President Trump stating that he is likely to impose fresh import charges on pharmaceuticals, have continued to dominate the thinking of Germany 40 traders this week, leading to some choppy price action for the index, which after opening on Monday at 24084, has bounced between a Tuesday high of 24293 and a Wednesday low of 23925, before settling back into the middle of that range.
Throw into the mix, the start of Q2 earnings season for European corporates and an upcoming ECB interest rate decision in a week's time and you can see how price action could become increasingly volatile moving forward into the end of July.
Earnings season has so far got off to a slow start in Europe and Germany 40 traders may have to wait until SAP, the company carrying the highest market capitalisation ($352 billion) and index weighting (14.5%), reports its results next Tuesday (after the close) for further insight into where prices may move next.
In terms of the ECB rate decision next Thursday (July 24th), market expectations may currently be indicating that another rate cut is unlikely, although it could be a close call. Traders seem to be focusing on recent commentary from policymakers which suggests the balance of power for the time being has shifted to the more hawkish committee members, who have stated that with inflation sitting on the central bank's target of 2% there is no need to cut rates further. Choosing instead to wait for more clarity on the outcome of trade negotiations with the US, which could decide whether a trade war between the world's first and third biggest economies may be something they need to navigate.
Technical Update:
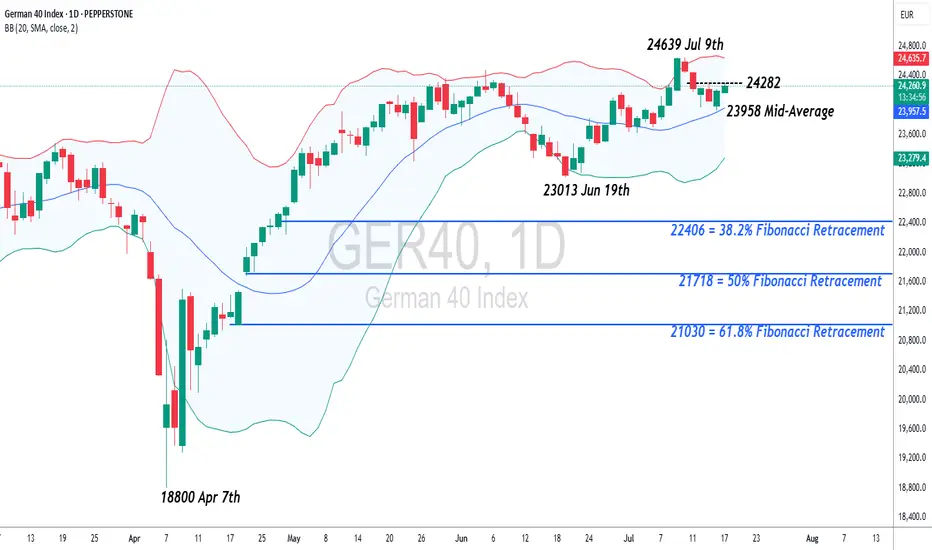
Having posted a new all-time high at 24639 on July 9th the German 40 index has entered a corrective period in price. However, while much will depend on future market sentiment and price trends, traders may well be asking, if current price declines can develop into a more extended phase of weakness, or if downside is just a limited move before buyers return to extend price strength.
Time will tell, but in the meantime, technical analysis may help pinpoint potential support and resistance levels, aiding in establishing next possible trends and directional risks.
Potential Support:
Having recently posted a new all-time high at 24639, it might be argued this is still a positive price trend, especially as the Bollinger mid-average is currently rising. This for Thursday stands at 23954, so may mark the first support focus for traders over coming sessions.
If closing breaks of this 23954 level materialise, it might lead towards a further phase of price weakness towards 23013, the June 19th session low, even 22406, the 38.2% Fibonacci retracement of April to July 2025 price strength.
Potential Resistance:
If the 23954 mid-average successfully holds the current price setback, it could possibly prompt further attempts to extend recent strength.
First resistance might then stand at 24282, equal to half latest weakness, with successful closing breaks possibly then opening scope back to the 24639 all-time high and maybe further, if this in turn gives way.
The material provided here has not been prepared accordance with legal requirements designed to promote the independence of investment research and as such is considered to be a marketing communication. Whilst it is not subject to any prohibition on dealing ahead of the dissemination of investment research, we will not seek to take any advantage before providing it to our clients.
Pepperstone doesn’t represent that the material provided here is accurate, current or complete, and therefore shouldn’t be relied upon as such. The information, whether from a third party or not, isn’t to be considered as a recommendation; or an offer to buy or sell; or the solicitation of an offer to buy or sell any security, financial product or instrument; or to participate in any particular trading strategy. It does not take into account readers’ financial situation or investment objectives. We advise any readers of this content to seek their own advice. Without the approval of Pepperstone, reproduction or redistribution of this information isn’t permitted.
Germany 40 – Preparing For A Short Term Range BreakoutTariff worries, including new comments from President Trump stating that he is likely to impose fresh import charges on pharmaceuticals, have continued to dominate the thinking of Germany 40 traders this week, leading to some choppy price action for the index, which after opening on Monday at 24084, has bounced between a Tuesday high of 24293 and a Wednesday low of 23925, before settling back into the middle of that range.
Throw into the mix, the start of Q2 earnings season for European corporates and an upcoming ECB interest rate decision in a week's time and you can see how price action could become increasingly volatile moving forward into the end of July.
Earnings season has so far got off to a slow start in Europe and Germany 40 traders may have to wait until SAP, the company carrying the highest market capitalisation ($352 billion) and index weighting (14.5%), reports its results next Tuesday (after the close) for further insight into where prices may move next.
In terms of the ECB rate decision next Thursday (July 24th), market expectations may currently be indicating that another rate cut is unlikely, although it could be a close call. Traders seem to be focusing on recent commentary from policymakers which suggests the balance of power for the time being has shifted to the more hawkish committee members, who have stated that with inflation sitting on the central bank's target of 2% there is no need to cut rates further. Choosing instead to wait for more clarity on the outcome of trade negotiations with the US, which could decide whether a trade war between the world's first and third biggest economies may be something they need to navigate.
Technical Update:
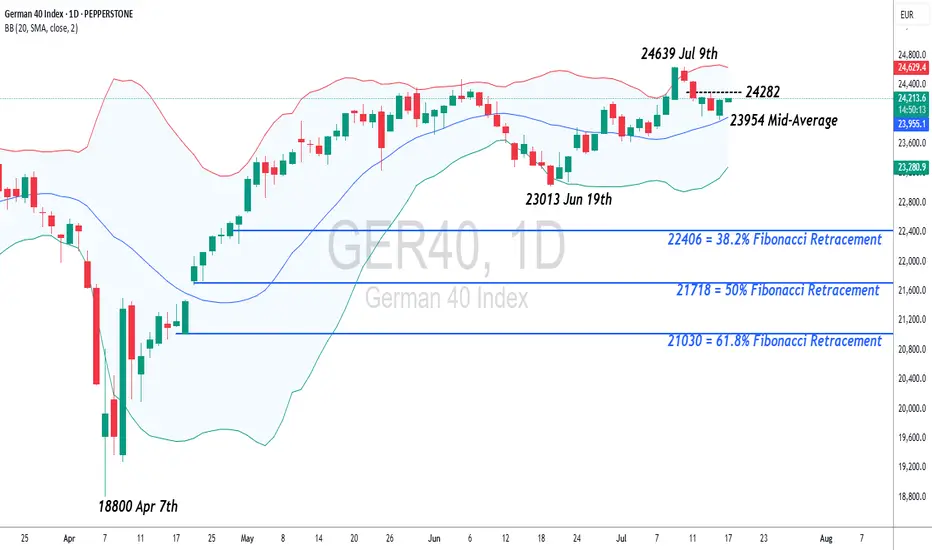
Having posted a new all-time high at 24639 on July 9th the German 40 index has entered a corrective period. However, while much will depend on future unknow market sentiment and price trends, traders may well be asking, if current price weakness can develop into a more extended phase of weakness, or if downside is just a limited move before buyers return to extend price strength.
Time will tell, but in the meantime, technical analysis may help pinpoint potential support and resistance levels, aiding us establish next potential trends and directional risks.
Potential Support:
Having recently posted a new all-time high at 24639, it might be argued this is still a possible positive trend, especially as the Bollinger mid-average is currently rising. This for Thursday stands at 23897, so may mark the first support focus for traders over coming sessions.
If closing breaks of this 23965 level materialise, it might lead towards a further phase of price weakness towards 23013, the June 19th session low, even 22406, the 38.2% Fibonacci retracement of April to July 2025 price strength.
Potential Resistance:
If the 23965 mid-average successfully holds the current price setback, it could possibly prompt further attempts to extend recent strength.
First resistance might then stand at 24282, equal to half latest weakness, with successful closing breaks possibly then opening scope back to the 24639 all-time high and maybe further, if this in turn gives way.
The material provided here has not been prepared accordance with legal requirements designed to promote the independence of investment research and as such is considered to be a marketing communication. Whilst it is not subject to any prohibition on dealing ahead of the dissemination of investment research, we will not seek to take any advantage before providing it to our clients.
Pepperstone doesn’t represent that the material provided here is accurate, current or complete, and therefore shouldn’t be relied upon as such. The information, whether from a third party or not, isn’t to be considered as a recommendation; or an offer to buy or sell; or the solicitation of an offer to buy or sell any security, financial product or instrument; or to participate in any particular trading strategy. It does not take into account readers’ financial situation or investment objectives. We advise any readers of this content to seek their own advice. Without the approval of Pepperstone, reproduction or redistribution of this information isn’t permitted.
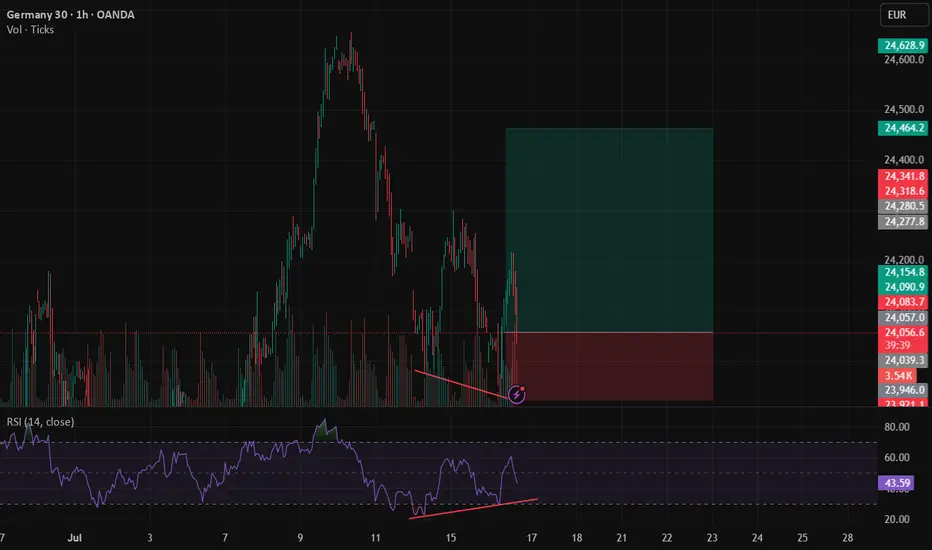
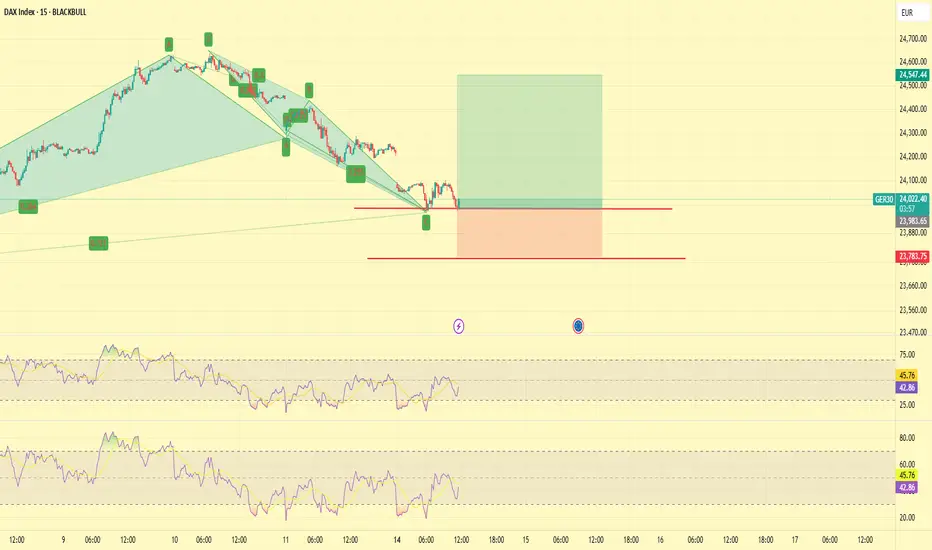
Double bottom Double bottom on the Dax with a RSI divergency. There's a good possibility the trend will resume from here.
DAX: Will Go Up! Long!
My dear friends,
Today we will analyse DAX together☺️
The recent price action suggests a shift in mid-term momentum. A break above the current local range around 24,193.45 will confirm the new direction upwards with the target being the next key level of 24,258.97 and a reconvened placement of a stop-loss beyond the range.
❤️Sending you lots of Love and Hugs❤️
ger30 long again trend on daily is bullish ,we have a level all we need s our entry patterns on the smaller time frames . waiting for mine
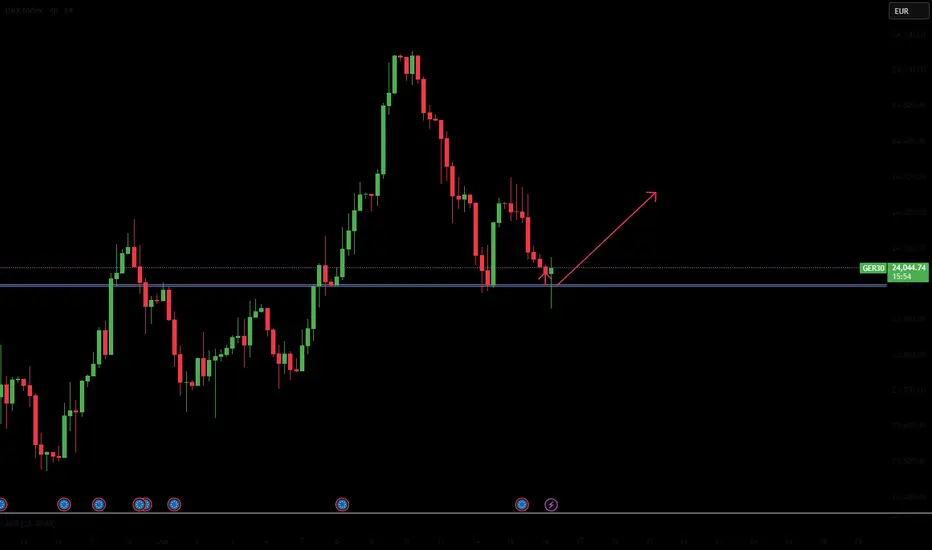
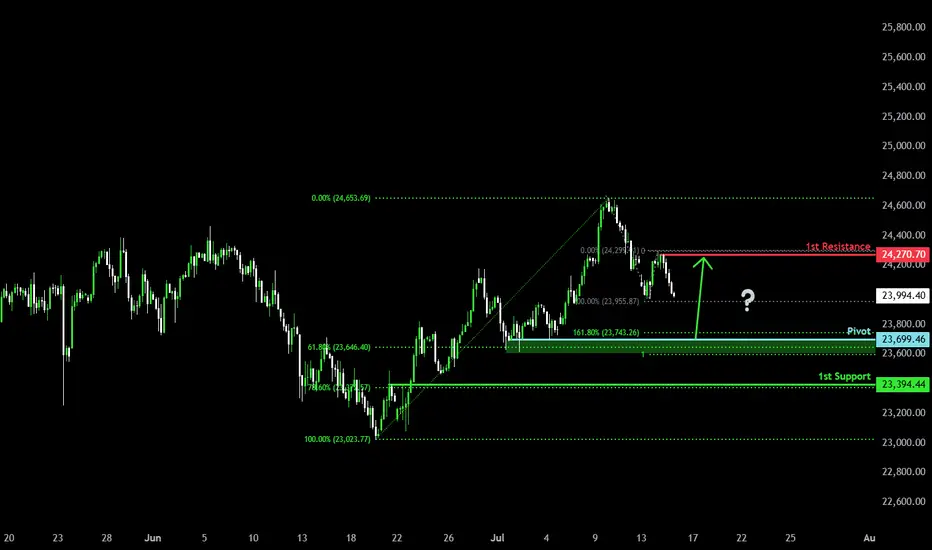
Falling towards Fibonacci confluence?DAX40 (DE40) is falling towards the pivot, which is a pullback support and could bounce to the pullback resistance.
Pivot: 23,699.46
1st Support: 23,394.44
1st Resistance: 24,270.70
Risk Warning:
Trading Forex and CFDs carries a high level of risk to your capital and you should only trade with money you can afford to lose. Trading Forex and CFDs may not be suitable for all investors, so please ensure that you fully understand the risks involved and seek independent advice if necessary.
Disclaimer:
The above opinions given constitute general market commentary, and do not constitute the opinion or advice of IC Markets or any form of personal or investment advice.
Any opinions, news, research, analyses, prices, other information, or links to third-party sites contained on this website are provided on an "as-is" basis, are intended only to be informative, is not an advice nor a recommendation, nor research, or a record of our trading prices, or an offer of, or solicitation for a transaction in any financial instrument and thus should not be treated as such. The information provided does not involve any specific investment objectives, financial situation and needs of any specific person who may receive it. Please be aware, that past performance is not a reliable indicator of future performance and/or results. Past Performance or Forward-looking scenarios based upon the reasonable beliefs of the third-party provider are not a guarantee of future performance. Actual results may differ materially from those anticipated in forward-looking or past performance statements. IC Markets makes no representation or warranty and assumes no liability as to the accuracy or completeness of the information provided, nor any loss arising from any investment based on a recommendation, forecast or any information supplied by any third-party.
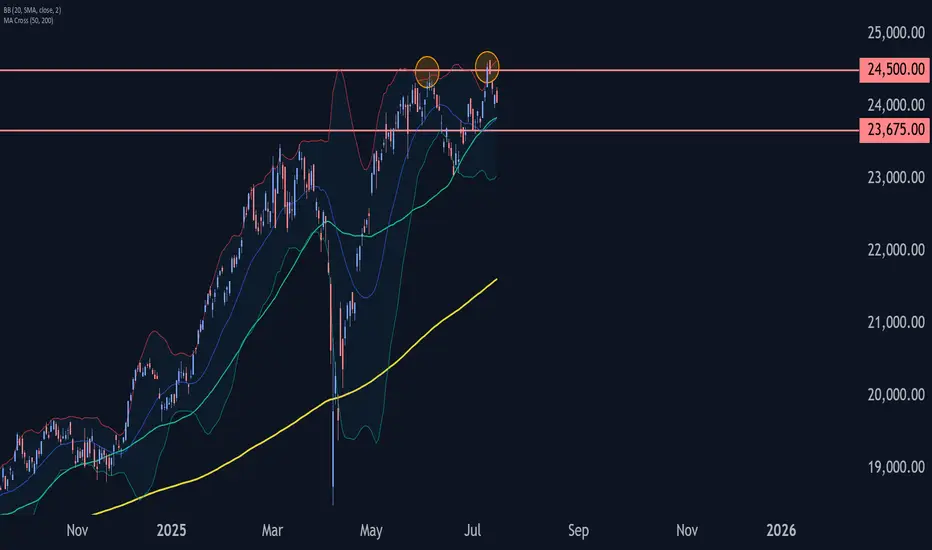
DAX Wave Analysis – 15 July 2025
- DAX reversed from the resistance area
- Likely to fall to support level 23675.00.
DAX index recently reversed down the resistance area between the pivotal resistance level 24500.00 (former top of wave 3 from June) and the upper daily Bollinger Band.
The downward reversal from this resistance zone stopped the earlier short-term ABC correction B.
Given the strength of the resistance level 24500.00, DAX index can be expected to fall further to the next support level 23675.00.
buy projectionBullish structure(high,low,irl).
Liquidity: sweep and inducement
Point of interest: orderblock
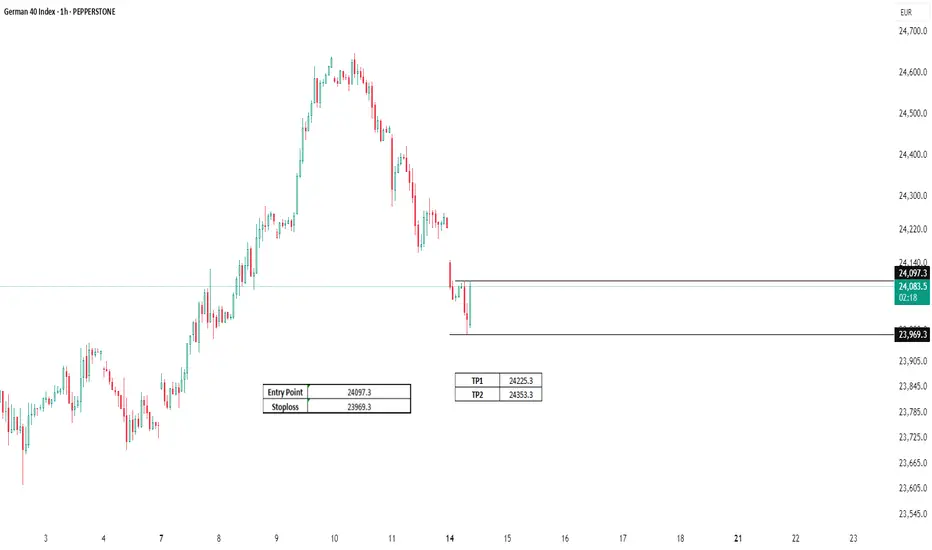
DAX corrective pullback supported at 24085The DAX remains in a bullish trend, with recent price action showing signs of a resistance breakout within the broader uptrend.
Support Zone: 24085 – a key level from previous consolidation. Price is currently testing or approaching this level.
A bullish rebound from 24085 would confirm ongoing upside momentum, with potential targets at:
24650 – initial resistance
24880 – psychological and structural level
25000 – extended resistance on the longer-term chart
Bearish Scenario:
A confirmed break and daily close below 24085 would weaken the bullish outlook and suggest deeper downside risk toward:
23970 – minor support
23800 – stronger support and potential demand zone
Outlook:
Bullish bias remains intact while the DAX holds above 24085. A sustained break below this level could shift momentum to the downside in the short term.
This communication is for informational purposes only and should not be viewed as any form of recommendation as to a particular course of action or as investment advice. It is not intended as an offer or solicitation for the purchase or sale of any financial instrument or as an official confirmation of any transaction. Opinions, estimates and assumptions expressed herein are made as of the date of this communication and are subject to change without notice. This communication has been prepared based upon information, including market prices, data and other information, believed to be reliable; however, Trade Nation does not warrant its completeness or accuracy. All market prices and market data contained in or attached to this communication are indicative and subject to change without notice.

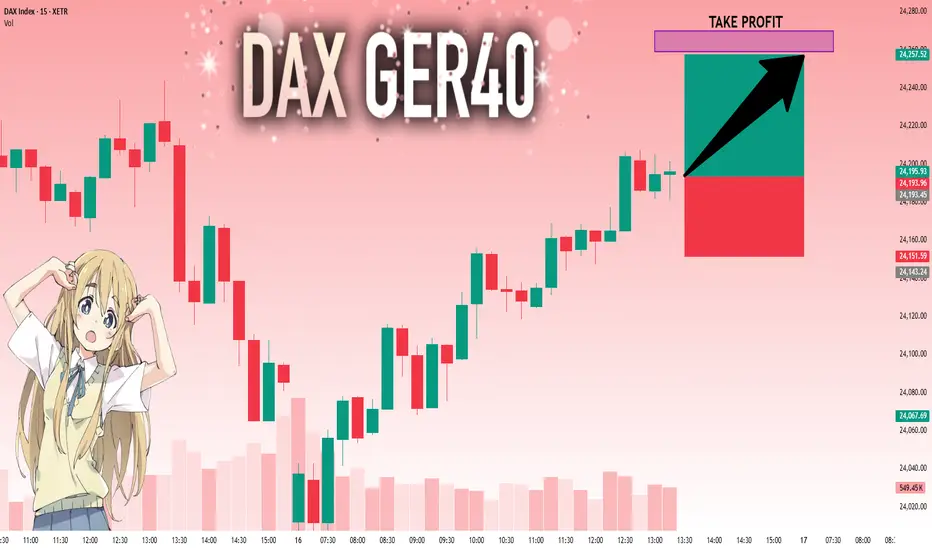
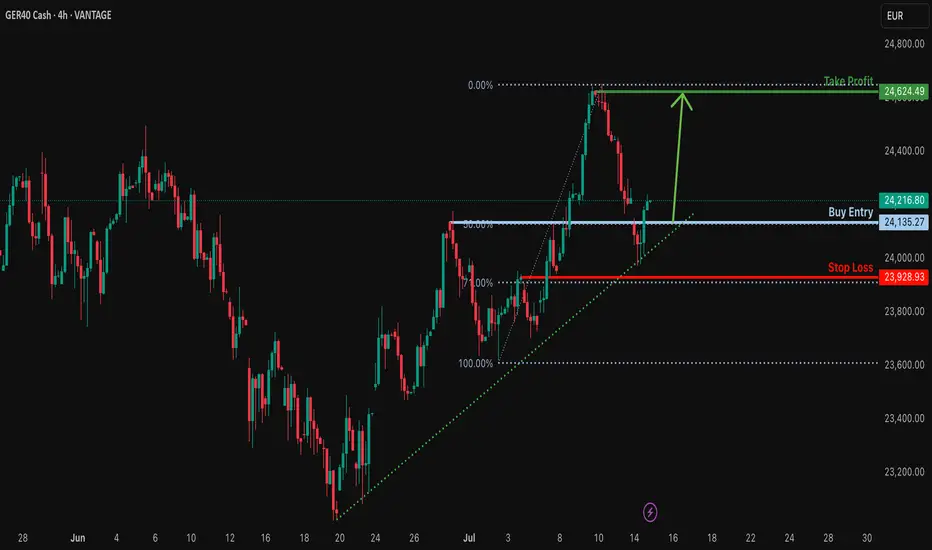
Bullish rise?GER40 has reacted off the support level which lines up with the 50% Fibonacci retracement and could potentially rise from this level to our take profit.
Entry: 24,135.27
Why we like it:
There is a pullback support that lines up with the 50% Fibonacci retracement.
Stop loss: 23,928.93
Why we like it:
There is a pullback support that aligns with the 71% Fibonacci retracement.
Take profit: 24,624.49
Why we like it:
There is a pullback resistance.
Enjoying your TradingView experience? Review us!
Please be advised that the information presented on TradingView is provided to Vantage (‘Vantage Global Limited’, ‘we’) by a third-party provider (‘Everest Fortune Group’). Please be reminded that you are solely responsible for the trading decisions on your account. There is a very high degree of risk involved in trading. Any information and/or content is intended entirely for research, educational and informational purposes only and does not constitute investment or consultation advice or investment strategy. The information is not tailored to the investment needs of any specific person and therefore does not involve a consideration of any of the investment objectives, financial situation or needs of any viewer that may receive it. Kindly also note that past performance is not a reliable indicator of future results. Actual results may differ materially from those anticipated in forward-looking or past performance statements. We assume no liability as to the accuracy or completeness of any of the information and/or content provided herein and the Company cannot be held responsible for any omission, mistake nor for any loss or damage including without limitation to any loss of profit which may arise from reliance on any information supplied by Everest Fortune Group.
Technical Weekly AnalysisGermany 40 remains in a bullish trend but is currently undergoing a pullback phase. It is trading at 24,080, nearly matching its VWAP of 24,079. The RSI at 53 suggests moderate momentum. Support lies at 23,245, with resistance at 24,590.
The UK 100 continues its new bullish trend into all-time highs and is currently in an impulsive phase. With price at 8,962 above the VWAP of 8,813, it shows strong momentum. The RSI at 63 supports this outlook. Support stands at 8,652 and resistance is at 9,000.
Wall Street remains bullish but is in a pullback phase, trading at 44,192, slightly above the VWAP of 43,871. The RSI at 58 points to sustained buying interest. Support is at 42,404 and resistance is at 45,338.
Brent Crude is in a neutral trend within a ranging phase, trading at 7,058 just above the VWAP of 6,892. The RSI at 55 reflects a balanced market. Support is at 6,402, with resistance at 7,382.
Gold is also in a neutral trend and consolidating in a range. It is priced at 3,371, near its VWAP of 3,329. The RSI at 56 indicates mild bullish interest. Support sits at 3,269 and resistance is at 3,390.
EUR/USD maintains a bullish trend but is currently in a pullback phase. Trading at 1.1683, it is nearly aligned with the VWAP of 1.1690. The RSI at 55 indicates moderate strength. Support is at 1.1542 and resistance is at 1.1853.
GBP/USD is in a bullish trend but undergoing a correction. With price at 1.3485 below the VWAP of 1.3609, momentum appears to be easing. The RSI at 39 supports this softer tone. Support is at 1.3424 and resistance at 1.3793.
USD/JPY is testing the top of its sideways range. Currently at 147.33, it is above the VWAP of 145.41. The RSI at 64 suggests a potential new bullish phase is beginning. Support is at 142.91 and resistance at 147.92.
GER40 is BullishPrice was in a downtrend, however the bullish divergence with a double bottom reversal formation hints the return of bulls. If previous lower high is broken along with the descending trendline, then we can expect a bullish reversal as per Dow theory. Targets are mentioned on the chart.
GER40 LongThere are multiple pattenrs on both H1 and M15
This is hitting target 2 of a short on H4
There is a lot of support at the level 24000
All timeframes are oversold with divergence
This is in a strong upward trend
Stop loss of 100 pips
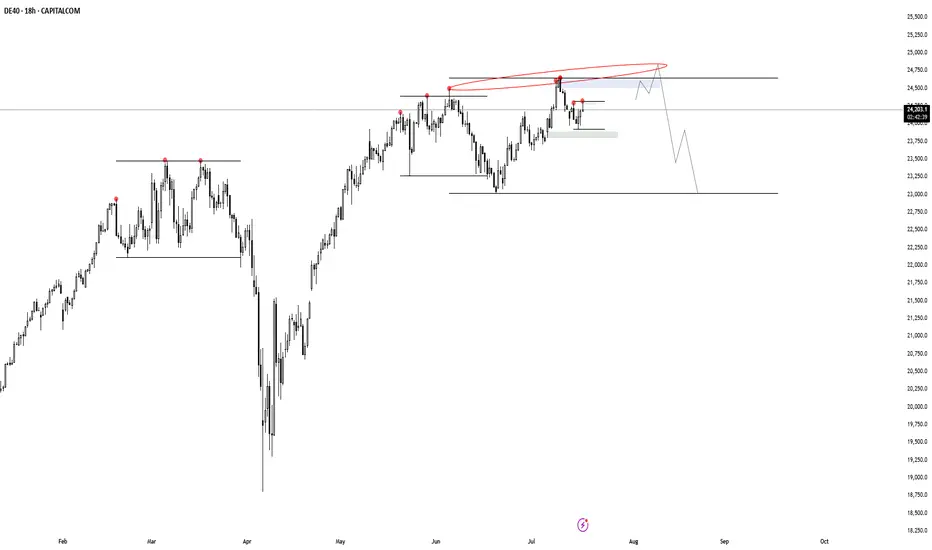
DAX Stock Index Declines Amid Trump Tariff ThreatDAX Stock Index Declines Amid Trump Tariff Threat
The German stock index DAX 40 (Germany 40 mini at FXOpen) is showing bearish momentum at the start of the week. This may be driven by a combination of factors, the most significant of which is the threat of tariffs on Europe from the United States.
According to Reuters, US President Donald Trump has announced a 30% tariff on most goods from the EU, set to come into effect next month. However, the decision is not yet final. Analysts caution against premature panic, suggesting that negotiations could still result in a trade agreement — nonetheless, the chart reflects a sense of unease among investors.
Technical Analysis of the DAX 40 Chart
The price surge in July above the previous all-time high near the 24,500 level appears to be a false bullish breakout — a sign of market weakness.
Buyers may hope that the market will find support at the former resistance line (marked in red), drawn through the local highs of June.
However, if news surrounding the US–EU negotiations turns negative, the DAX 40 index could fall towards the 23,650–23,750 support area, which is reinforced by the lower boundary of the medium-term ascending channel.
This article represents the opinion of the Companies operating under the FXOpen brand only. It is not to be construed as an offer, solicitation, or recommendation with respect to products and services provided by the Companies operating under the FXOpen brand, nor is it to be considered financial advice.

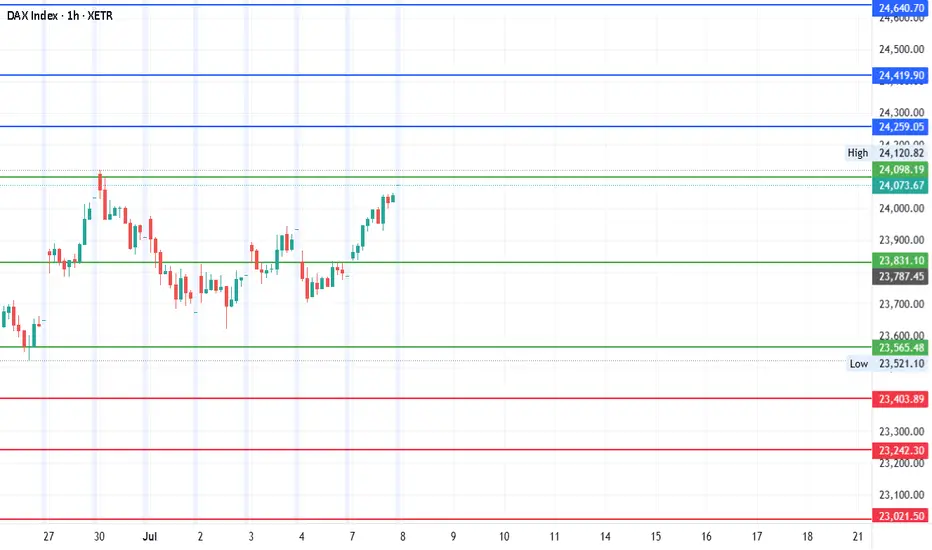
#DAX - 24640.70 or 23021.50 ?Date: 01-07-2025
#DAX Current Price: 24073
Pivot Point: 23831.10 Support: 23565.48 Resistance: 24098.19
#DAX Upside Targets:
Target 1: 24259.05
Target 2: 24419.90
Target 3: 24640.70
#DAX Downside Targets:
Target 1: 23403.89
Target 2: 23242.30
Target 3: 23021.50