NASDAQ Still failing to secure meaningful closes above the rangeAll explained in video. Please let me know if there is anything I may have missed in this analysis.
Thanks and share with anyone who may be interested 🔓
NAS100 trade ideas

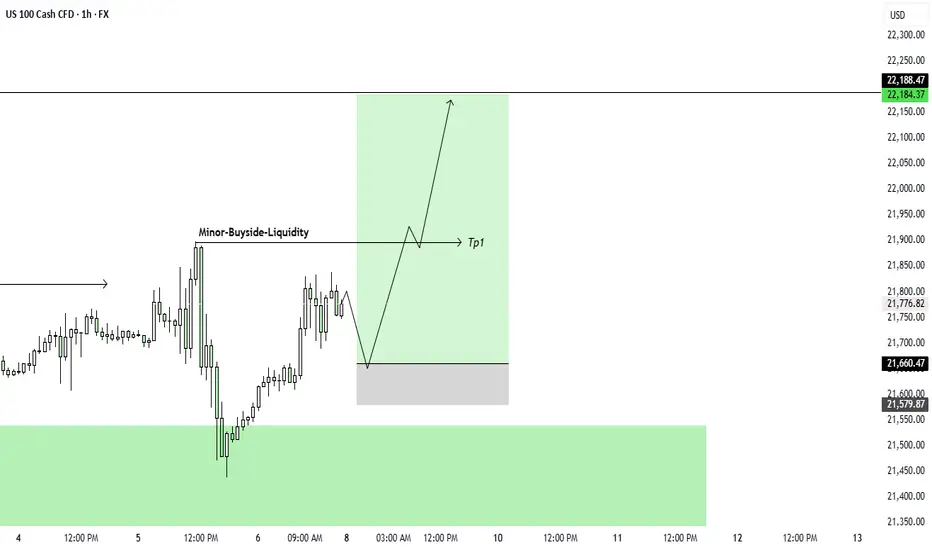
NAS100 Range Low Entry Aligned With TrendNAS100 is stuck mid-range on the 4H — neither pushing up nor breaking down. This idea plays it safe: placing a long at the bottom of the range, aligned with the overall bullish trend. If the channel holds, this may never trigger — but if it does, we ride it to the highs.

NQ tumbles?Good day traders, I don't know why but I get a bit scared when it comes to analyzing NQ. I always doubt myself with it.
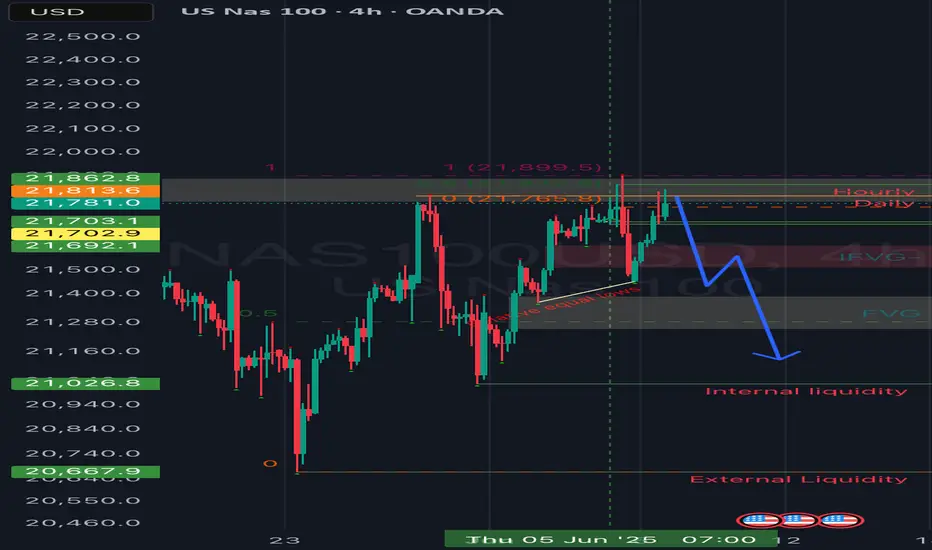
On the weekly TF price is trading inside an order block and for the past two weeks price has visited the order block two times. In the two times that price revisited the order block it failed to close above the midpoint indicating the strength of the order block, going into the new week I am going to use the discount zone of the OB+ as my resistance.
On the daily TF before I say much, THERE IS A GAP, and price did not trade to it since opening high on the 12th May. That gap is my target and I want to see price go and fill that volume imbalance as ICT calls it.
Still on the daily TF...when you read price for past two weeks on NQ, you'll quickly come to a realization that price has been expanding higher since Tuesday 3rd June, but expanding to where?...well liquidity resting above the high of the candle booked on the 29th of May.
Now on the 4 hour TF things are opening up and price is becoming clearer and it goes to show the importance of multi time frame analysis. The lows of Tuesday and Thursday make the relative equal lows that are shown on the chart. The internal liquidity shown below is my short term target or TP1. The red triangle represents that 4H inverse FVG and once price is trading below the inverse any movement inside that inverse should show weakness!
US100Hey traders ,Here is US30 1H Analysis for tomorrow
This is only my personal analysis
Buy / Sell at your own risk
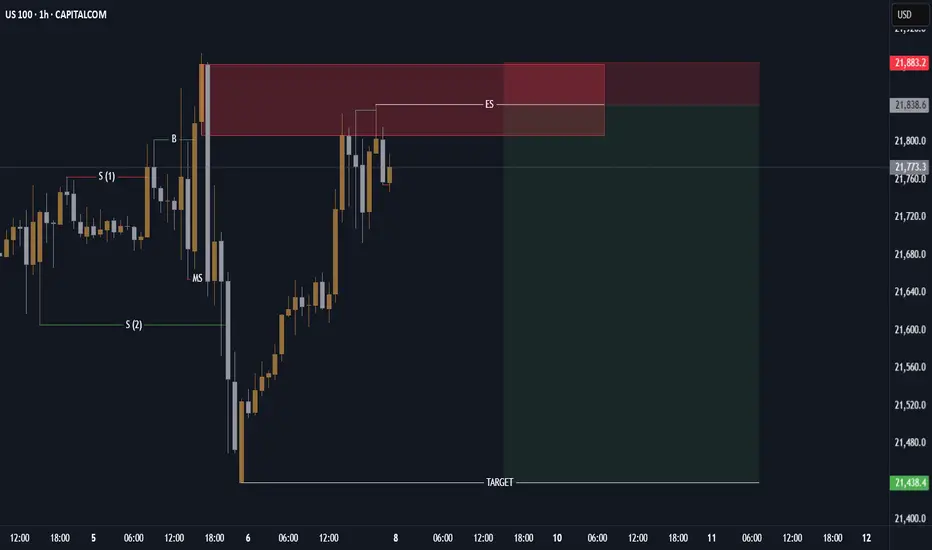
US100 (NASDAQ)🔍 Short-Term Outlook (Next Few Days)
✅ Structure Highlights:
Market recently made a Higher High (HH).
Strong bullish BOS occurred after reclaiming the $21,600 zone.
Currently trading inside the brown supply zone (Area of Interest) between $21,775–$21,839.
0.236 Fibonacci retracement is holding as support — a sign of bullish control.
🟢 Short-Term Bullish Signals:
Strong bullish momentum with higher lows and internal BOSs.
If price breaks and holds above $21,839, the market may rally toward:
Target 1: $22,000
Target 2: $22,150 (psychological level)
⚠️ Short-Term Bearish Scenario:
If price gets rejected from the current supply zone:
Pullback expected toward $21,670 (0.382) or $21,597 (0.5 Fib)
Further dip to $21,500–$21,400 is possible if buyers fail to hold structure
📉 Short-Term Bias: Bullish with a possible pullback
Enter long on pullback to 0.382–0.5 Fib with bullish confirmation
Avoid fresh longs if price shows strong rejection at $21,839
📈 Long-Term Outlook (1–4 Weeks)
🧠 Macro Trend:
Consistent bullish structure from below $19,000 in early May
Every correction has been shallow with strong continuation
As long as $21,400–$21,200 holds, macro trend remains bullish
📊 Long-Term Fib Zones:
0.5–0.618 retracement (strong accumulation zone) = $21,400–$21,250
Last confirmed Higher Low (HL) at ~$21,000, structure break below this = trend invalidation
💡 Long-Term Bias: Strong Bullish
Any correction into the green AOI or Fib zone = potential long opportunity
Next upside expansions could target:
$22,500
$23,000

NASDAQ100 TRADES AT HIGH!! POSSIBLE DECLINE IS EXPECTEDPrice experiences a resistance around the 21773 level. Technically, I anticipate a decline from that price level. a sell opportunity i envisaged if we begin to see seller step in the markket.

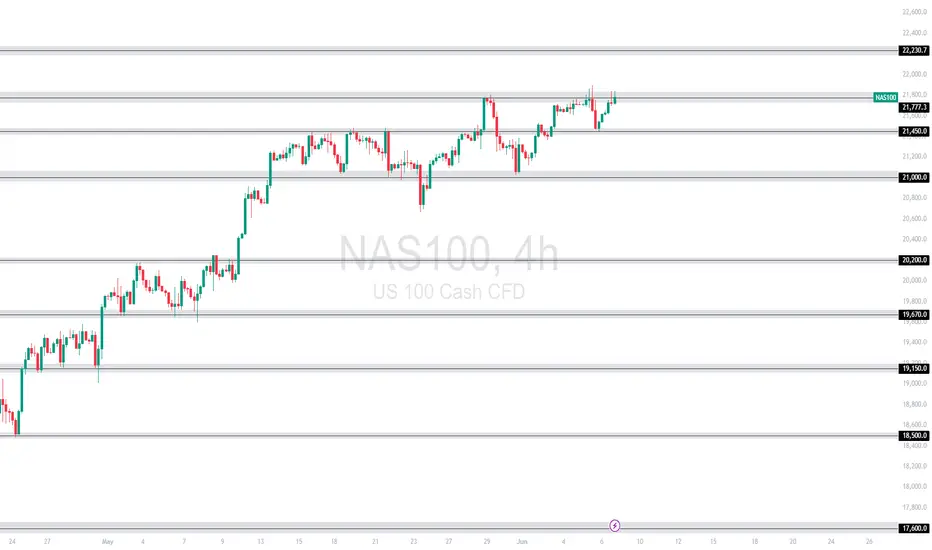
NAS100 [Consolidating ] – Will It Break Higher or Pull Back?The NAS100 has maintained a bullish structure and is currently pressing against the resistance zone around 21,777.3. This area has acted as a ceiling several times in recent sessions. Price is showing consolidation just below resistance, suggesting either an imminent breakout or another rejection.
Currently trading at 21,777.3, with
Support at: 21,450.0 🔽
Resistance at: 22,230.7 🔼
🔎 Bias:
🔼 Bullish: A strong break and hold above 21,777.3 may drive price toward the next resistance at 22,230.7.
🔽 Bearish: Rejection from 21,777.3 could lead to a retracement toward 21,450.0, with deeper downside potential if that level fails.
📛 Disclaimer: This is not financial advice. Trade at your own risk.
NASDAQBearish structure has formed, Waiting for further confirmation before looking for short positions.
SolarFX
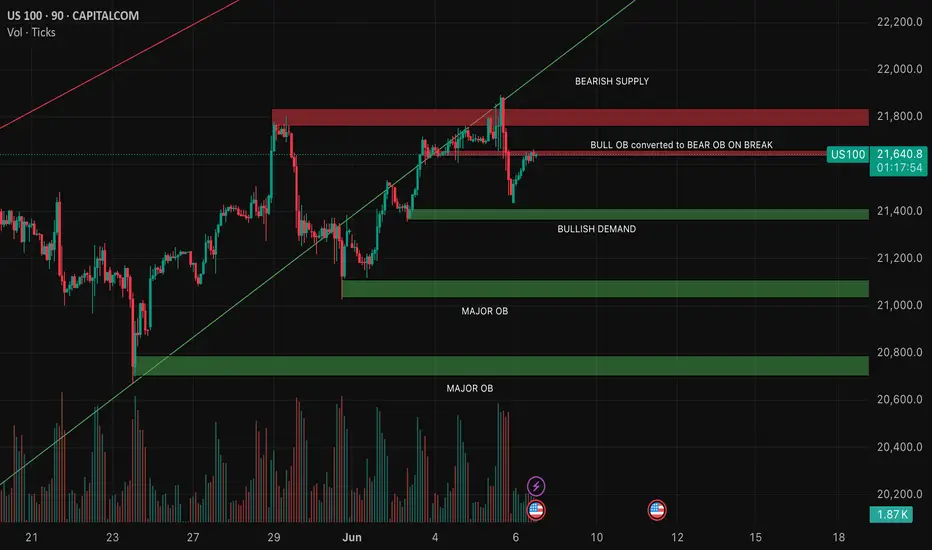
NAS100 Technical Analysis – Bearish Rejection at ResistanceNAS100 Technical Analysis – Bearish Rejection at Resistance 🚨
📅 Date: June 6, 2025
📈 Instrument: NAS100 (US Tech 100 Index)
🔍 Chart Overview:
The price action shows a clear rejection from the 21,800 USD resistance zone, marked by two strong bearish wicks (indicated by red arrows 🔴). This level has proven to be a strong supply zone, as sellers repeatedly step in to push prices lower.
🔵 Key Zones:
🔺 Resistance Zone: 21,750 – 21,800 USD
✅ Multiple rejections and bearish pressure.
🔻 Support Zone 1: 21,100 – 21,200 USD
📍 Acts as a mid-range demand zone and a potential take-profit level for short positions.
📉 Support Zone 2 (Major): 20,700 – 20,850 USD
📦 High-probability bounce area due to historical demand.
🔄 Price Action Insight:
The chart outlines a bearish double rejection pattern at the resistance level.
The current candlestick setup suggests bearish momentum, with a potential drop toward the mid-support zone.
If the price breaks below the mid-support, it could cascade down toward the major support near 20,800 USD.
📌 Projected Move:
🔻 From current levels (~21,750), expect:
Pullback from resistance,
Target 1️⃣: 21,100 USD zone,
Target 2️⃣: 20,800 USD major support.
🚫 A clean break and close above 21,800 invalidates the bearish outlook and may trigger a bullish continuation.
✅ Conclusion:
The chart favors a short bias below the resistance zone. Patience is key—wait for confirmation (like a bearish engulfing or break of structure 📉) before entering positions.
📊 Always use risk management. Set stop-loss above resistance in case of reversal.

US100 Weekly: Bullish Pullback or Breakdown at 21,000?
US100 – Weekly Technical Outlook
Week ending: 06 June 2025
⸻
📊 Big Picture Summary:
The NASDAQ 100 is still in a larger uptrend, but it’s facing resistance at the 22,000 level. Rejection there has triggered a short-term pullback. As long as price holds above 21,000, the bullish structure remains valid. Below that, we risk a deeper correction.
⸻
🕰 Multi-Timeframe Snapshot:
• Weekly: 21,488 | Small up-bar | Higher Low > prior | Re-testing February supply
• Daily: 21,472 | Long upper wick | Higher High | Rejected 22k supply
• 12H: 21,474 | Outside-bar pullback | Expanding | Closed into 0.382 Fib
• 4H: 21,474 | Large bear bar | Higher Low | Lands on 100 SMA
• 90M: 21,474 | Momentum flush | Lower Low | Tags 0.618 Fib + trendline
⸻
📈 Trend & Structure Analysis:
• Weekly: Strong uptrend with rising SMA stack; price above Ichimoku cloud. As long as 21,000 holds, pullbacks are buyable. Key support: 20,350–19,140.
• Daily: Uptrend intact but overextended. Rising wedge structure broke at 22k, risk of pullback to 21,070 or 20,750.
• 12H: Bullish while above 21,160, but channel loss warns of potential dip to 21,000.
• 4H: Rising wedge break confirmed; testing 100 SMA. Needs to reclaim 21,700 to resume strength.
• 90M: Bearish flush with momentum reset. Needs quick reclaim of 21,630, else risk of continuation to 21,300.
⸻
📊 Momentum & Flow:
• Weekly RSI: 58 | MACD + | CMF +0.08
• Daily RSI: 62 | MACD – | Bearish divergence developing
• 12H RSI: 55 | MACD –
• 4H RSI: 44 | MACD – | Hidden bullish possible
• 90M RSI: 35 | MACD –
Interpretation: Higher timeframes show strength but momentum is cooling off. Lower timeframes show bearish pressure, but it looks corrective, not a trend reversal—unless 21,000 fails.
⸻
📉 Volatility Overview:
• Weekly: Mild expansion, %B at 0.66
• Daily: Expansion pausing, %B from 0.93 → 0.75
• 12H: Post-squeeze contraction
• 4H: Mean reversion phase
• 90M: Lower-band flush, ready for new drive
⸻
📍 Key Levels to Watch:
• 22,200–22,900: Weekly + Daily supply zone (strong resistance)
• 21,804–21,718: Intraday bear OB (90M)
• 21,661–21,627: Bull OB on 90M – key battle line
• 21,468–21,396: 4H order block + Fib cluster
• 21,130–21,000: Major 12H support + rising trendline
• 20,750–20,420: Strong Daily demand zone
• 18,306–17,800: Weekly macro support
⸻
🔥 Confluence Hotspots:
• 22,200 – Multi-timeframe supply, channel top = strong sell zone
• 21,660 – 90M bull OB + Fib 0.382 = minor support
• 21,468 – 4H Fib + wedge retest = neutral
• 21,130 – 12H OB + trendline + 100 SMA = major support
• 20,750 – Daily demand + 200 SMA = deeper buy zone
⸻
🧠 If / Then Logic:
• If 90M closes above 21,660 + 4H prints HL → Bull continuation
• If price ranges 21,660–21,350 for 24h → Expect pause
• If 90M closes below 21,350 → Bearish extension likely
⸻
🎯 TradingView Alert Grid:
• US100 crosses 22,200 → “Weekly supply breached – reassess bias.”
• US100 crosses 21,804 → “Intraday bear OB reclaimed – review short bias.”
• US100 crosses 21,660 → “Primary bull trigger activated – watch for long setups.”
• US100 crosses 21,000 → “Critical support broken – full re-analysis needed.”
• US100 crosses 20,750 → “Testing demand – reassess buy zone.”
⸻
🎲 Scenario Odds:
• Breakout above 22,200 → 25%
• Range between 21,800 ↔ 21,000 → 50%
• Dip below 21,000 then reclaim → 25%
⸻
✅ Final Summary:
The trend is still bullish at the macro level, but we’re in a corrective pullback. As long as 21,000 holds, this remains a healthy reset.
Watch 21,130 for long setups, and 21,660 as the first reactivation trigger for upside.
If 21,000 fails, brace for deeper demand tests at 20,750 and possibly 18,800.
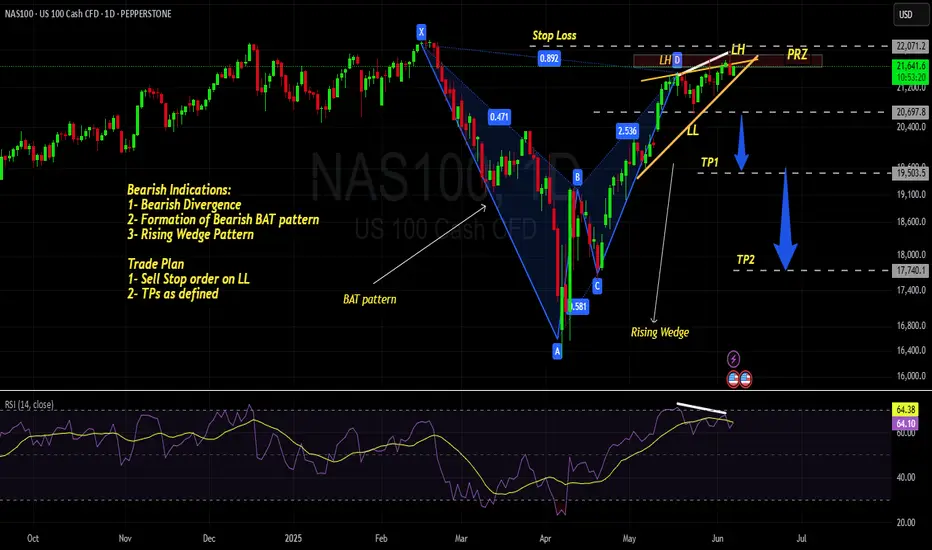
NAS100 - Bearish Trend to start SOON !!!!Bearish Indications:
1- Bearish Divergence
2- Formation of Bearish BAT pattern
3- Rising Wedge Pattern
Trade Plan
1- Sell Stop order on LL
2- TPs as defined
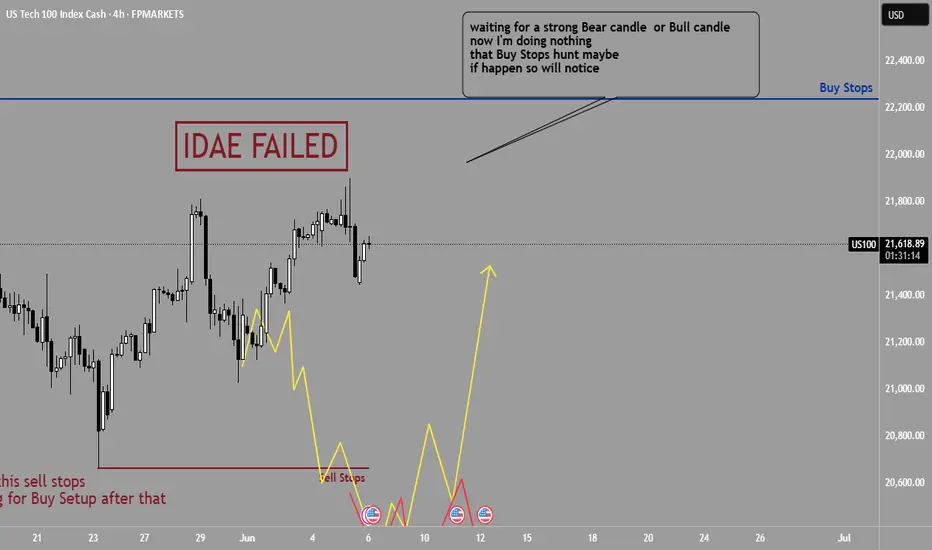
US100 : Art of doing nothingwaiting for a strong Bear candle or Bull candle
now I'm doing nothing
that Buy Stops hunt maybe
if happen so will notice
about 9 to 10 am in NewYork session looking for bear or bull candle
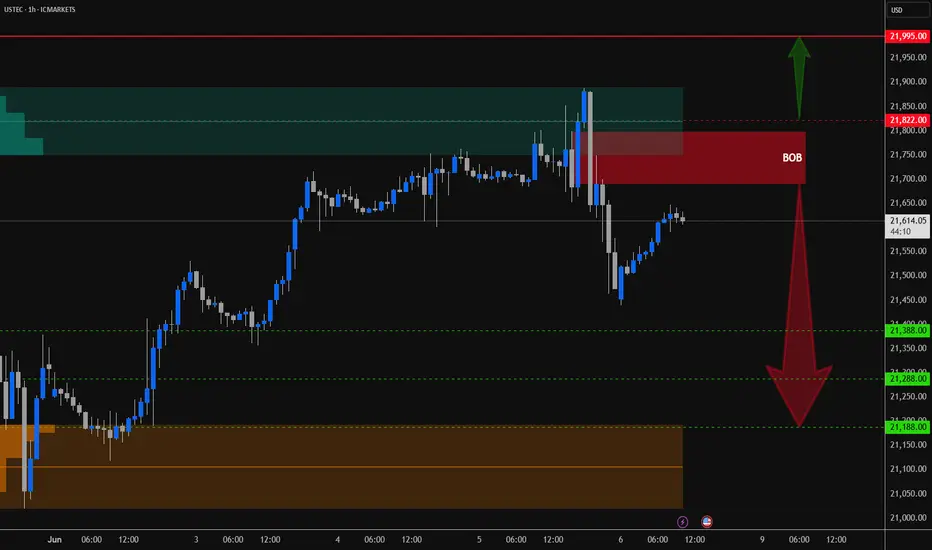
NASDAQ 100 - Potential TargetsDear Friends in Trading,
How I see it: (Upside seems limited)
** NFP DATA RELEASE TODAY - Be safe!
Key Resistance @ 21700 - 21800
Potential Targets - "SHORT"
1] 21388.00
2] 21288.00
3] 21188.00
I sincerely hope my point of view offers you a valued insight.
Thank you for taking the time to study my analysis.
USTECH (Nasdaq) Daily Trade SetupIn this update we review the recent price action in the Nasdaq and identify the next high-probability trading opportunity and price objectives to target. To review today's video analysis, click here!

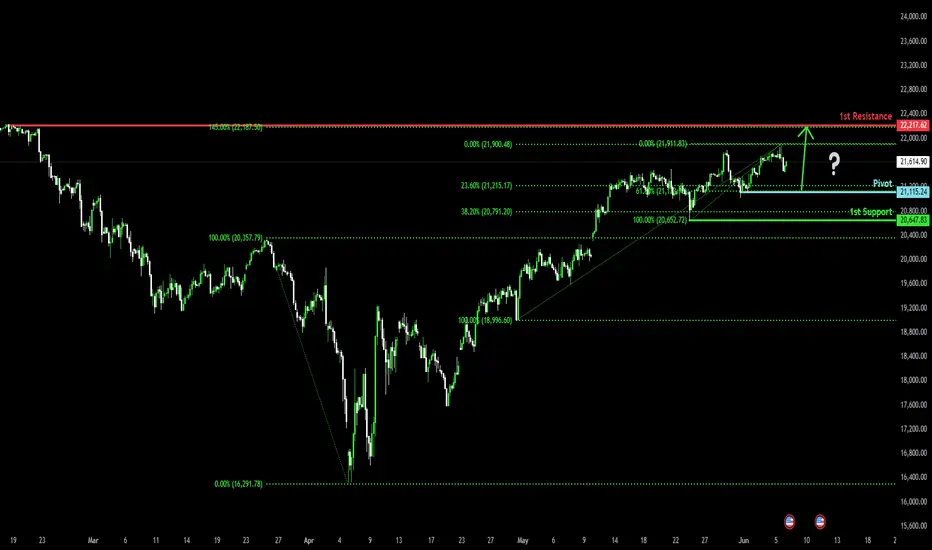
Bullish continuation?USTEC is falling towards the pivot and could bounce to the 1st resistance.
Pivot: 21,115.24
1st Support: 20,647.83
1st Resistance: 22,217.62
Risk Warning:
Trading Forex and CFDs carries a high level of risk to your capital and you should only trade with money you can afford to lose. Trading Forex and CFDs may not be suitable for all investors, so please ensure that you fully understand the risks involved and seek independent advice if necessary.
Disclaimer:
The above opinions given constitute general market commentary, and do not constitute the opinion or advice of IC Markets or any form of personal or investment advice.
Any opinions, news, research, analyses, prices, other information, or links to third-party sites contained on this website are provided on an "as-is" basis, are intended only to be informative, is not an advice nor a recommendation, nor research, or a record of our trading prices, or an offer of, or solicitation for a transaction in any financial instrument and thus should not be treated as such. The information provided does not involve any specific investment objectives, financial situation and needs of any specific person who may receive it. Please be aware, that past performance is not a reliable indicator of future performance and/or results. Past Performance or Forward-looking scenarios based upon the reasonable beliefs of the third-party provider are not a guarantee of future performance. Actual results may differ materially from those anticipated in forward-looking or past performance statements. IC Markets makes no representation or warranty and assumes no liability as to the accuracy or completeness of the information provided, nor any loss arising from any investment based on a recommendation, forecast or any information supplied by any third-party.
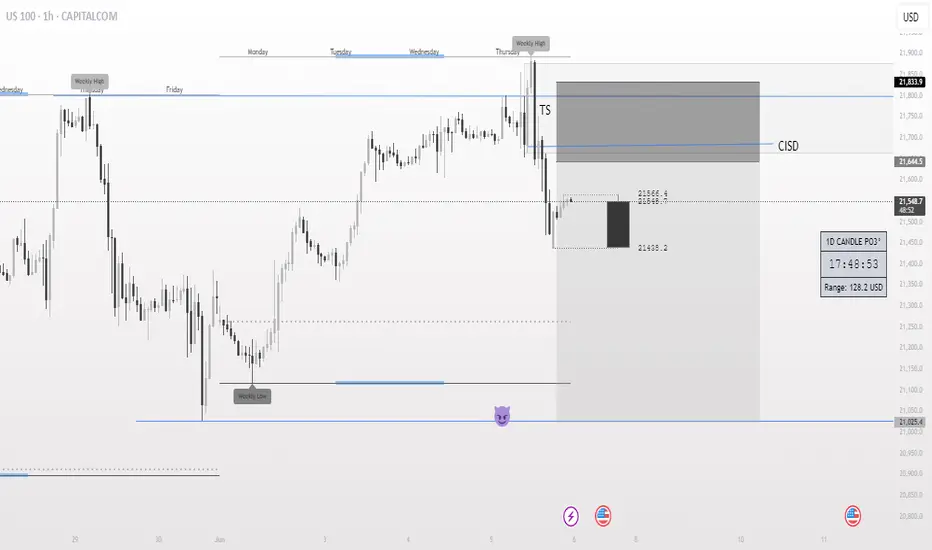
CRT analysis on US100there is a daily rejection from last week previous high, causing a turtle soup
using the h1 change in structure delivery I have marked a a valid CISD and we look to sell from that zone
XAUUSD /US 100 / BTCUSDT forecast 06/06/2025XAUUSD /US 100 / BTCUSDT Forecast | VSA & Trend Line Analysis | Gold Price Prediction
In this video, I share my detailed forecast for XAUUSD (Gold vs. USD) using Volume Spread Analysis (VSA) and trend line strategies. Watch as I break down the market structure, identify key levels, and explain the logic behind potential moves in gold/US 100 /BTCUSDT .

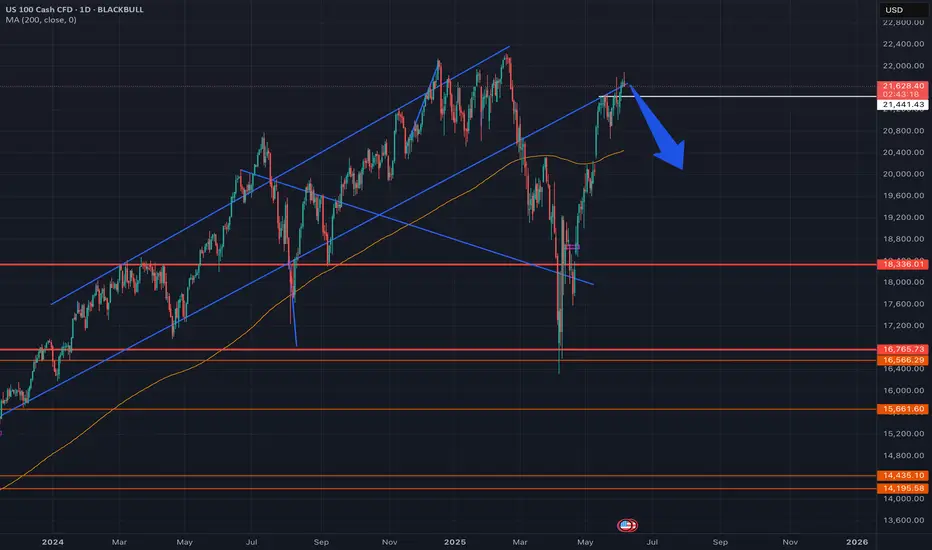
Down, Down Down, Down Down Down This idea tags onto my my other live idea on the Nasdaq (see my linked posts)
As we are still near the TOP as bullish euphoria is still present, I think now would be a good time to put my main POI's for the next 2 months out there:
21000
19300
11800
What are your POIs?

Clairfication of NDQ Elliott Wave PatternA request was made for clairification of my recent NDQ Elliott wave count.
This is a detailed count of NDQ - Minuette wave (iii).

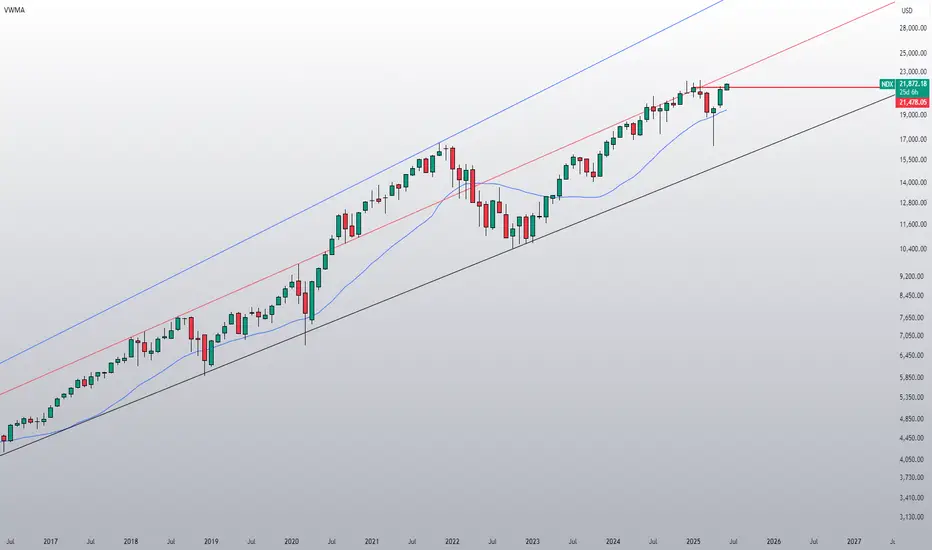
A Nasdaq Black Hole - Unprecendented yes, Impossible no Before anyone says anything...yes Elliot Waves are completely subjective BUT IMHO i have drawn these correctly....
The NAS made a violent move from 22100 down 16300 in a very short space of time. So what? It will just make another ATH right?
Well, of course. It almost certainly will, the real question is when. If this pattern plays out, it won't be in 2025.
After every impulse on any timeframe, long or short, you'd naturally expect a pullback.
However, not all pullbacks are the same. Usually, the first significant pullback for a corrective wave is no more than 50%.
However, if you have a pullback that is 61.8% or more, it is usually considered an impulsive wave.
What the difference? Corrective waves have3 waves, ultimately trending in one direction, and impulsive waves have 5 waves trending in one direction.
If the Nasdaq falls beneath 20900, with increasing volume, this will signify confirmation to me at least, that we could be starting one of the most violent impulsive bearish waves in the history of financial markets.

nasdaq. a good time to sellIn my view, it’s time to sell the Nasdaq. We’ve reached new highs, and last month was the best May in over 30 years — statistically, this alone calls for caution.
Even though the economy appears strong on the surface, and market fears around DAS and Trump have faded, investors are ignoring the real issue: U.S. public debt. This is the elephant in the room.
With recent labor data pointing toward potential weakness, the risk of a major recession is increasing. If employment starts to deteriorate, the U.S. won’t be able to refinance its ever-growing debt. Trillions in interest payments are coming due soon — around $3 trillion, which is equivalent to the entire Italian public debt. The U.S. needs to roll over roughly a third of its debt, and fast.
Given all this, I don’t see any solid reason to be buying Nasdaq at current levels. It’s rallied extremely fast, and I see a retracement toward 20,000 as a realistic scenario — potentially even lower if upcoming economic data disappoints.
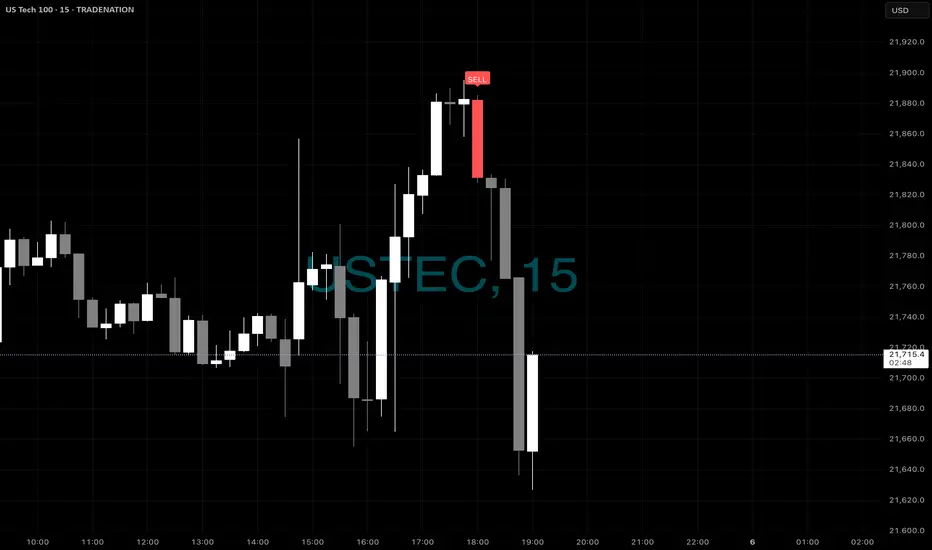
NASDAQ - SellsHey fellow traders - did you see the sells today on the US100?
Same as a few other pairs - had very good signal alerts to have take.
As per instructions - you always enter on the label print with SL above or below the signal bar - depending on buys or sells.
Hope you are enjoying the indicators we made available.
Stocks on the rise...The NASDAQ is on its way to print a new ATH. Shoutout to the lads still waiting on a 2008-style meltdown.