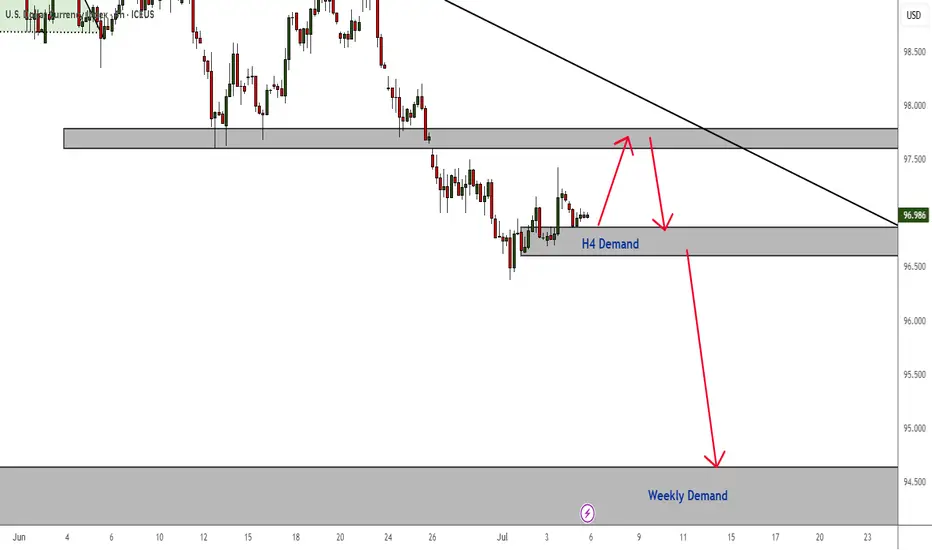
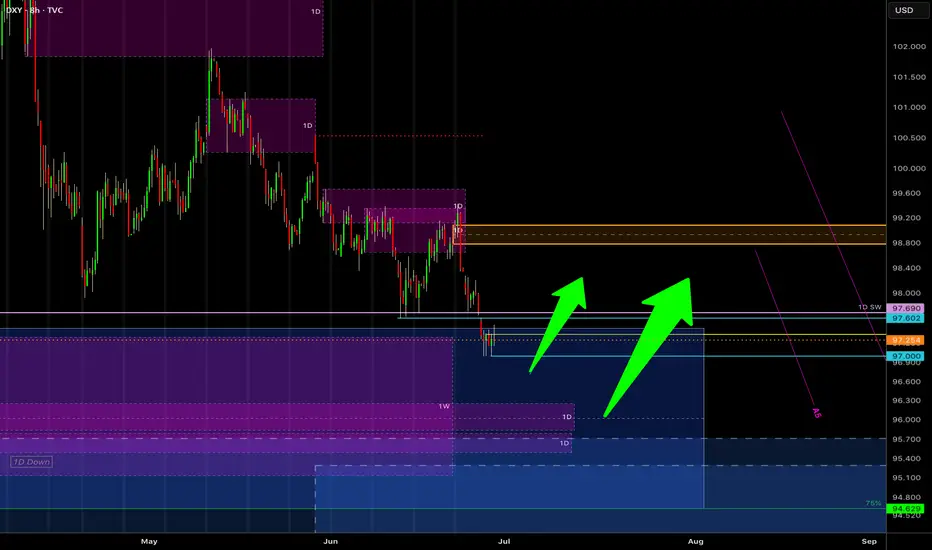
DXY Is Bearish - But A Retest is Highly ProbableThere is no denying that the overall trend is still bearish. However, price is currently respecting an H4 demand zone - which might continue to apply pressure to the upside for a minor correction.
Of course, if this correction does not happen and the H4 demand zone breaks, then we continue to ride the trend to the downside and all the way to the next weekly TF demand zone.
#TheTrendIsYourFriend
USDX trade ideas
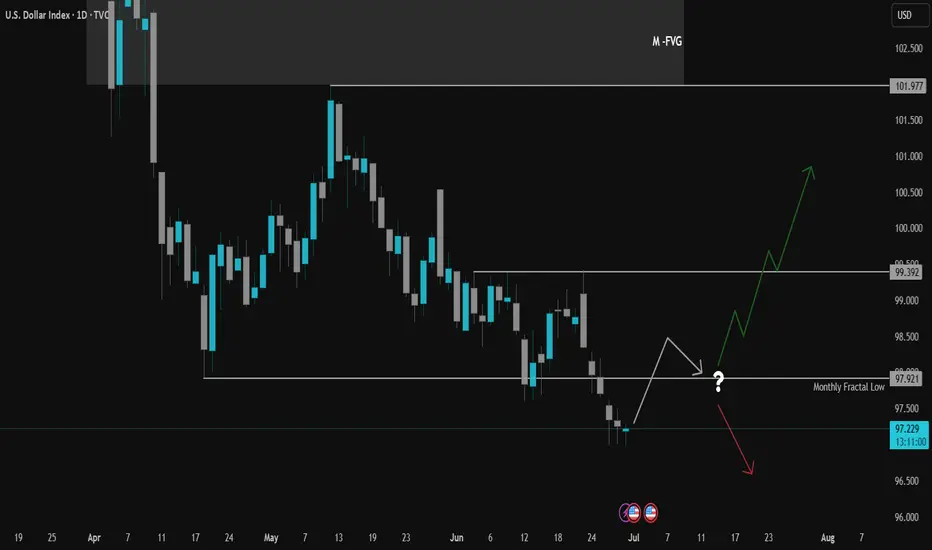
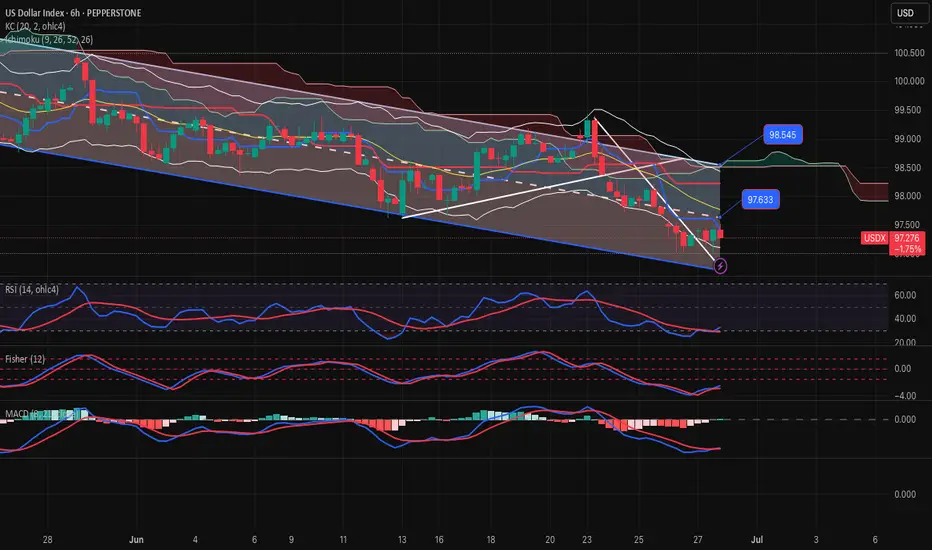
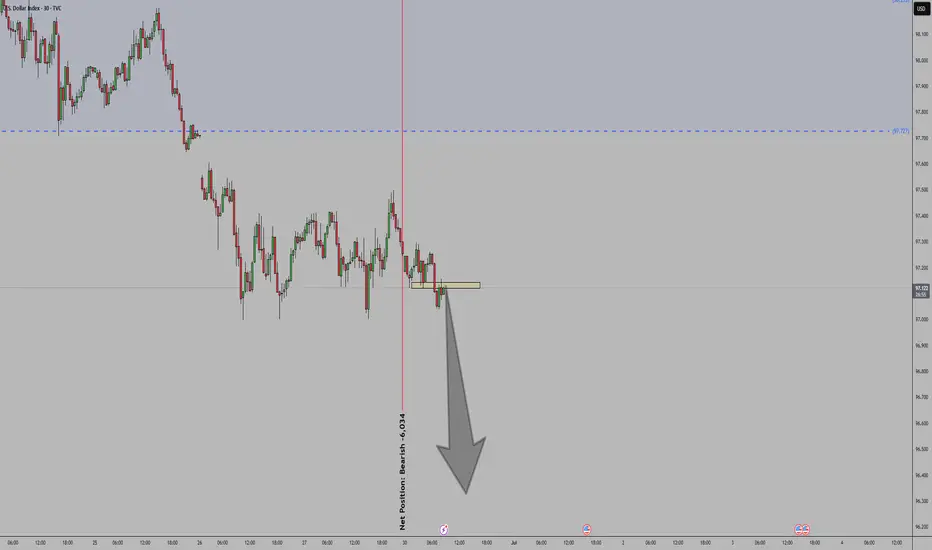
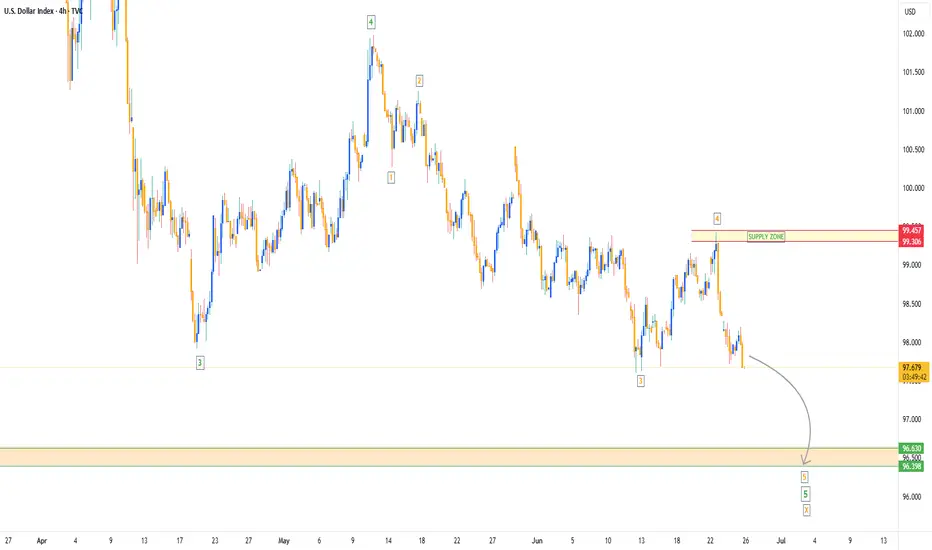
DXY Update: Monthly Low Retest on the RadarIn our previous update, we mentioned that our target had been reached and even noted the potential for higher prices. However, we also emphasized the need to wait for fresh signals at that point. After hitting the target, the price faced a sharp drop followed by another sell-off rally.
At the current level, we’re seeing a slowdown in DXY’s selling momentum. However, this alone isn’t sufficient to determine direction. While momentum may be fading, if sellers remain dominant, we’ll see bearish signs on the chart. If buyers regain control, bullish signs will emerge. With this straightforward logic in mind, we’re currently watching for a potential return to the fractal low level at 97.921, which was swept on the monthly chart.
Since it’s monthly close day, sharp intraday pullbacks may occur. As July opens, we believe there’s a possibility of a retracement toward the 97.921 level.
We’ll share any volume-based confirmations in the comments under this post.
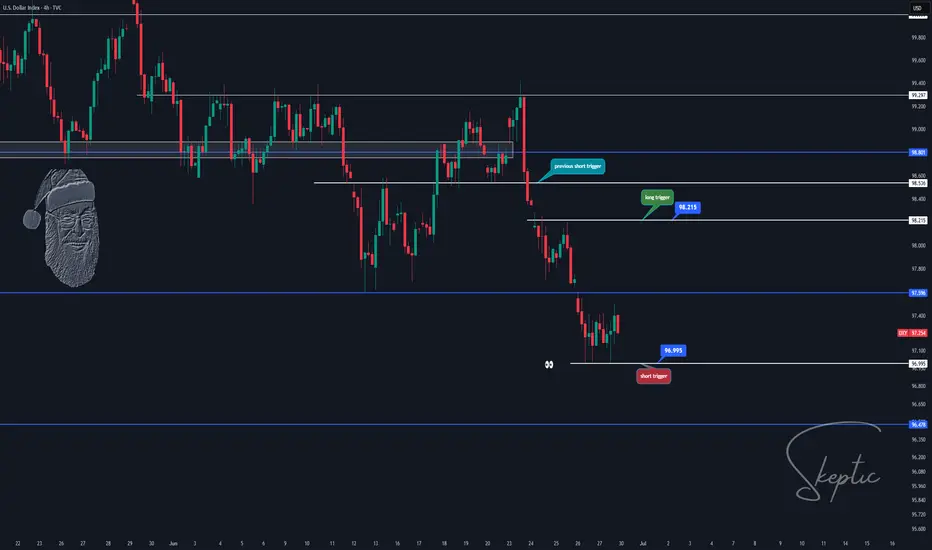
Skeptic | Weekly Watchlist : DXY Triggers & Pro SetupsLast week, DXY played out our bearish scenario perfectly, breaking the short trigger at 98.530 and delivering a strong downward move . With Higher Wave Cycle (HWC) and Minor Wave Cycle (MWC) now bearish, I’m leaning heavier on short positions with tighter risk management. Let’s break it down with no FOMO, no hype, just reason. 📊
Daily Timeframe: The Big Picture
The key support at 98.801 was decisively broken, and we’ve confirmed below it—the major trend is now fully bearish. The next daily support lies at 96.478 , but I expect range-bound action early this week, especially after last week’s big move. Patience is key—let the market form a clear structure before jumping back in.
Key Insight: The bearish trend is locked in, but early-week consolidation is likely. Wait for the market to signal its next move.
4-Hour Timeframe: Long & Short Triggers
Zooming into the 4-hour chart, let’s pinpoint Low Wave Cycle (LWC) and triggers for long and short setups:
Short Trigger: Break below 4-hour support at 96.995 , confirmed by RSI re-entering oversold. Want to wield RSI like a pro? Check out my RSI Masterclass —it’s a game-changer! 😏
Long Trigger: Break above resistance at 98.215 . This is riskier since it’s against the bearish trend—set a wider stop-loss and take profits quickly. Why? HWC and MWC are bearish, so the first uptrend wave risks stop-loss hunts or fakeouts. I’ll drop an HWC/MWC/LWC guide soon to optimize entries, stops, and more—stay tuned!
Pro Tip: For longs, expect volatility in the first wave. Shorts align with the trend, so they’re the safer play—focus on 96.995.
Final Vibe Check
This Weekly Watchlist sets you up to trade smarter, not harder. DXY’s bearish momentum is our focus, but patience will unlock the best setups. I’ll keep you updated daily as markets evolve. Protect your capital—max 1%–2% risk per trade, no exceptions. Want the HWC/MWC/LWC guide or another pair? Drop it in the comments! If this watchlist sharpened your edge, hit that boost—it fuels my mission! 😊 Stay disciplined, fam! ✌️
💬 Let’s Talk!
Which setup are you eyeing this week? Share in the comments, and let’s crush it together!
DXY Weekly ForecastDXY Weekly Forecast
- Go for up move if setup given
A Message To Traders:
I’ll be sharing high-quality trade setups for a period time. No bullshit, no fluff, no complicated nonsense — just real, actionable forecast the algorithm is executing. If you’re struggling with trading and desperate for better results, follow my posts closely.
Check out my previously posted setups and forecasts — you’ll be amazed by the high accuracy of the results.
"I Found the Code. I Trust the Algo. Believe Me, That’s It."
USDX-BUY strategy 6 hourly chart Reg. ChannelThe index is near the bottom of the channel and indicators are positive.
It worthwhile to look at this carefully, as it will help us in deciding on the other pairs. The current support is a bit lower than the close 97.26 and we can expect 98.30-98.60 area as our objective.
Strategy BUY @ 97.00-97.40 and take profit near 98.50.
DXY ANNALSIS OUTLOOK BULLISH POSIBLE MOVEWS 28/6/2025strong buy 97.000
buy 96.800
going on bullish moves
buyers and sellers
ready to new months new week's
buy 97.000
take profit 97.400
take profit 97.800
take profit 98.500
stop los 96.600
DXY Risk Reversal Blueprint: Monthly Chart Analysis
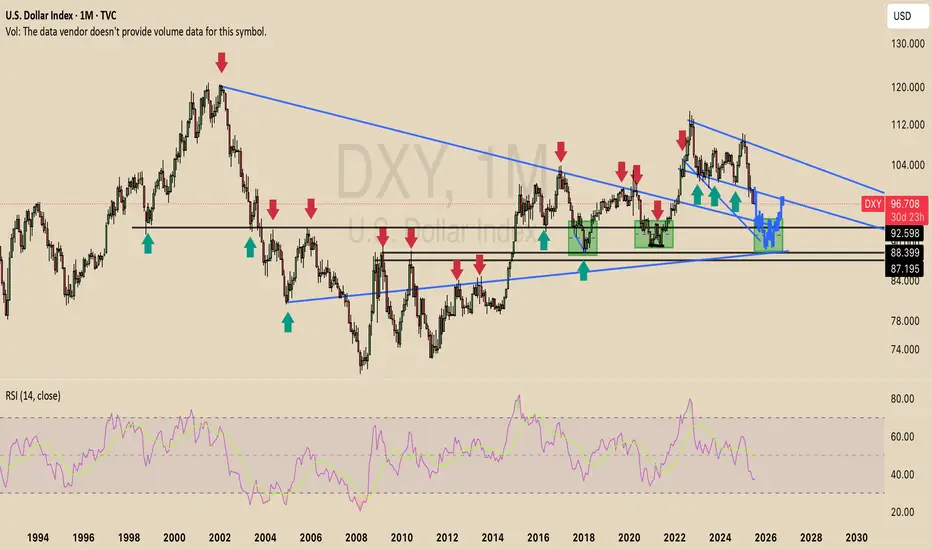
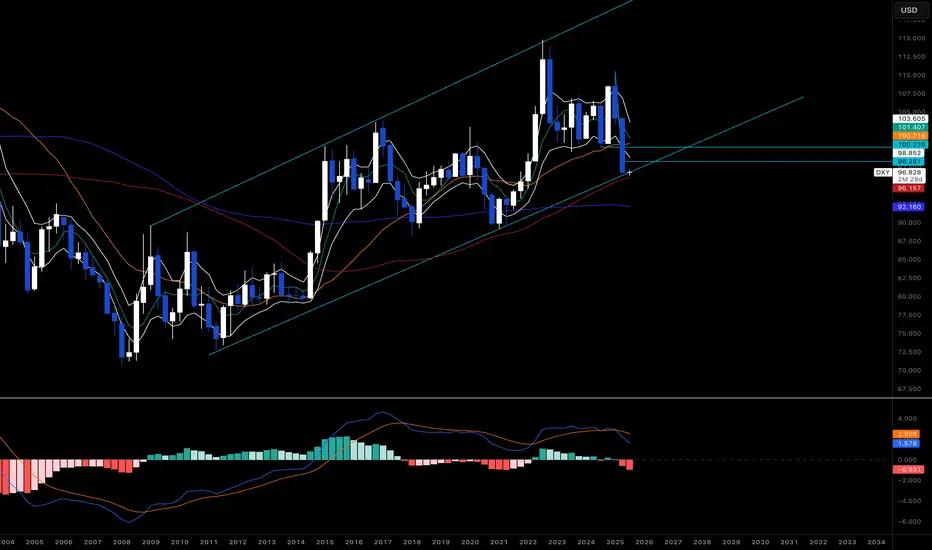
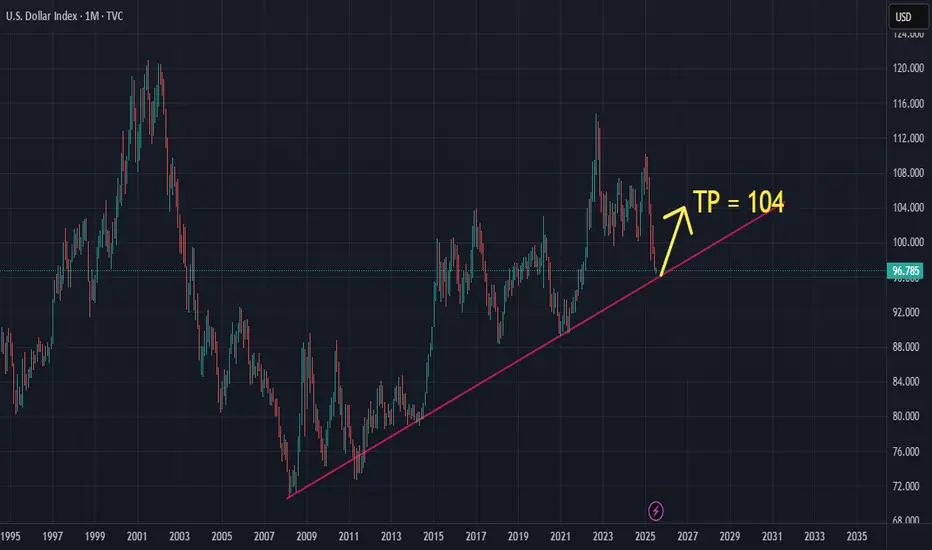
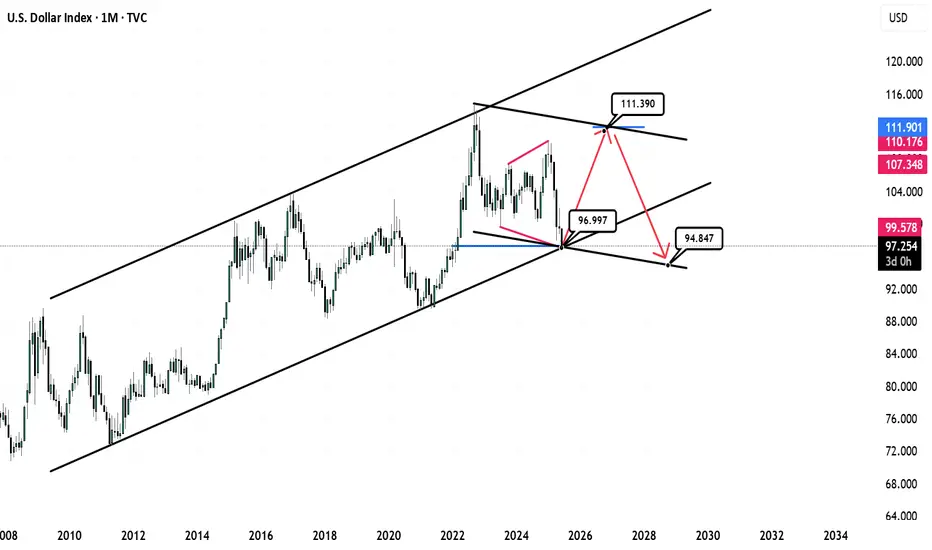
The DXY is currently 6.5% above the midpoint of a critical confluence zone ("the box") on the monthly chart, where multiple trendlines and a key 50%/61.8% Fibonacci retracement level align to form a powerful support/resistance area. The monthly timeframe amplifies this zone’s strength, with price repeatedly respecting these trendlines (marked with arrows), confirming their reliability. The recent large retracement in the DXY signals a potential major move as it approaches this mega support. In 2017 and 2020, the DXY entered the box, consolidated for ~300 days, and then reclaimed higher, resuming an upward trend. I expect a similar pattern this time: a 6.5% drop to the box’s midpoint (aligned with the 50%/61.8% Fib zone), followed by ~300 days of consolidation and an upside breakout, potentially signaling a market top for risk assets. This high-conviction setup serves as a blueprint to de-risk and guide portfolio decisions, such as trimming or adding to positions in stocks and crypto. Given the DXY’s inverse correlation with risk assets, a move into the box could favor accumulating risk asset positions, while an upside reclamation could prompt trimming to reduce exposure. Once the DXY nears this mega support, I’ll analyze lower timeframes (e.g., weekly, daily) for bottoming signals to confirm the reversal. Monitoring price action, volume, and candlestick patterns near the box is crucial for precise timing.
#DXY #TechnicalAnalysis #Fibonacci #Stocks #Crypto #HighConviction
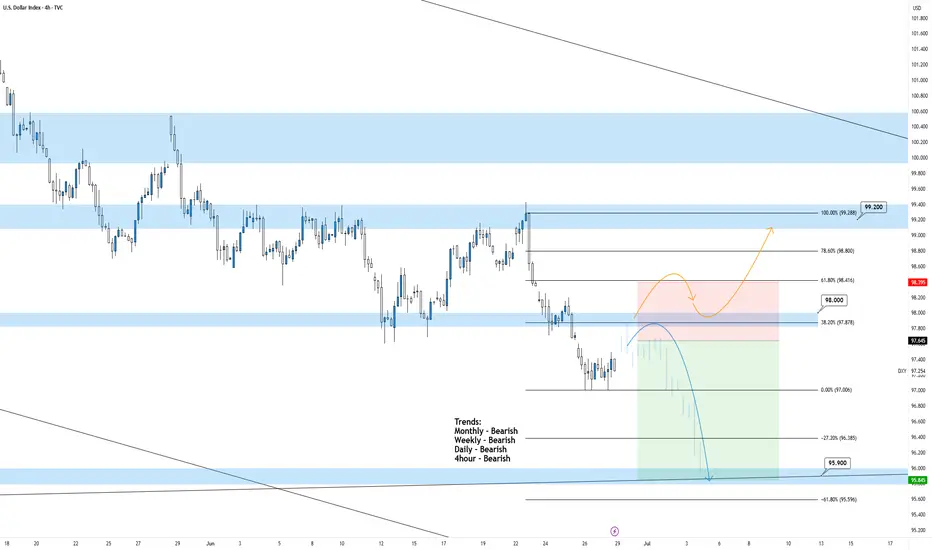
DXY 4hour TF - June 29th, 2025DXY 6/29/25
DXY Bearish Idea
All significant timeframes (monthly,weekly,daily 4hr) appear bearish for now.
Last week on June 25th, 2025 we saw price action break through our 98.000 zone confirming more bearish movement. This week we have two likely options that we will wait for confirmation on.
Bearish Continuation - Ideally we keep with the trend and look for lower highs below 98.000 for further confirmation. If we can spot rejection from this zone it is likely we will see DXY continue bearish for the week ahead.
Reversal - This is less likely but still possible. Price action could punch back through the 98.000 resistance and begin retesting previous highs. If this happens look for candlestick confirmation above 98.000 and expect a more bullish DXY for the week ahead.
DXY This is a strong increase in short positions (more than double).
DXY Sentiment: Bearish
Momentum: Increasing bearish pressure
(Speculators are more confident the dollar will weaken)
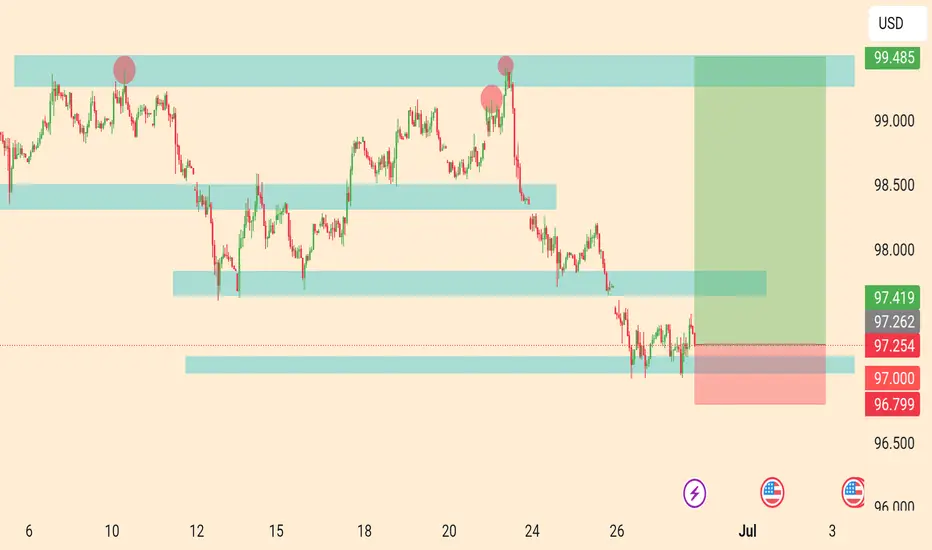
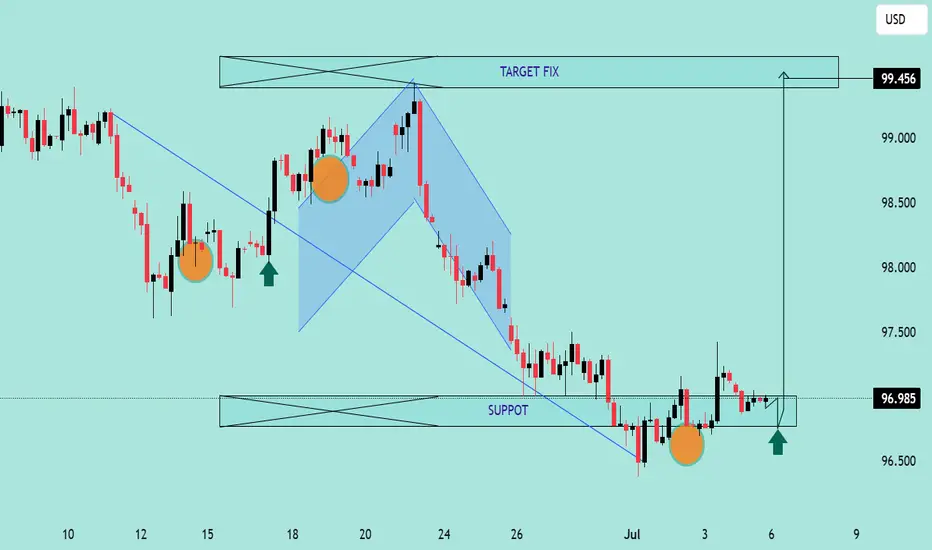
DXY Potential Bullish Reversal – Target 99.456 DXY Potential Bullish Reversal – Target 99.456 🎯
Technical Analysis Overview:
🔹 Trend Structure:
The chart illustrates a recent downtrend, which has been broken as price moved above the descending trendline, signaling a potential trend reversal.
🔹 Pattern Insight:
A bullish harmonic pattern is visible (possibly a bullish Bat or Gartley), with the price reacting from the PRZ (Potential Reversal Zone), aligning with key support near 96.500. The market has respected this zone multiple times, evident from the orange highlighted circles showing price rejections.
🔹 Support & Resistance:
Support Zone: ~96.500
Breakout Zone: ~96.985 (current consolidation near this resistance)
Target Zone: Marked at 99.456, which aligns with previous structure and fib projection.
🔹 Market Sentiment:
Price is consolidating after breaking the downtrend, forming a bullish rectangle (accumulation). The green arrows indicate bullish intent from buyers defending support levels.
🔹 Price Action Signal:
Formation of higher lows.
Break of structure and close above previous highs.
Possible breakout pending above consolidation box.
📊 Conclusion:
DXY shows bullish potential as it builds a base around strong support. A confirmed breakout above the rectangle could fuel a rally toward 99.456. Keep an eye on volume and confirmation candles for entry. ✅
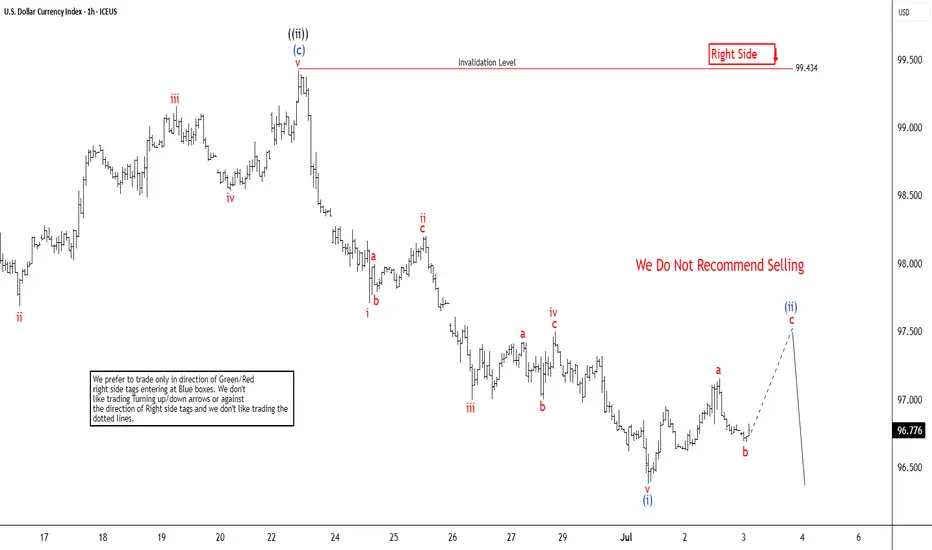
Dollar Index (DXY) Bearish Trend IntactThe Dollar Index (DXY) cycle, originating from its September 2022 peak, remains incomplete and exhibits a bearish outlook, signaling potential for further declines. The descent from the May 29, 2025 high is currently unfolding as a five-wave impulse pattern. From this high, wave ((i)) concluded at 98.35, followed by a corrective rally in wave ((ii)). The rally formed as an expanded flat, peaking at 99.43 as depicted on the one-hour chart below.
Subsequently, the Index extended lower, forming a nested structure. Within this decline from wave ((ii)), wave i bottomed at 97.7, with a corrective wave ii rally reaching 98.2. Wave iii then drove the Index lower to 97, followed by wave iv peaking at 97.49. The final leg, wave v, completed at 96.37, marking the end of wave (i). Currently, a corrective rally in wave (ii) is underway, aiming to retrace the decline from the June 23, 2025 peak. This rally appears to be unfolding as a zigzag pattern, with wave a concluding at 97.15 and wave b dipping to 96.69. Wave c is expected to target the 100%–161.8% Fibonacci extension of wave a, projecting a range of 97.45–97.9.
Should the Index reach this zone, it may encounter selling pressure, potentially leading to further downside or a three-wave pullback. As long as the pivot high at 99.4 remains intact, any rally is likely to falter in a 3, 7, or 11-swing structure, reinforcing the bearish bias for additional declines.
USD Index preparing for fresh YTD lows?As shown on the daily chart of the USD Index, the currency has been biased to the downside for most of this year and recently met with 1M support at 96.80. This has caused the Index to modestly rebound and retest a 6M resistance at 97.39. Given this level's significance and trend direction, sellers could show from 97.39 and refresh year-to-date lows towards 1Y support at 95.67.
- FP Markets Research Team
Dollar Index Bearish to $96The DXY has been in a downtrend for a while & that bearish pressure is not over yet. I expect more bearish downside towards the $96 zone, before we can re-analyse the market for any signs of bullish takeover.
⭕️Major Wave 3 Impulse Move Complete.
⭕️Major Wave 4 Corrective Move Complete.
⭕️Minor 4 Waves of Major Wave 5 Complete, With Minor Wave 5 Yet Pending.
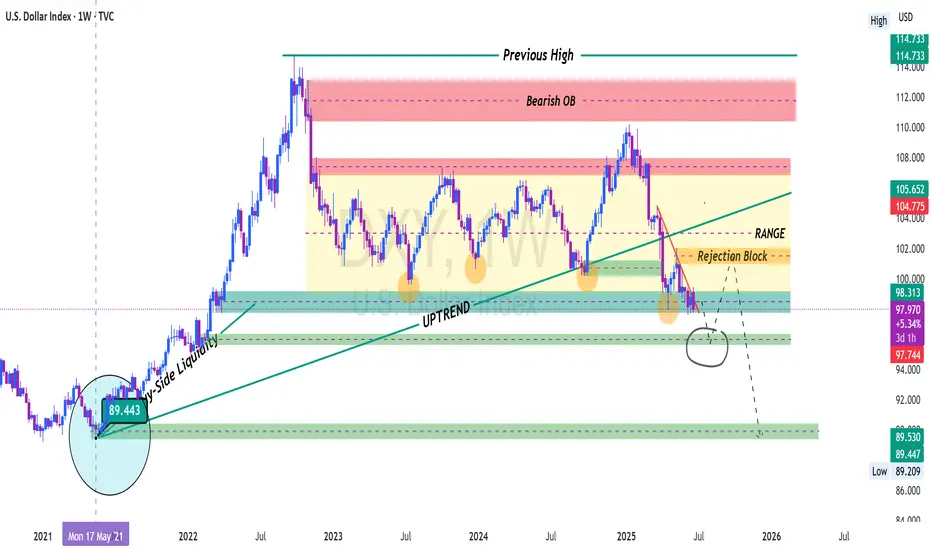
DXY QUITE BEARISH ON WEEKLY DXY might just drop to previous low of May 2021 at the 89 if this weekly downtrend continues
Why I haven't posted this week:Hey all,
So, for those of you who watches my videos and market commentary will have noticed that I haven't posted anything this week, event though there were some awesome opportunities to highlight and discuss.
The reason for this is because I am currently conducting work training and was unable to record, however, rest assured that I'll be back next week to break down these markets with you and take advantage of the opportunities lining up.
Up until then keep well and bye for now
Long-term view for DXY!The current market sentiment isn't favorable for the dollar, but it still presents a good buying opportunity for long-term investors—especially for those looking to purchase USD from exchanges without using leverage or taking on trading risks.
The Bessent Effect Explained: Weaken the Dollar The Bessent Effect Explained: Weaken the Dollar
There’s no coincidence that the U.S. dollar has had its worst first half of the year since the dawn of free-floating currencies in the 1970s. And if anyone knows how currencies tick — or unravel — it’s Scott Bessent, the man who once stood behind George Soros during the legendary short of the British pound in 1992. Now, three decades later, Bessent sits at the helm of the most powerful economy in the world, steering the U.S. Treasury through a historic moment: where America is trying to boost exports, undercut foreign currency manipulation, and lighten the crushing weight of debt — all while keeping inflation from boiling over.
Of course, no Treasury Secretary will ever say “we want a weaker dollar”, but if one wanted to do it strategically, they'd need to be part economist, part hedge fund manager and part illusionist.
Enter: The Bessent Effect.
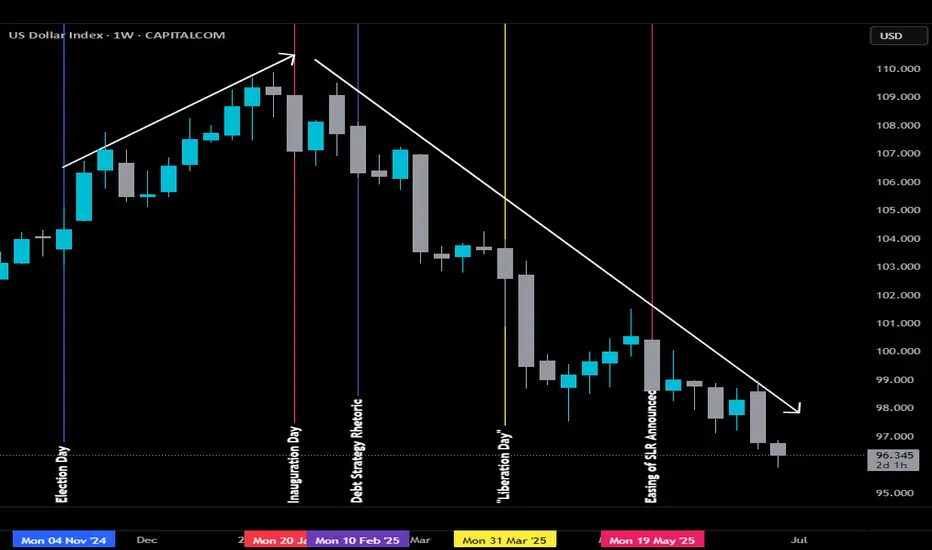
📊 Charting the Decline
• After Election Day (BLUE LINE), the DXY marched upward, peaking near 109 — a reflection of market optimism or a dash of geopolitical anxiety.
• By Inauguration Day (REDLINE), that trend began to unwind. Investors started to squint at the fiscal roadmap and didn't love what they saw.
________________________________________
Debt Strategy Rhetoric: PURPLE LINE
In early February, Treasury Secretary Scott Bessent addressed the U.S. debt issuance strategy. While he openly criticized his predecessor’s reliance on short-term debt, his first major move was paradoxical: he continued that very approach, opting to maintain a heavy focus on short-term issuance while holding off on extending maturities. This subtle decision screamed one thing for markets: rollover risk. What if rates stay high? What if inflation persists? What if buyers disappear?
Result? The dollar started sliding faster.
________________________________________
Liberation Day: YELLOW LINE
On April 2, “Liberation Day” tariffs were announced. Potential retaliation from China and Mexico, and now you've got cross-border chaos. Trade wars spook global markets, slash demand for U.S. assets, and drive capital into gold and foreign currencies. The dollar’s dominance doesn’t vanish overnight — but the cracks begin to show.
________________________________________
Easing of SLR Announced: PINK LINE
On May 23, just when the DXY needed a break, Bessent went on Bloomberg and said, “We are very close to moving” on the Supplementary Leverage Ratio (SLR). Translation? Banks may soon face eased capital rules, making it easier for them to buy Treasuries.
Markets took it as regulatory backdoor stimulus — a shadowy workaround to support Treasury demand without triggering money printers. But it also raised fears about systemic risk, inflation, and policy overreach. The DXY barely blinked before continuing its methodical march lower.
________________________________________
But What If...
What if Bessent’s moves aren’t missteps, but part of a calculated devaluation strategy? A weaker dollar makes U.S. exports more competitive, revives domestic manufacturing, and reshapes global trade dynamics. By subtly bending the rules (instead of breaking them), Bessent may be re-engineering the dollar's role—less as a global anchor, more as a tool for national advantage. By easing the SLR, he may have discovered a subtle way to bring down the long end of the yield curve.
If it’s not currency destruction. Maybe it’s precision macro strategy?
________________________________________
What’s Next?
Sure, the DXY might bounce a little — even bad news needs a break. But what could drive it even lower?
How about the loss of Federal Reserve independence?
Luckily, that’d only happen if there were whispers of a “shadow Fed chair” waiting in the wings. But that’s just conspiracy talk... right?
Follow on X: @TheAlphaView
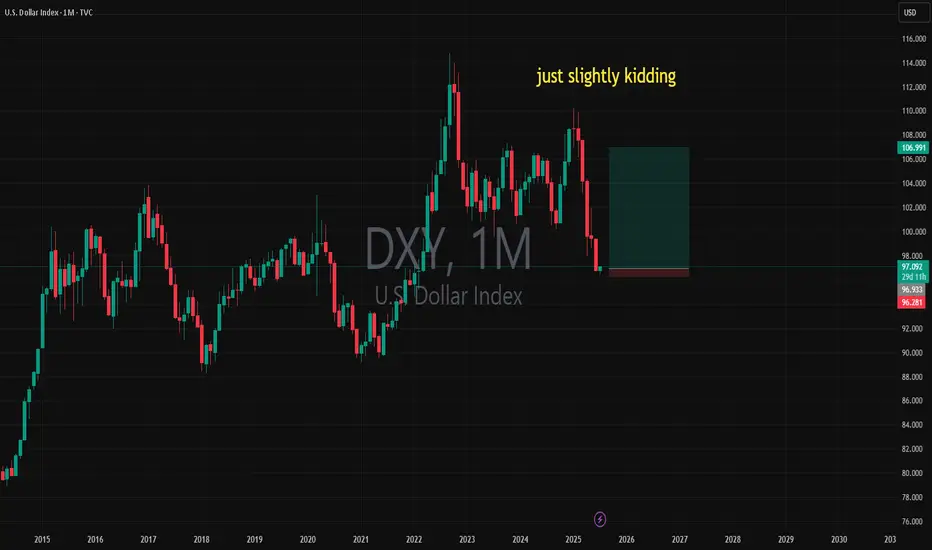
just slightly kidding, yes or no DXY MONTHLYjust slightly kidding, yes or no DXY MONTHLY\
bullish. so very bullish
let us know!
free transparent no edit no delete
🐉We value full transparency. All wins and fails fully publicized, zero edit, zero delete, zero fakes.🐉
🐉Check out our socials for some nice insights.🐉
information created and published doesn't constitute investment advice!
NOT financial advice
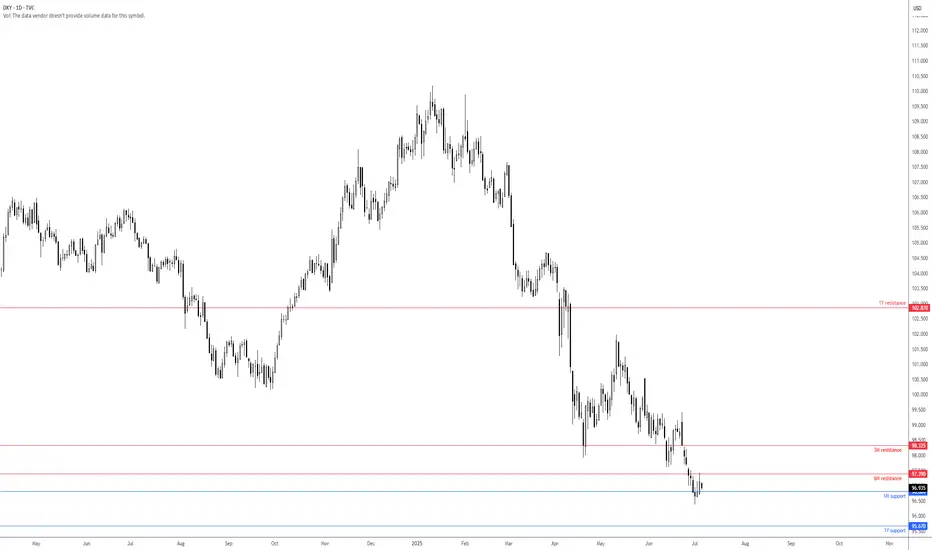
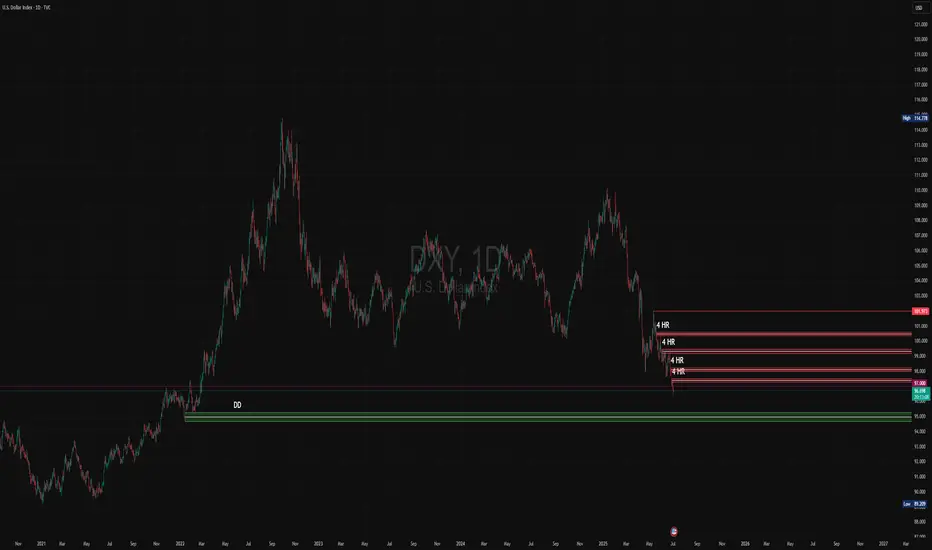
U.S. dollar index DXY analysis- daily time frame ✅ U.S. Dollar Index (DXY) Analysis — Daily Timeframe
👤 A TVC:DXY trader’s perspective:
When I look at this chart, several key points immediately stand out:
1️⃣ Long-Term Trend
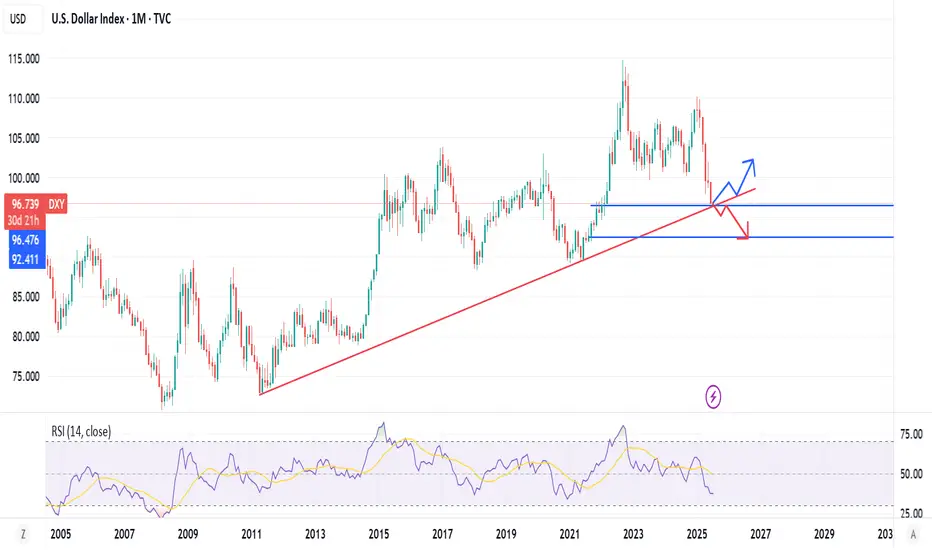
On the weekly and daily timeframe, the major trend has turned bearish after peaking around 114. We see a clear series of lower highs and lower lows confirming the downtrend.
The sharp rally from 89 to 114 in the past was a strong impulsive move, which is now undergoing a deep correction. Currently, price is hovering around a major historical support near 96.
2️⃣ Key Support Zone
The current price near 96.7 is sitting right at a significant support area that has triggered considerable buying interest in the past.
If this support decisively breaks, the green zone marked as DD (around 93–95) represents a strong long-term demand zone and will likely be the next liquidity target for buyers.
3️⃣ Resistance (Supply Zones)
The four red-marked 4HR zones between 97 and 101.9 clearly show significant supply zones where sellers have stepped in on lower timeframes.
Should the price attempt a bounce from current levels, these resistance areas may act as a strong barrier to further upside.
4️⃣ Price Structure and Liquidity
Looking more closely, the market seems to be moving from a consolidation phase toward lower support liquidity. That means there is a high probability of a liquidity grab toward the 93–95 area before a potential fresh bullish leg.
At higher levels, unless the price can break and hold above 98 and then 100, we cannot confirm a trend reversal.
🔹 Summary
✅ Overall downtrend remains dominant
✅ 96–97 is a critical support zone
✅ A break below this support targets 93–95
✅ Trend reversal only possible with a confirmed break and hold above 98, and then 100–101
✅ The 4HR resistance zones (97–101) are strong hurdles for any bullish retracement
✅ As long as price remains below 98, any rally is likely just a corrective move
⚠️ Disclaimer: This analysis is for educational and informational purposes only and does not constitute financial advice or a recommendation to buy or sell. All trading decisions are solely your own responsibility.
USD Roadmap: Bullish Recovery or Structural Breakdown?TVC:DXY CAPITALCOM:DXY
🟢 Scenario A – Bullish Rebound (Red Arrow Up):
Price bounces from the lower channel and breaks toward:
107.348, 110.176, or even 111.901 resistance area.
If the dollar is supported by China buying USD, hawkish Fed, or geopolitical tensions, this scenario gains weight.
🔸 Resistance: Blue downward-sloping line (possible trendline resistance or lower high area)
🔸 Risk: Price could form a lower high and then reverse.
🔴 Scenario B – Bearish Breakdown (Red Arrow Down):
If the USD fails to break above resistance (around 107–112) and gets rejected…
Then we see a move back down, possibly breaking the long-term channel, aiming for the lower diagonal support zone or even sub-92.
🔸 This would signal a major shift in USD strength, possibly driven by:
Fed rate cuts
Global de-dollarization
China not supporting USD
Stronger EUR or CNY
dxy looks on critical juncture dxy looks on critical juncture consolidation near 95 can lead to higher side but if it do not happen than lowerside can be the target
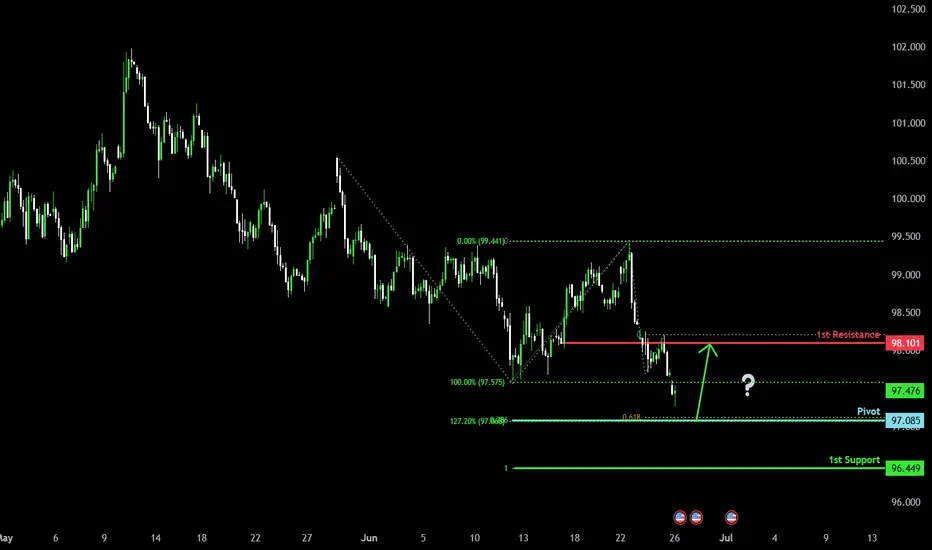
Potential bulllish reveresal?The US Dollar Index (DXY) is falling towards the pivot, which aligns with the Fibonacci confluence and could reverse to the 1st resistance.
Pivot: 97.08
1st Support: 96.44
1st Resistance: 98.10
Risk Warning:
Trading Forex and CFDs carries a high level of risk to your capital and you should only trade with money you can afford to lose. Trading Forex and CFDs may not be suitable for all investors, so please ensure that you fully understand the risks involved and seek independent advice if necessary.
Disclaimer:
The above opinions given constitute general market commentary, and do not constitute the opinion or advice of IC Markets or any form of personal or investment advice.
Any opinions, news, research, analyses, prices, other information, or links to third-party sites contained on this website are provided on an "as-is" basis, are intended only to be informative, is not an advice nor a recommendation, nor research, or a record of our trading prices, or an offer of, or solicitation for a transaction in any financial instrument and thus should not be treated as such. The information provided does not involve any specific investment objectives, financial situation and needs of any specific person who may receive it. Please be aware, that past performance is not a reliable indicator of future performance and/or results. Past Performance or Forward-looking scenarios based upon the reasonable beliefs of the third-party provider are not a guarantee of future performance. Actual results may differ materially from those anticipated in forward-looking or past performance statements. IC Markets makes no representation or warranty and assumes no liability as to the accuracy or completeness of the information provided, nor any loss arising from any investment based on a recommendation, forecast or any information supplied by any third-party.
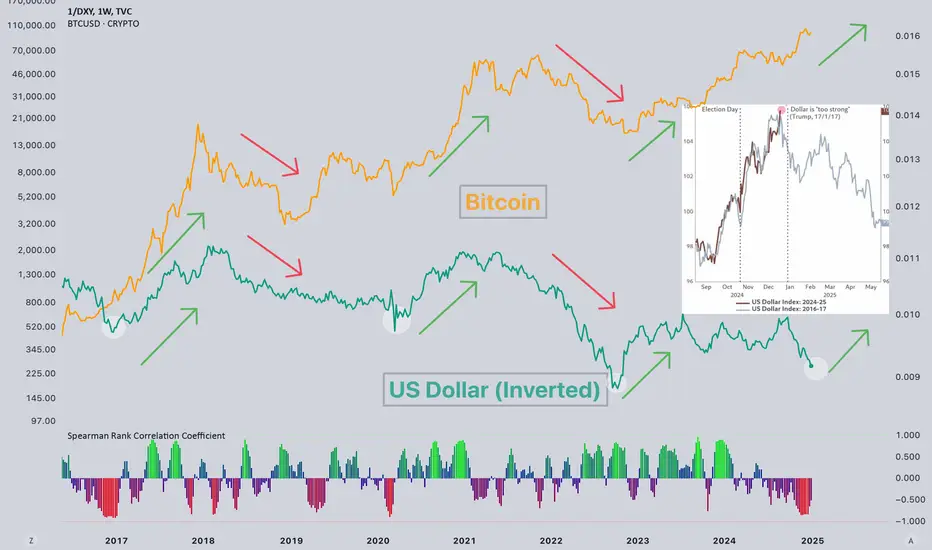
#Dollar / #Bitcoin correlation I've previously described the correlation, and it's clear to everyone: a weaker DXY is positive for BTC.
📝Recently, the dollar has grown significantly and seems close to a local maximum (the chart is inverted). This demonstrates the strength of Bitcoin, as it was able to rise even against a strengthening dollar.
💡Imagine its movement when the new administration plans to lower the dollar price like they did last time. I think we will see a similar scenario as in 2017, when the dollar, from a local maximum, begins to provide a tailwind to the movement of assets that trade against it.