DXY LONG 03/07/2025Here we have the DXY hitting the resistance of a multi-year confirmed tunnel, while the down trend seems very strong, and can break trough some more to the downside, its a good spot to start picking up some UUP stocks, I belive price will eventually break and hit the 93 price mark, will make a double bottom and run back up inside the channel.
Good luck
USDX trade ideas
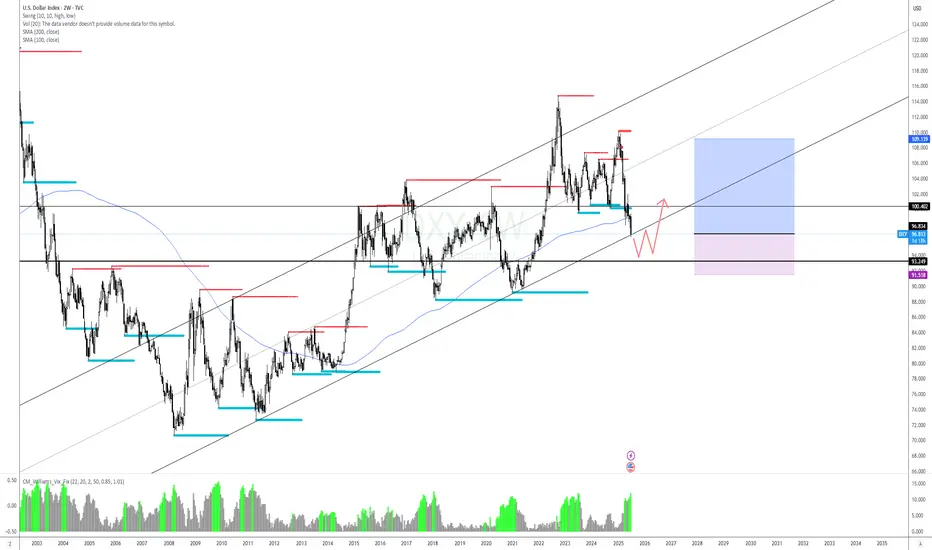
DXY Long-Term Technical Outlook: Channel Structure, Pullbacks & ## **DXY (Dollar Index) Technical Analysis – 2W Chart**
### **1. Uptrend Since 2008**
The Dollar Index (DXY) has been in a **long-term uptrend** since the 2008 bottom (around 70.70). The chart shows a clear pattern of **higher highs and higher lows**, establishing a bullish market structure over the past 15+ years.
---
### **2. Ascending Channel**
The price has been moving consistently within a well-defined **ascending channel**. Several reactions from the channel boundaries are visible:
- **Support (lower trendline):** 2008, 2011, 2018, 2021, 2024
- **Resistance (upper trendline):** 2009, 2017, 2022
This suggests that the market is respecting the technical boundaries of the channel remarkably well.
---
### **3. Historical Pullbacks Within the Channel (13.5% – 15%)**
The chart highlights major **pullbacks** from local tops, all falling within the **-12.6% to -16.9%** range, showing high consistency:
| Year | Drop | % Decline |
|-------------|----------|----------------|
| 2009 | -14.76 | -16.47% |
| 2010 | -14.97 | -16.90% |
| 2017 | -15.17 | -14.61% |
| 2020 | -13.65 | -13.25% |
| 2022 | -14.90 | -12.98% |
| 2024/2025 | -13.90 | -12.61% |
This implies that **a retracement of 13–15%** from a local high is a historically "normal" correction within the ongoing uptrend.
---
### **4. EMA Analysis – 24, 120, 240** (2Y,5Y,10Y)
The chart includes three Exponential Moving Averages (EMAs), reflecting short-, medium-, and long-term trends:
- **EMA 24 (white line):** Reacts to short-term price action. Price is currently breaking below it, suggesting weakness in short-term momentum.
- **EMA 120 (red line):** Reflects the mid-term trend. Price is **right at the edge**, often acting as a **support level** in bullish markets.
- **EMA 240 (blue line):** Represents the long-term outlook. **Price has never stayed below this level for long** over the past 15 years, making this EMA a **critical support** for the long-term trend.
---
### **Conclusion & Potential Scenarios**
📉 **Bearish Scenario:**
If DXY breaks below the **EMA 240** and the **lower channel boundary**, it could indicate a **reversal of the long-term uptrend**, which hasn’t happened since 2008.
📈 **Bullish Scenario:**
If DXY holds above the **EMA 120** or bounces from the **EMA 240** and the **channel support**, we could expect a rally toward the **Fibonacci levels** (0.5 at 102.04 or 0.382 at 105.04), or even a retest of the highs around **114.78**.

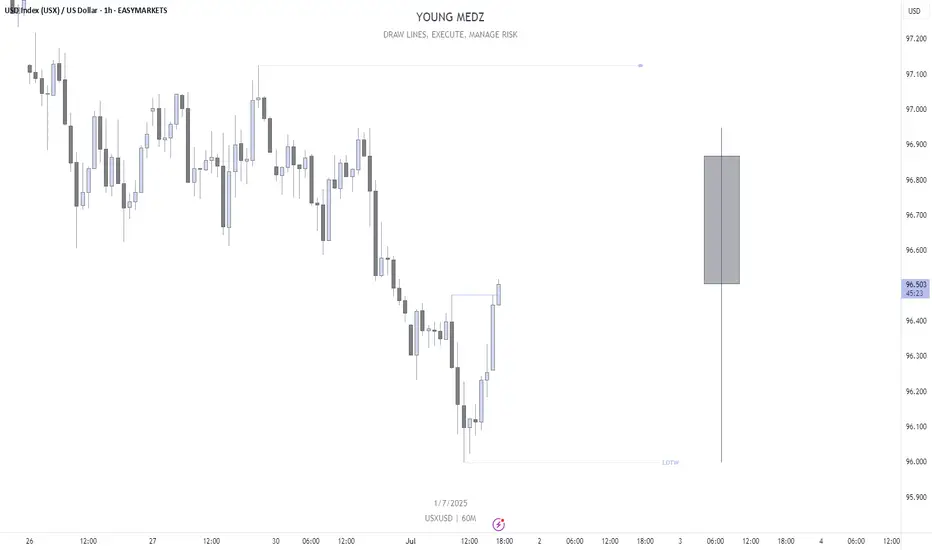
USXUSD LOTWUSXUSD LOTW Potentially In.
H1 BOS confirms this for me. Targeting H4 Internal Liquidity & Daily FVG.
Let's see.
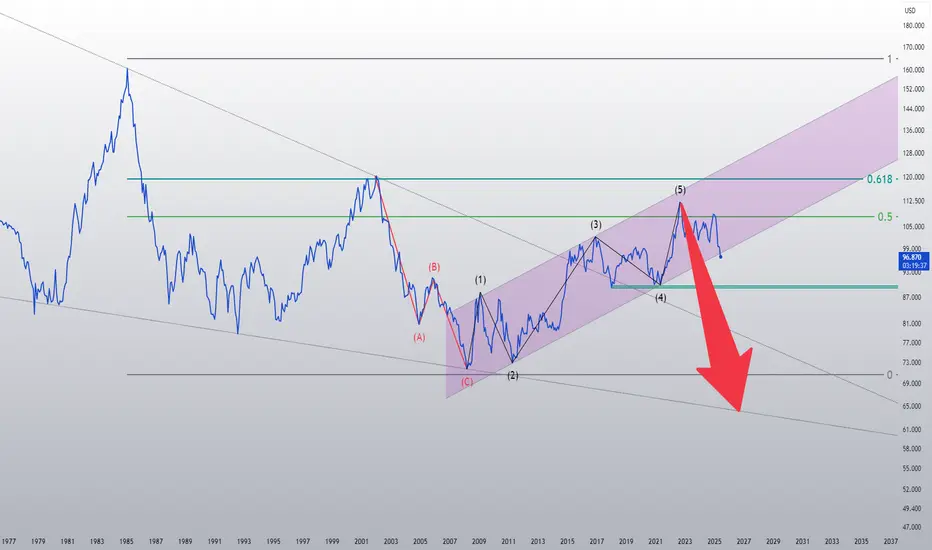
The DXY looks doomedI drew this chart in September 2022. Now, almost three years later, the DXY has broken below its channel.
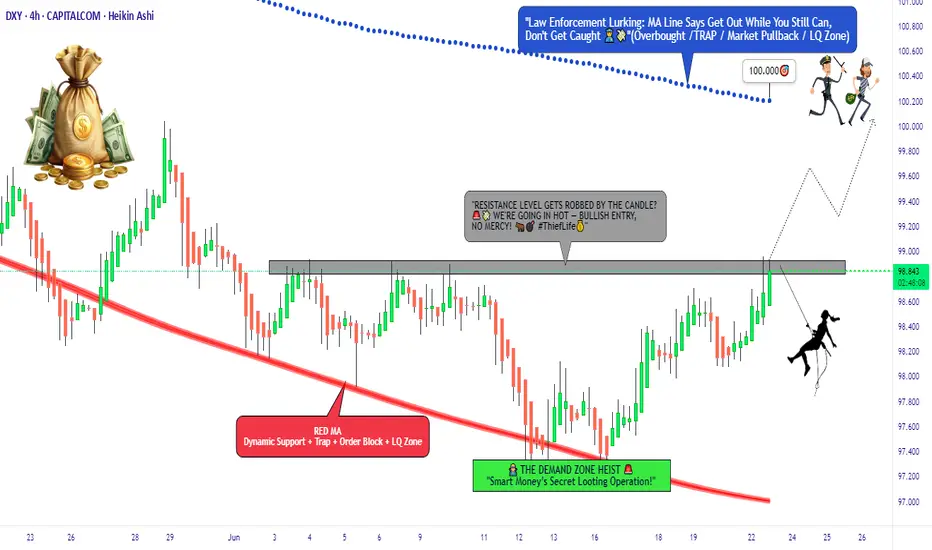
“The Dollar Job: Break-In Strategy for 99+ Profits”💸 “DXY Heist Blueprint: Thieves’ Bullish Breakout Play” 🏴☠️
🌟Hi! Hola! Ola! Bonjour! Hallo! Marhaba!🌟
Welcome, Money Makers & Silent Robbers 🕶️💼✨
This is our next big Thief Trading Heist Plan targeting the 💵 DXY Dollar Index Vault. Armed with both technical precision 🔍 and fundamental insight 📊, we're ready to strike smart — not just fast.
🎯 THE MASTER HEIST PLAN:
🟢 ENTRY POINT – “Heist Entry Protocol”
🎯 Wait for price to break above Resistance @ 99.000 and candle to close ✅
💥 Plan A: Place Buy Stop Orders just above breakout
📥 Plan B: For Pullback Pros, use Buy Limit at recent swing low/high (15m–30m TF)
📌 Tip: Set alerts — don’t get caught napping while the vault opens! ⏰🔔
🛑 STOP LOSS – “Thief’s Escape Hatch”
🧠 Use 4H swing low at 98.100 as SL
⚖️ Adjust based on your lot size and number of open positions
🚨 Don't rush to set SL for Buy Stop entries before confirmation! Patience is part of the plan. 😎
🎯 TARGET – “Mission Objective”
💰 First Exit Target: 100.000
🏃♂️ Optional: Escape earlier near high-risk zones (Blue MA Line Trap Area)
⚔️ SCALPERS' CODE – Stay Sharp!
Only scalp on the Long side.
🔐 Use Trailing SL to guard your loot!
💸 Big wallets? Jump early.
🧠 Smaller stack? Follow the swing crew for coordinated execution.
🌐 MARKET OUTLOOK: WHY THE VAULT’S OPENING
💡 Currently seeing bullish momentum in the DXY
📈 Driven by macroeconomics, sentiment shifts, and intermarket pressure
📰 Want the full debrief? Check our analysis across:
COT Data
Geopolitics & News
Macro Trends & Sentiment
Fundamental Forces
📎🔗 See full breakdown
⚠️ TRADE MANAGEMENT ALERT
🚫 Avoid opening new trades during high-impact news
🔁 Always use Trailing Stops to lock in profits
❤️ Support The Heist – Boost the Plan!
Every boost powers our underground crew 🐱👤.
We rob the markets, not the people. 💼💰
Like & Boost to help grow the Thief Trading Gang 👊💥
Stay tuned, robbers – more heist plans dropping soon.
💸🚀📈🤑
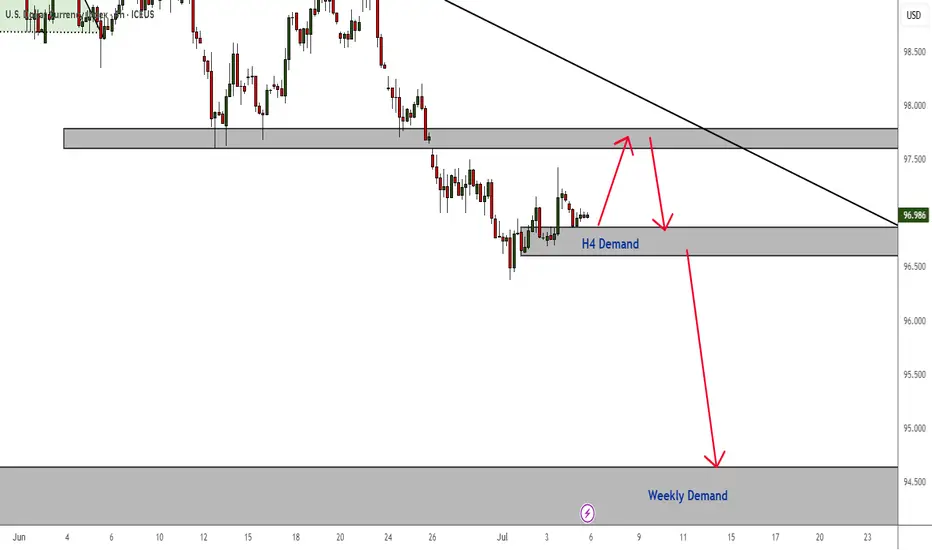
DXY Is Bearish - But A Retest is Highly ProbableThere is no denying that the overall trend is still bearish. However, price is currently respecting an H4 demand zone - which might continue to apply pressure to the upside for a minor correction.
Of course, if this correction does not happen and the H4 demand zone breaks, then we continue to ride the trend to the downside and all the way to the next weekly TF demand zone.
#TheTrendIsYourFriend
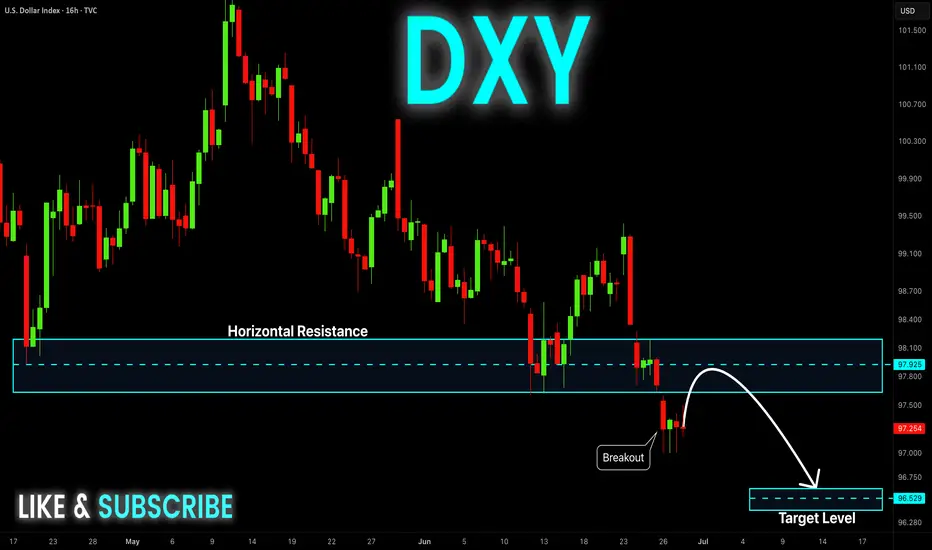
DXY Swing Short! Sell!
Hello,Traders!
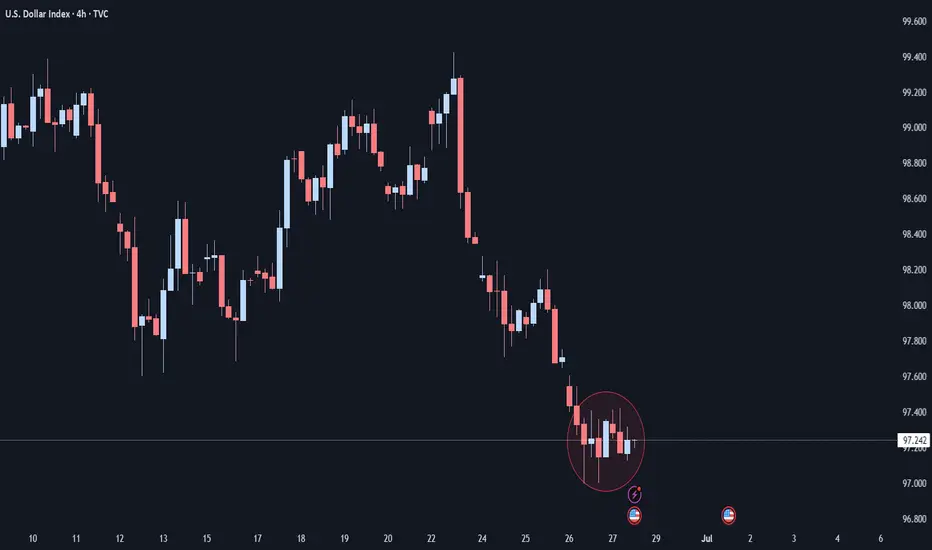
DXY keeps falling down
And the index broke the
Key wide horizontal level
Around 97.800 which is now
A resistance and the breakout
Is confirmed so we are very
Bearish biased and we will
Be expecting a bearish
Continuation on Monday
Sell!
Comment and subscribe to help us grow!
Check out other forecasts below too!
Disclosure: I am part of Trade Nation's Influencer program and receive a monthly fee for using their TradingView charts in my analysis.
Bull Flag on DailyDXY looking bullish on the daily timeframe with a bull flag noticed. Bullish confirmation candles should be looked out and confirmed before placing any long positions
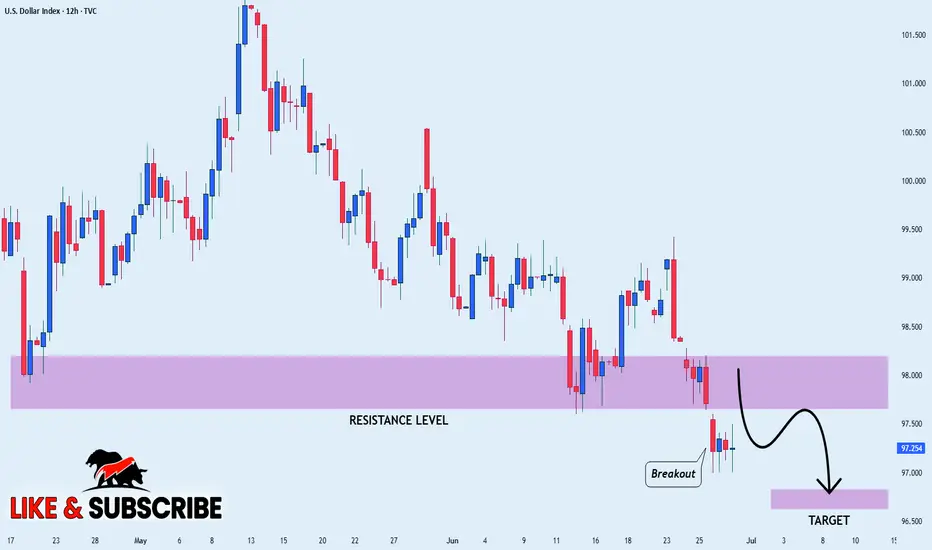
DXY STRONG DOWNTREND CONTINUES|SHORT|
✅DXY is going down currently
In a strong downtrend and the index
Broke the key structure level of 98.000
Which is now a resistance,
And after the pullback
And retest, I think the price
Will go further down next week
SHORT🔥
✅Like and subscribe to never miss a new idea!✅
Disclosure: I am part of Trade Nation's Influencer program and receive a monthly fee for using their TradingView charts in my analysis.
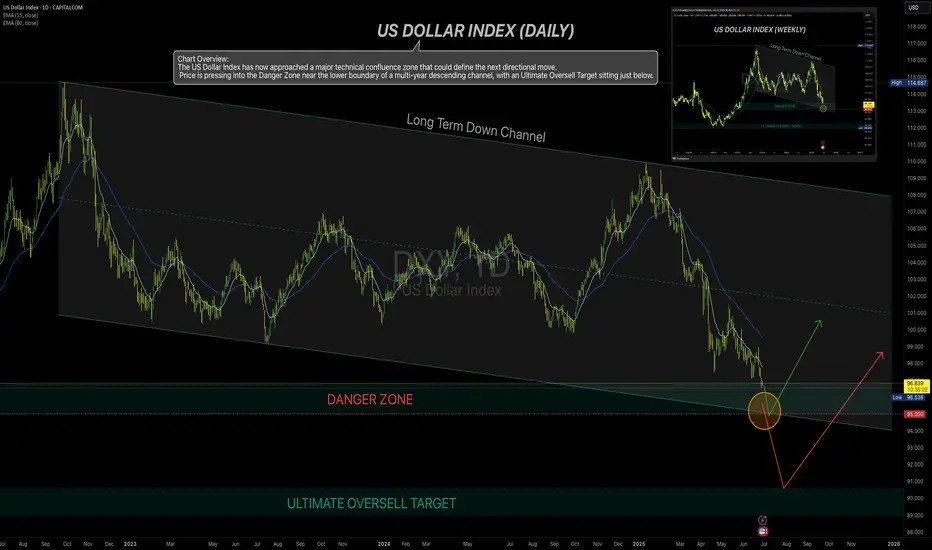
US Dollar Index (DXY) – Testing Long-Term Channel SupportBy MJTrading:
Chart Overview:
The US Dollar Index has now approached a major technical confluence zone that could define the next directional move. Price is pressing into the Danger Zone near the lower boundary of a multi-year descending channel, with an Ultimate Oversell Target sitting just below.
🔹 Key Technical Highlights:
Long-Term Down Channel (Daily & Weekly):
The DXY has respected this structure for several years.
Price is currently challenging the lower boundary, a zone where reactions often occur.
Danger Zone (~95–96):
A historically reactive area.
Prior demand and channel floor converge here.
Ultimate Oversell Target (~89–90):
Marked as a deeper potential exhaustion area if the channel fails.
Moving Averages:
15 EMA ~97.8
60 EMA ~99.3
Price remains below both EMAs, confirming persistent bearish momentum.
🔹 Potential Scenarios:
Scenario A (Green Path):
A bounce off current support could trigger a relief rally back toward 98–100, targeting the mid-channel and EMAs.
Scenario B (Red Path):
A breakdown below ~95 could accelerate selling pressure, aiming for the Ultimate Oversell Target (~89).
🔹 How I See It:
This is a high-risk inflection zone. Any bullish setups here remain counter-trend and require confirmation via strong reversal signals. Conversely, a decisive breakdown could have significant implications for USD pairs and commodities.
💡 Notes:
This chart includes the weekly inset view for broader context.
Keep risk management tight in this volatile area.
🔹 Reminder:
This idea is for educational purposes only—not financial advice.
💬 How are you positioning around the USD? Share your thoughts and charts below!
#Hashtags:
#MJTrading #DXY #USDollarIndex #Dollar #Forex #TechnicalAnalysis #TradingView #ChartAnalysis #PriceAction #FX #USD #Majors #DollarWeakness #DollarStrength #SupportAndResistance #TrendAnalysis #MarketOutlook
DXY IS BULLISHA possible upward move might take place . Looking forward to go long until resistance area . I will wait and see how it goes .
Happy Trading
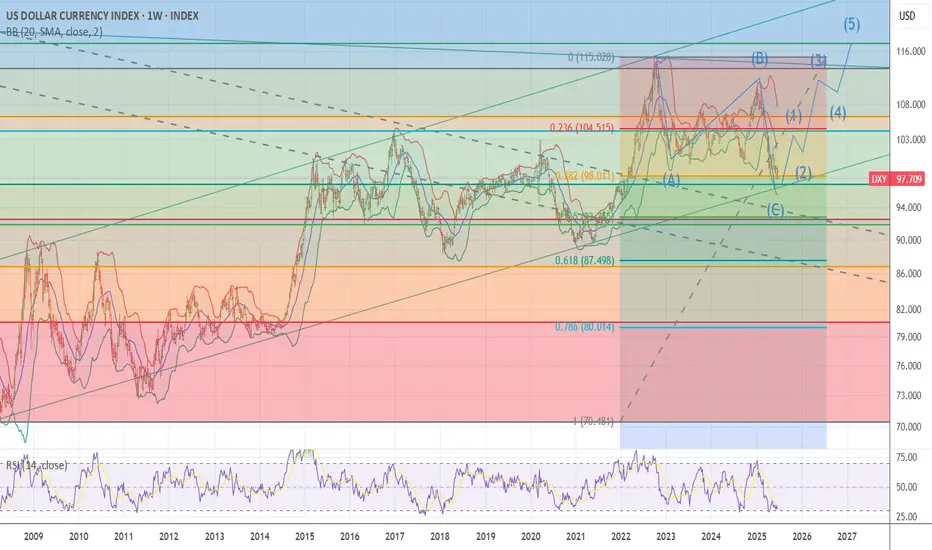
DXY I AM MOVING TO 100 % LONG DXY WAVE 4 lowThe chart posted is my view of the DXY I am as bullish now as I was at 71 .Best of TRADES WAVETIMER 96.70 to 97.6
DXY - 4H BASEUSD is creating a base just below H4 EMA9.
This is very important combination of candles. It's a setup that gives bulls hope for a bounce at least. A condition - bulls must step in NOW. Confirmation will come only when price closes above EMA 9.
Make Dollar Great AgainDXY Big Picture
While looking at other DXY charts to use a clean chart for HTF, I saw that it touched historical trend support. It didn't touch only on the TVC chart, so I am adding it with the other charts and accepting that it touched the trend.
According to the fractal I added in August last year, the price is moving very well.
I expect a correction from these areas. I think we have reached the reversal areas due to both the momentum in the declines and the oversold.
The decline fatigue I mentioned is more evident in LTF charts. The price cannot reach the EQ zone of the decline channel that has been going on since February on the daily chart. Although it is a very inclined channel on the 4h chart, it can no longer reach the channel bottom. For this reason, I think this region is where reversal should be sought. After the first 0.38 of this decline, I think a pullback to 0.5 is possible.
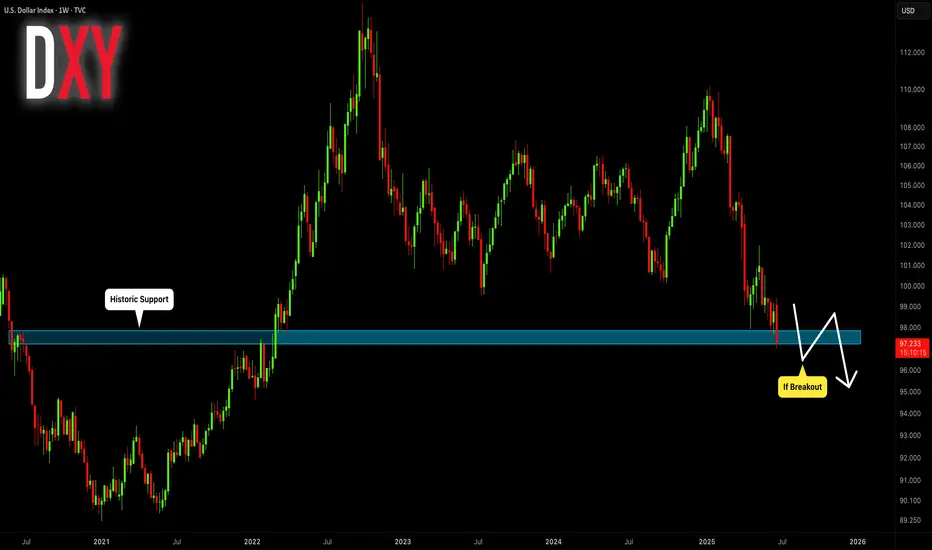
DOLLAR INDEX (DXY): Critical Moment
With an unprecedented pace of weakness of US Dollar,
DXY Index is now testing a historic weekly support cluster.
If the market breaks it today and closes below that, it will
open a potential for much more depreciation.
Next historic support will be 95.5 and a downtrend will continue.
Today's US fundamentals can be a trigger.
Please, support my work with like, thank you!
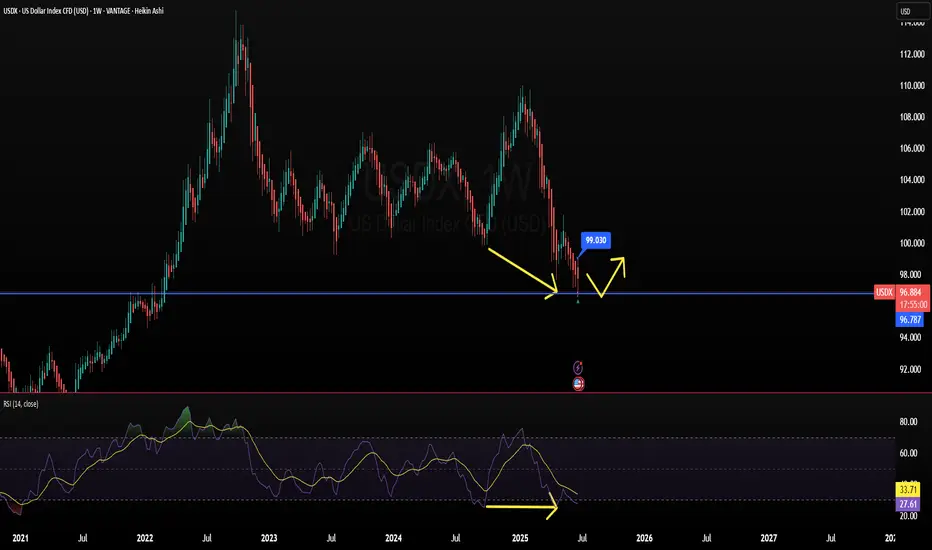
DXY Technicals Add Pressure on FED Data〽️Weekly RSI Divergence Spotted in the US Dollar Index (DXY)
A bearish divergence has emerged on the weekly RSI chart of the US Dollar Index (DXY), signaling a potential loss of upward momentum. Historically, such divergences often precede price corrections or reversals.
✅Market Implications:
USD pairs, gold, and crypto assets may see retracement as dollar strength wanes in response to technical exhaustion.
Traders should watch for signs of consolidation or reversal in assets inversely correlated with the dollar, such as gold (XAU/USD) and Bitcoin (BTC/USD).
📈Macro Outlook:
All eyes on the Federal Reserve: The divergence adds weight to market speculation that the Fed might pivot toward a rate cut at its July 15 meeting.
If confirmed, rate cuts could further pressure the dollar, accelerating moves in risk-on assets and emerging market currencies.
#XAUUSD
#DXY
#BTCUSD
#tgifx
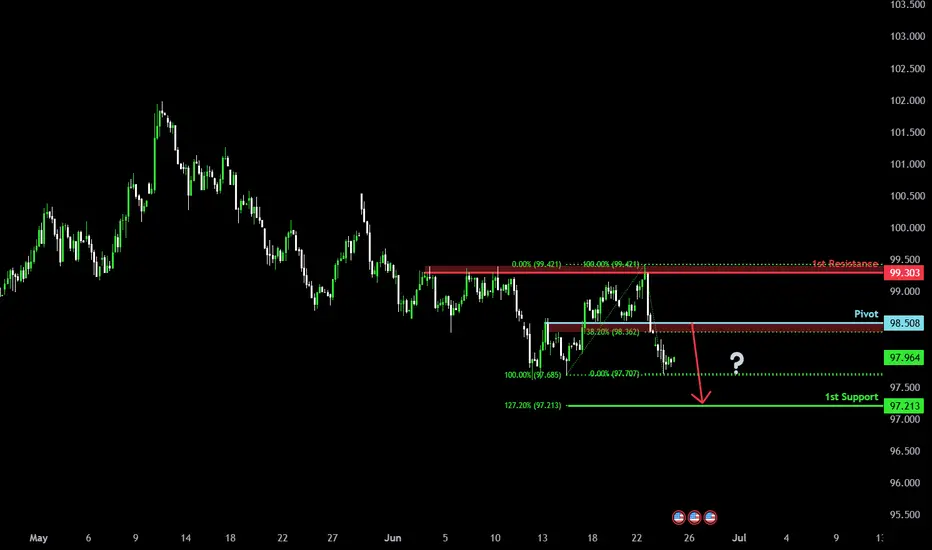
Overlap resistance ahead?The US Dollar Index (DXY) is rising towards the pivot, which is an overlap resistance and could reverse to the 1st support that lines up with the 127.2% Fibonacci extension.
Pivot: 98.50
1st Support: 97.21
1st Resistance: 99.30
Risk Warning:
Trading Forex and CFDs carries a high level of risk to your capital and you should only trade with money you can afford to lose. Trading Forex and CFDs may not be suitable for all investors, so please ensure that you fully understand the risks involved and seek independent advice if necessary.
Disclaimer:
The above opinions given constitute general market commentary, and do not constitute the opinion or advice of IC Markets or any form of personal or investment advice.
Any opinions, news, research, analyses, prices, other information, or links to third-party sites contained on this website are provided on an "as-is" basis, are intended only to be informative, is not an advice nor a recommendation, nor research, or a record of our trading prices, or an offer of, or solicitation for a transaction in any financial instrument and thus should not be treated as such. The information provided does not involve any specific investment objectives, financial situation and needs of any specific person who may receive it. Please be aware, that past performance is not a reliable indicator of future performance and/or results. Past Performance or Forward-looking scenarios based upon the reasonable beliefs of the third-party provider are not a guarantee of future performance. Actual results may differ materially from those anticipated in forward-looking or past performance statements. IC Markets makes no representation or warranty and assumes no liability as to the accuracy or completeness of the information provided, nor any loss arising from any investment based on a recommendation, forecast or any information supplied by any third-party.
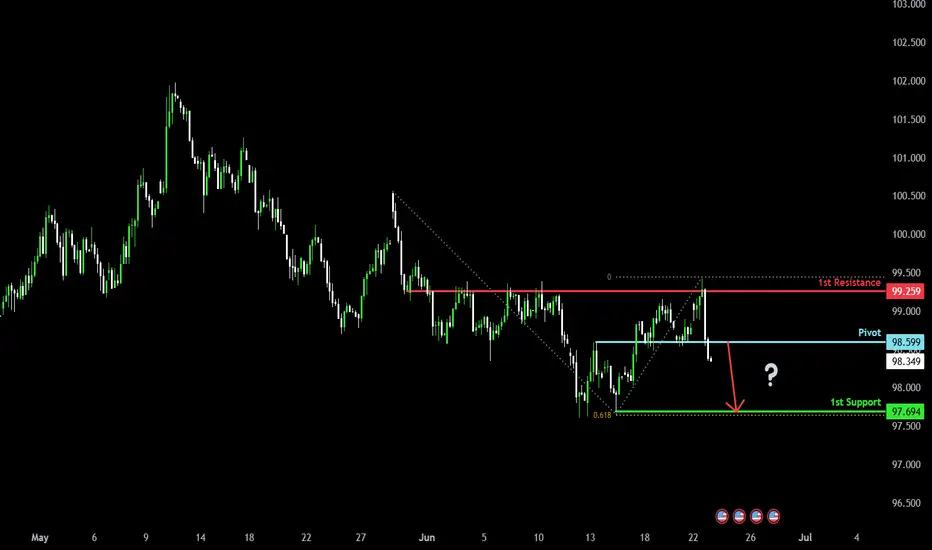
Bearish drop?US Dollar Index (DXY) has reacted off the pivot and could drop to the 1st support.
Pivot: 98.59
1st Support: 97.69
1st Resistance: 99.25
Risk Warning:
Trading Forex and CFDs carries a high level of risk to your capital and you should only trade with money you can afford to lose. Trading Forex and CFDs may not be suitable for all investors, so please ensure that you fully understand the risks involved and seek independent advice if necessary.
Disclaimer:
The above opinions given constitute general market commentary, and do not constitute the opinion or advice of IC Markets or any form of personal or investment advice.
Any opinions, news, research, analyses, prices, other information, or links to third-party sites contained on this website are provided on an "as-is" basis, are intended only to be informative, is not an advice nor a recommendation, nor research, or a record of our trading prices, or an offer of, or solicitation for a transaction in any financial instrument and thus should not be treated as such. The information provided does not involve any specific investment objectives, financial situation and needs of any specific person who may receive it. Please be aware, that past performance is not a reliable indicator of future performance and/or results. Past Performance or Forward-looking scenarios based upon the reasonable beliefs of the third-party provider are not a guarantee of future performance. Actual results may differ materially from those anticipated in forward-looking or past performance statements. IC Markets makes no representation or warranty and assumes no liability as to the accuracy or completeness of the information provided, nor any loss arising from any investment based on a recommendation, forecast or any information supplied by any third-party.
US Missiles Flyin'! Buy USD vs EUR GBP AUD NZD CAD CHF JPY!This is the FOREX futures outlook for the week of Jun 22-28th.
In this video, we will analyze the following FX markets:
USD Index, EUR, GBP, AUD, NZD, CAD, CHF, and JPY.
The USD is the world's reserve currency. When there are geo-political hot spots in the world, the USD sees inflows from investors. In light of US strikes against Iranians nuke sites last night, buying the USD versus other currencies is prudent and wise.
The USD should see more gains as long as the current tensions are high. If Iran comes back to the negotiations table, then the environment switches back to a risk on scenario, where the outflows from the USD go back into riskier assets like the stock market.
Enjoy!
May profits be upon you.
Leave any questions or comments in the comment section.
I appreciate any feedback from my viewers!
Like and/or subscribe if you want more accurate analysis.
Thank you so much!
Disclaimer:
I do not provide personal investment advice and I am not a qualified licensed investment advisor.
All information found here, including any ideas, opinions, views, predictions, forecasts, commentaries, suggestions, expressed or implied herein, are for informational, entertainment or educational purposes only and should not be construed as personal investment advice. While the information provided is believed to be accurate, it may include errors or inaccuracies.
I will not and cannot be held liable for any actions you take as a result of anything you read here.
Conduct your own due diligence, or consult a licensed financial advisor or broker before making any and all investment decisions. Any investments, trades, speculations, or decisions made on the basis of any information found on this channel, expressed or implied herein, are committed at your own risk, financial or otherwise.

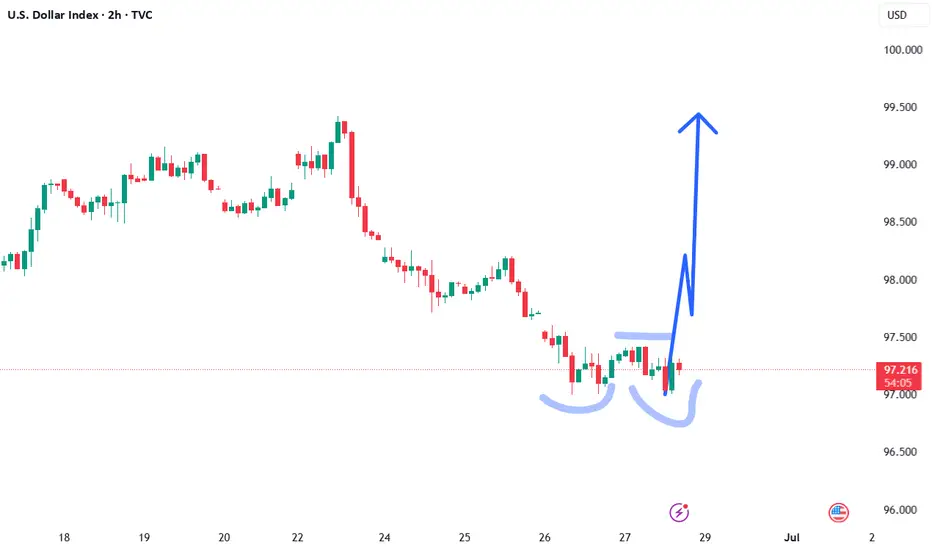
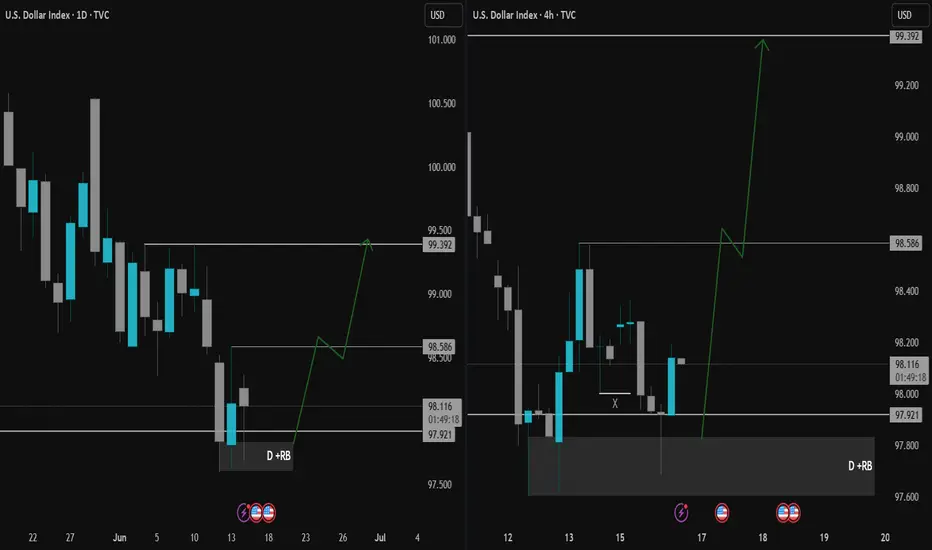
DXY Market Outlook: Eyes on 99.392Hello Traders,
DXY found buyers at the 97.921 level we tracked last week and managed to close daily candles above this level. We can now refer to this area as a rejection block (D + RB). This week, the block was retested and encountered rejection from buyers.
With this buyer reaction, our target is the peak level of the consolidation that brought the price here (99.392).
There's a minor level to watch along the way: 98.586. However, considering the key level where the price reacted and the weekly chart showing no major obstacles ahead, we believe that targeting the peak of the consolidation that initiated the last decline (99.392) is the more suitable approach.
Taking news data into account—and more importantly, geopolitical factors and unexpected developments—we still acknowledge the possibility of the price sweeping the low again. However, we don’t expect this to invalidate the overall scenario. With news catalysts, we anticipate the price reaching the target within the week.
Until the next update, wish you many pips!
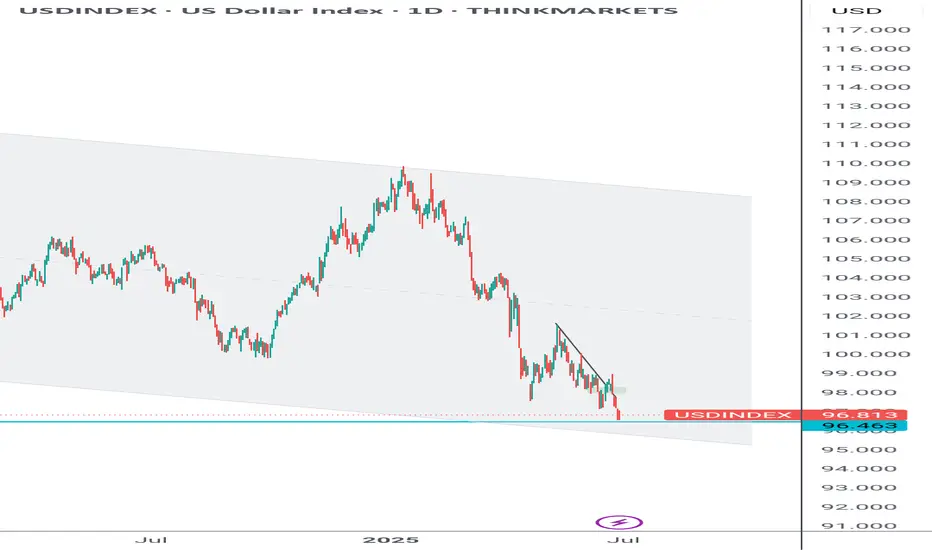
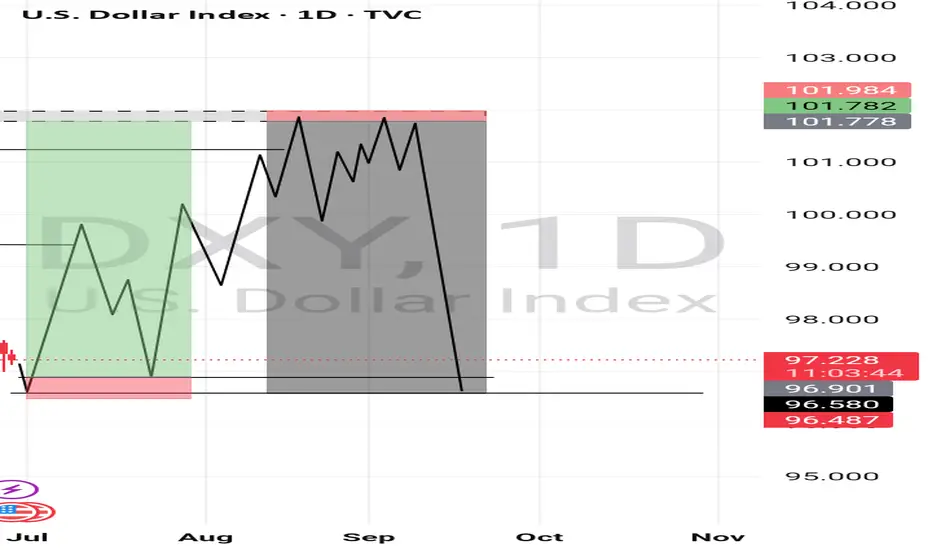
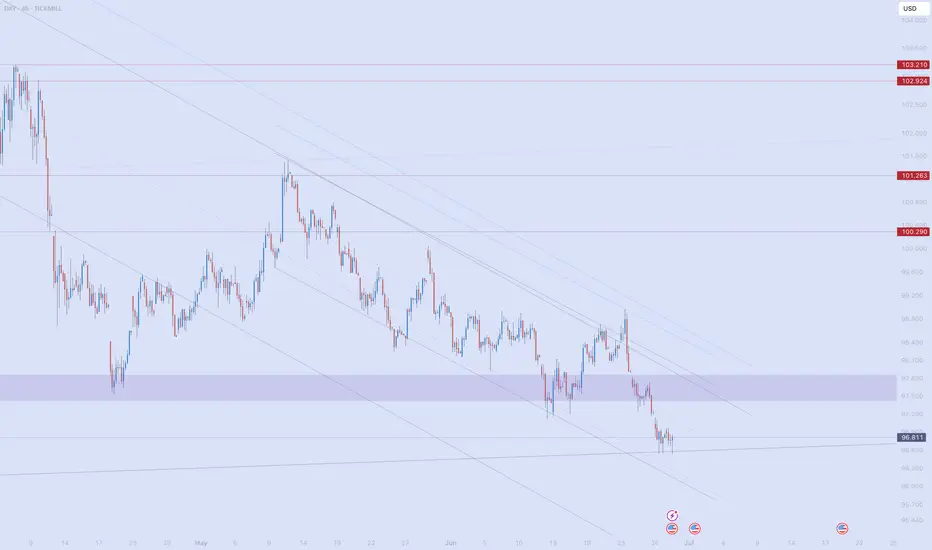
DXY Short-term rebound quite likely.The U.S. Dollar index (DXY) has been trading within almost a 3-year Channel Down, which has assisted us in choosing the right levels to sell high and buy low.
Despite being now on its 2nd major Bearish Leg, we see a short-term bounce possibly up to August quite likely based on the previous major Bearish Leg. As you see, the current setup resembles the April 13 023 Low after which the price rebounded short-term just above the 0.786 Fibonacci level, only to get rejected later and complete the bottom on the 1.1 Fib extension.
Even the 1W RSI sequences between the two fractals are identical. Therefore, before diving below 96.000, we believe a 100.000 test is quite likely.
-------------------------------------------------------------------------------
** Please LIKE 👍, FOLLOW ✅, SHARE 🙌 and COMMENT ✍ if you enjoy this idea! Also share your ideas and charts in the comments section below! This is best way to keep it relevant, support us, keep the content here free and allow the idea to reach as many people as possible. **
-------------------------------------------------------------------------------
💸💸💸💸💸💸
👇 👇 👇 👇 👇 👇

Outlook for Trump's Second TermExpecting price to retest the bottom descending channel and return to the moving averages next year. From there, price will likely rebound hard and surge back upwards to continue the muti-decade ascent.
