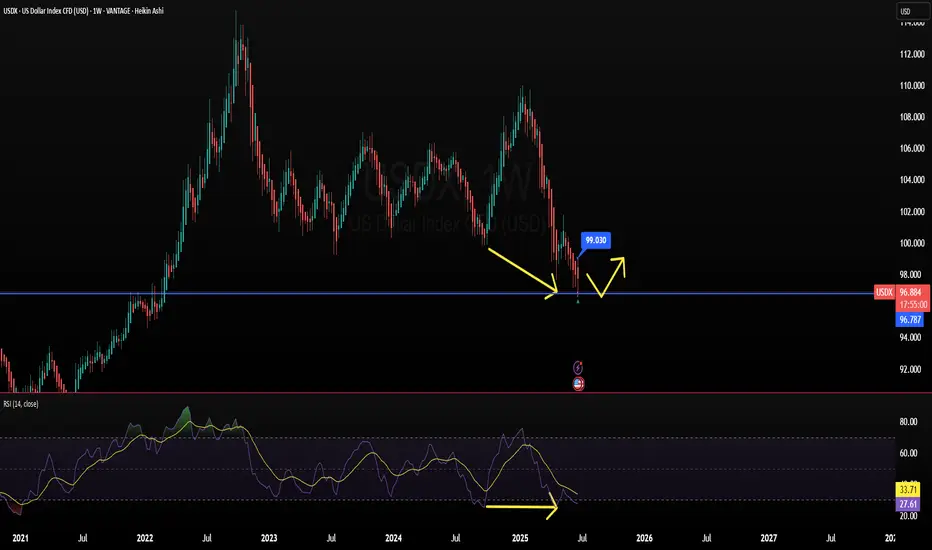
DXY Technicals Add Pressure on FED Data〽️Weekly RSI Divergence Spotted in the US Dollar Index (DXY)
A bearish divergence has emerged on the weekly RSI chart of the US Dollar Index (DXY), signaling a potential loss of upward momentum. Historically, such divergences often precede price corrections or reversals.
✅Market Implications:
USD pairs, gold, and crypto assets may see retracement as dollar strength wanes in response to technical exhaustion.
Traders should watch for signs of consolidation or reversal in assets inversely correlated with the dollar, such as gold (XAU/USD) and Bitcoin (BTC/USD).
📈Macro Outlook:
All eyes on the Federal Reserve: The divergence adds weight to market speculation that the Fed might pivot toward a rate cut at its July 15 meeting.
If confirmed, rate cuts could further pressure the dollar, accelerating moves in risk-on assets and emerging market currencies.
#XAUUSD
#DXY
#BTCUSD
#tgifx
USDX trade ideas
Bull Flag on DailyDXY looking bullish on the daily timeframe with a bull flag noticed. Bullish confirmation candles should be looked out and confirmed before placing any long positions
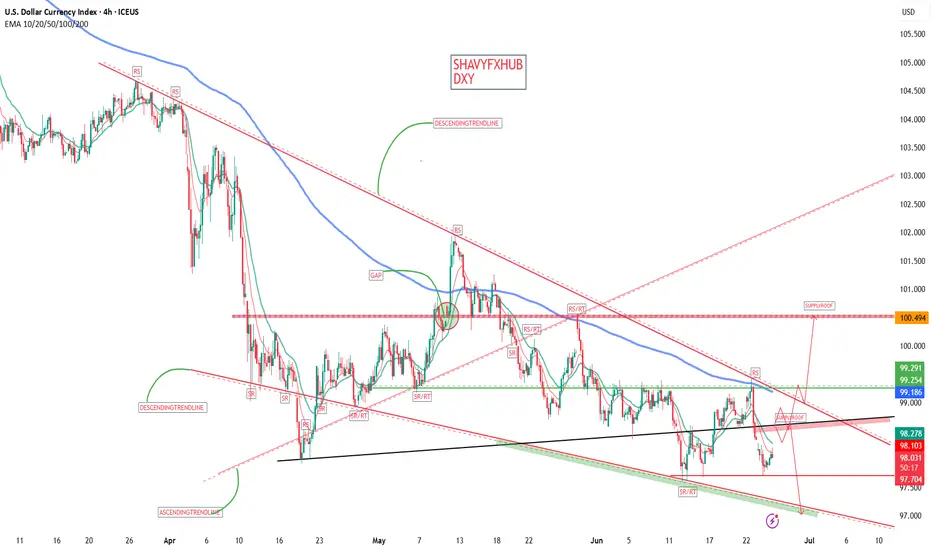
DOLLAR INDEX the US Dollar Index (DXY) is trading around 97.704 -98.572,0.34% . The index has been under pressure due to easing geopolitical tensions ,Particularly optimism about a ceasefire between Israel and Iran and expectations of Federal Reserve rate cuts later in the year. The DXY remains below its 100-day,200 day exponential moving average (EMA), 100day, 200 day simple moving average with bearish momentum supported by interest rate hold and expected rate cut before the end of the year.
the 10 year united states bond yield is trading around 4.279%-4.324%,we have seen gold sell off at 3336-3334 on dollar rally.
Market Outlook:
The DXY is attempting to stabilize but remains in a bearish phase until it decisively breaks above 100 resistance.
the future of the dollar index is depending on Fed policy and global economic conditions.
Summary:
The DXY is currently weak around 97.88 -98.00 due to easing geopolitical risks and Fed rate cut expectations.
Bearish momentum dominates below the 100-day EMA, 200-day EMA, 100-day SMA AND 200 day SMA
A break above 100 would be needed to signal a bullish reversal, if the retest to broken supply at 100 could become demand floor .
#dxy
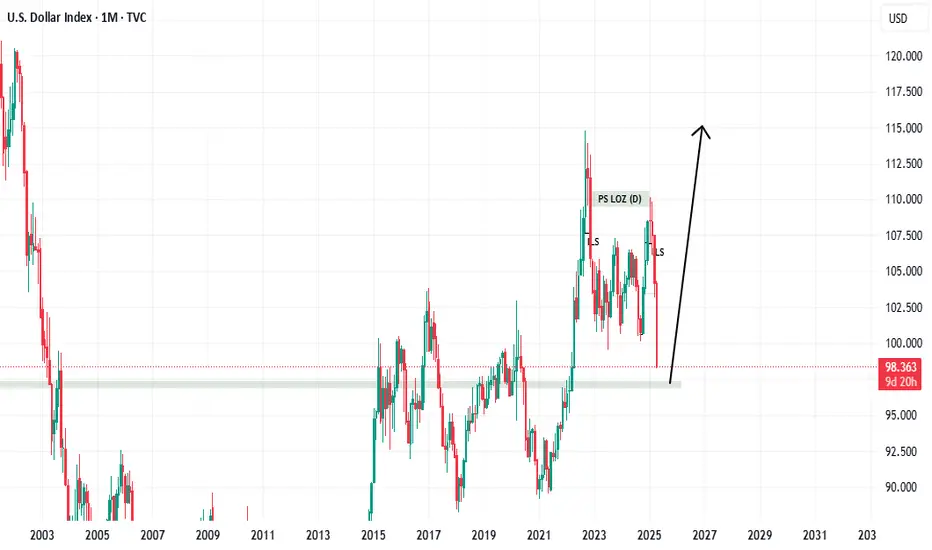
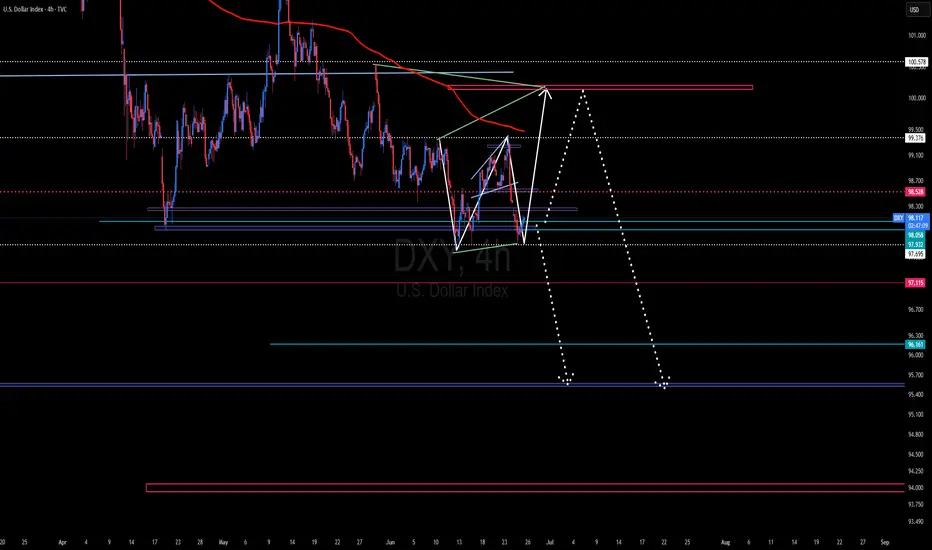
Make Dollar Great AgainDXY Big Picture
While looking at other DXY charts to use a clean chart for HTF, I saw that it touched historical trend support. It didn't touch only on the TVC chart, so I am adding it with the other charts and accepting that it touched the trend.
According to the fractal I added in August last year, the price is moving very well.
I expect a correction from these areas. I think we have reached the reversal areas due to both the momentum in the declines and the oversold.
The decline fatigue I mentioned is more evident in LTF charts. The price cannot reach the EQ zone of the decline channel that has been going on since February on the daily chart. Although it is a very inclined channel on the 4h chart, it can no longer reach the channel bottom. For this reason, I think this region is where reversal should be sought. After the first 0.38 of this decline, I think a pullback to 0.5 is possible.
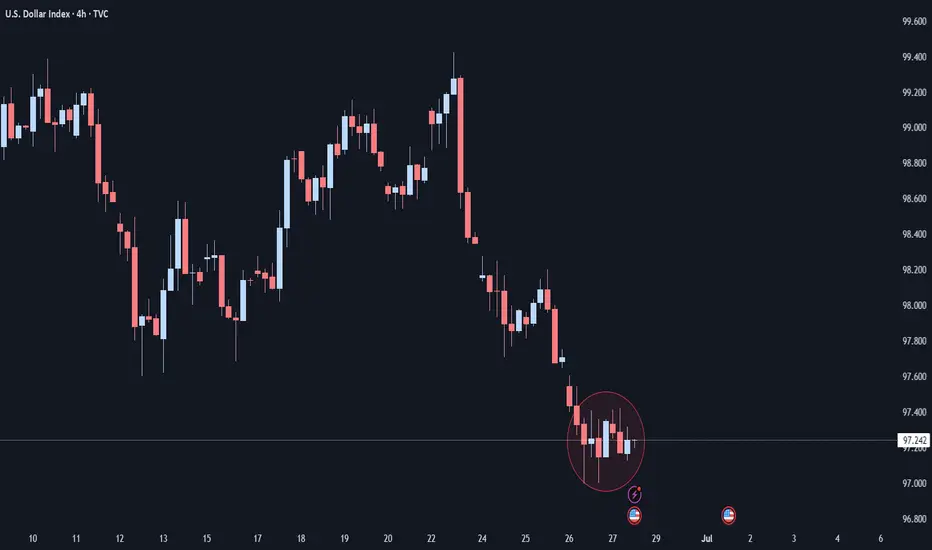
DXY - 4H BASEUSD is creating a base just below H4 EMA9.
This is very important combination of candles. It's a setup that gives bulls hope for a bounce at least. A condition - bulls must step in NOW. Confirmation will come only when price closes above EMA 9.
Long term Long!Hello all. as you see my last Long term forecast was exact and I think it is time to go up. it is risky.(wink)
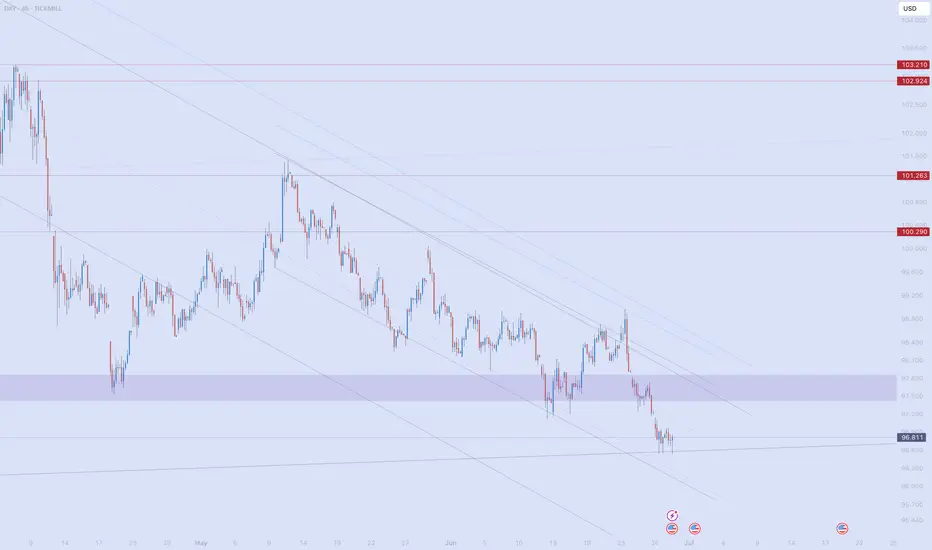
Dollar Index Bearish to $96 (UPDATE)I posted this DXY sell thesis yesterday for you all while price was still at $97.70. Since then sellers have taken out the previous Wave 3 low, creating a new daily low today at $96.90📉
We still have more downside yet to come towards our $96.60 target. So, use this 'DXY Sell Thesis' to help you with your trading, so once you can use this as a confluence to buy inverse correlated markets
DXY ready to push upThe first trade got stopped out. Entered too early.
There is nothing stopping us now.
This means that we sell EURUSD, GBPUSD etc
Enjoy
DXY: Strong Bullish Sentiment! Long!
My dear friends,
Today we will analyse DXY together☺️
The price is near a wide key level
and the pair is approaching a significant decision level of 96.899 Therefore, a strong bullish reaction here could determine the next move up.We will watch for a confirmation candle, and then target the next key level of 97.077.Recommend Stop-loss is beyond the current level.
❤️Sending you lots of Love and Hugs❤️
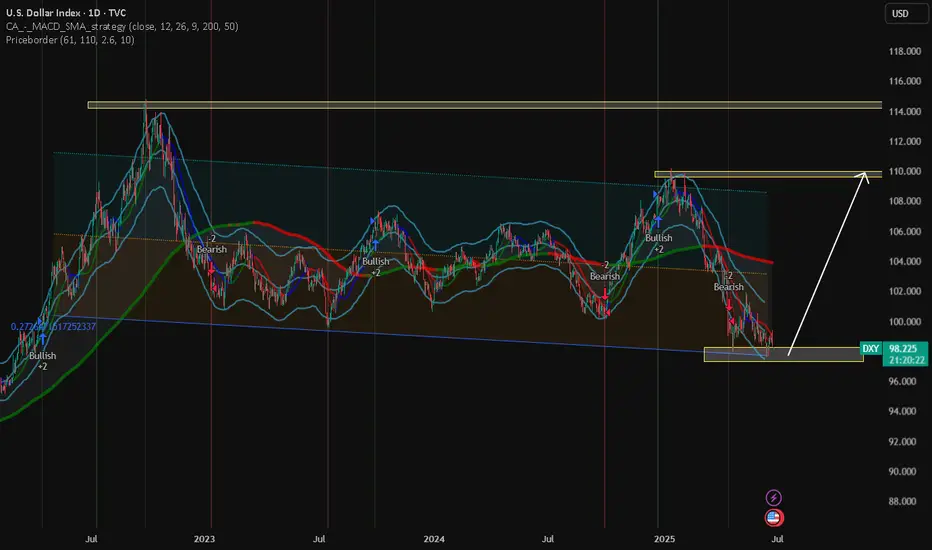
DXY hello trader, the price of DXY has reached major support level, price will likely reverse after fully liquid sweep on bearish side in daily tf... price could test the 97.7 in 1hr tf, so look for proper reversal in lower tf also, however weekly handle already did liquidity sweep of previous weekly candle. overall the target is 110 for now or could breakout.. price above 200ma will be a good sign of bullish momentum..
good luck to all
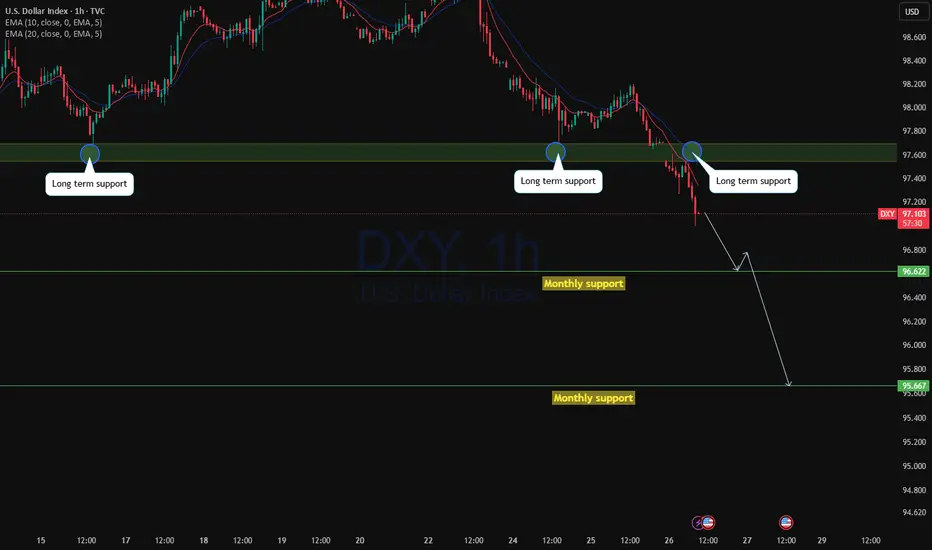
Free fall on DXY?With gap open at 97.66 level before the monthly close price has broken the monthly support and started to drop. We may see the price to drop to long term monthly support at 96.622 or further below to 95.66 as with the increased bearish pressure we may see the price to continue to drop to this longer term support level.
As with upcoming USD news we may see the price to move to this level with high probability bearish trend.
DXY 4Hr And Daily Bearish ( A minor & aslight bull trend)The DXY (US Dollar Index) could potentially rise to the 100.257 level to complete a bullish structure or flag pattern. However, it's also possible that it may face rejection around its current zone and resume its bearish trend, targeting support levels between 99.00 and 98.25.
As always, our entries should be guided by what the market and its structure are showing us. For now, the broader trend for the DXY remains bearish until it potentially reaches the lower support zone around 96.00 – 94.00, or even below that range.
This extended downside expectation is driven by several fundamental factors: anticipations of interest rate cuts in the coming months, potential tax policy changes under Trump, and persistent inflation concerns within the U.S. economy.
In light of these uncertainties, the market demands extra caution at this stage.
Good luck and trade safe!
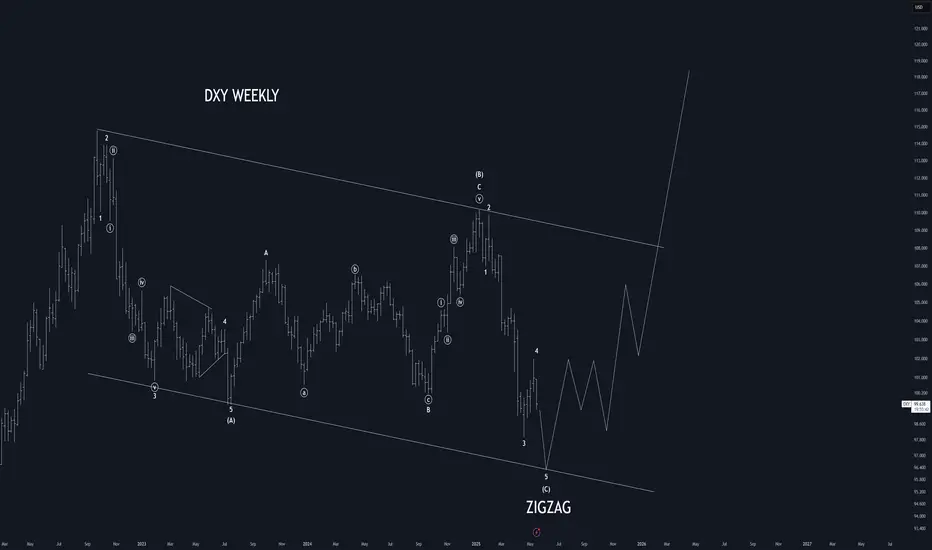
DXY Elliott Wave AnalysisThe dollar is finishing a corrective pattern. A good trade opportunity will present itself shortly. Stay tuned for updates.
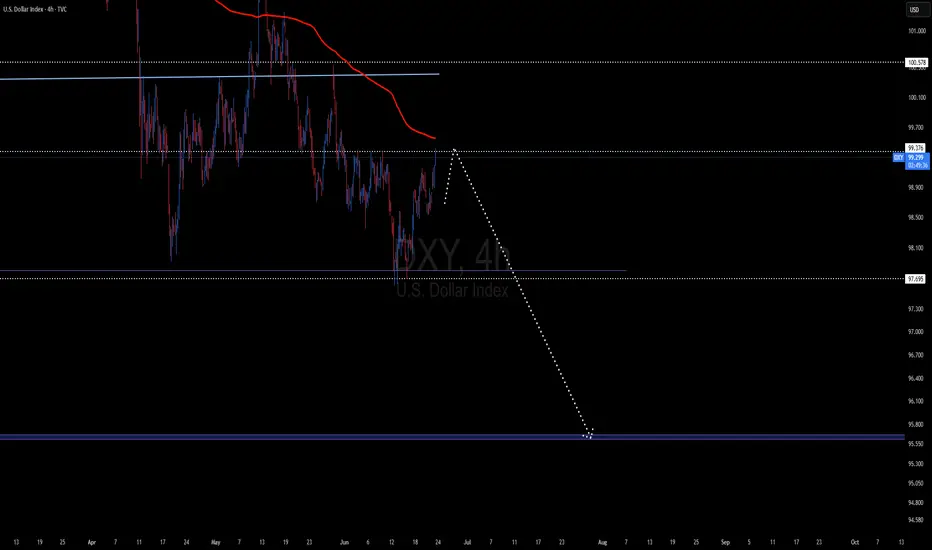
DXY Daily And 4hr chart analaysis The DXY remains in a bearish trend and is expected to continue declining toward the 99.442 level. From there, a potential reversal could occur, with a projected target around 95.75. However, while I anticipate the index may reach that level, there’s also a realistic possibility it could reverse earlier around the 96.00 area and resume a bullish trend from that point.
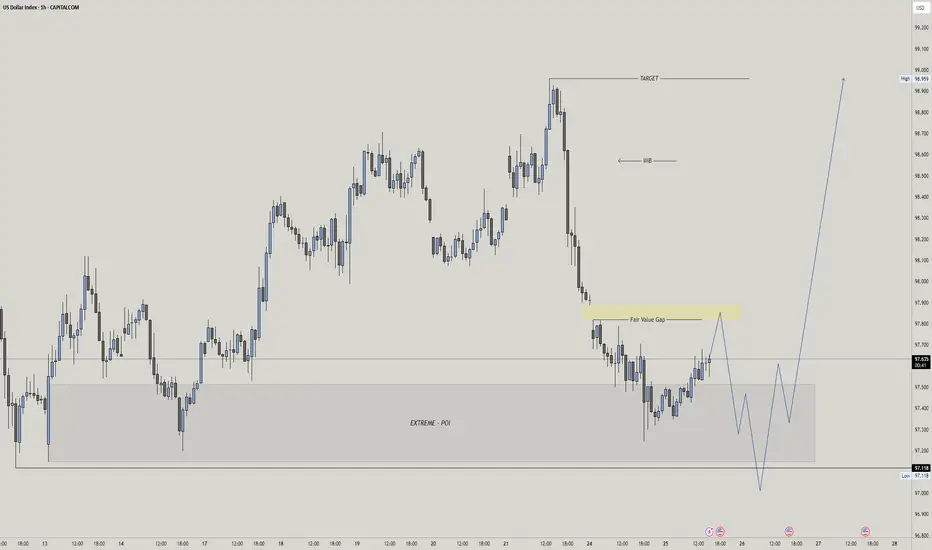
DXY Liquidity Sweep Into POI Before Bullish Expansion 🔍 Key Levels & Zones
Extreme POI: Price is approaching a major demand zone (marked as EXTREME - POI), expecting reaction from this area.
Fair Value Gap (FVG): Price recently filled a small FVG at ~97.75 before pulling back.
Target: Implied move towards 98.95 area after internal liquidity is swept.
Scenario
Price tapped into the FVG and showed reaction — but no shift yet.
Anticipating liquidity sweep of recent lows into the Extreme POI (~97.11).
If bullish reaction confirms from POI, expecting strong move to:
Reclaim FVG
Break above IMB
Reach target zone at 98.95
🧠 Confluences
50 EMA resistance aligning with FVG — short-term sell pressure.
Classic Wyckoff accumulation schematic potential in POI zone.
Liquidity below marked lows for smart money grab.
⚠️ Invalidation
If price breaks and holds below 97.00 with bearish structure, bullish scenario is invalid.
Bias: Short-term bearish, then bullish continuation.
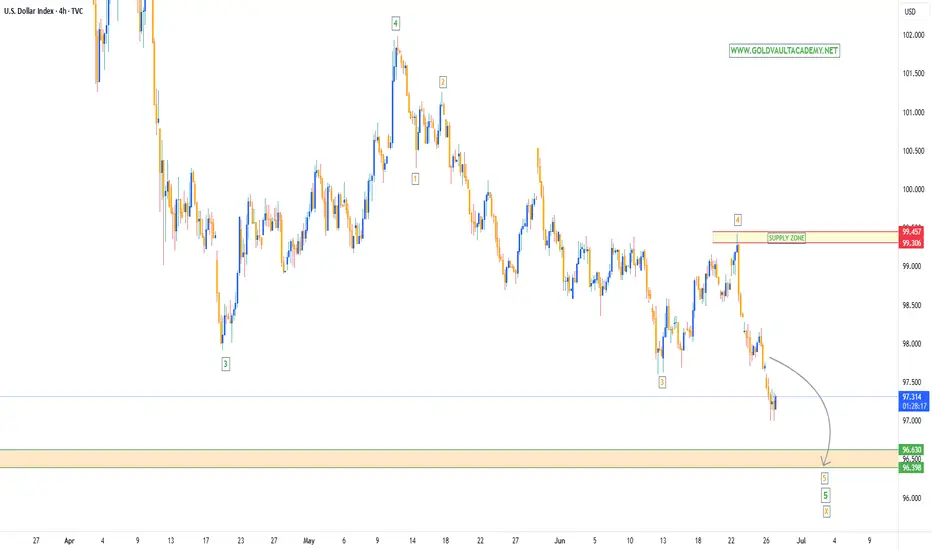
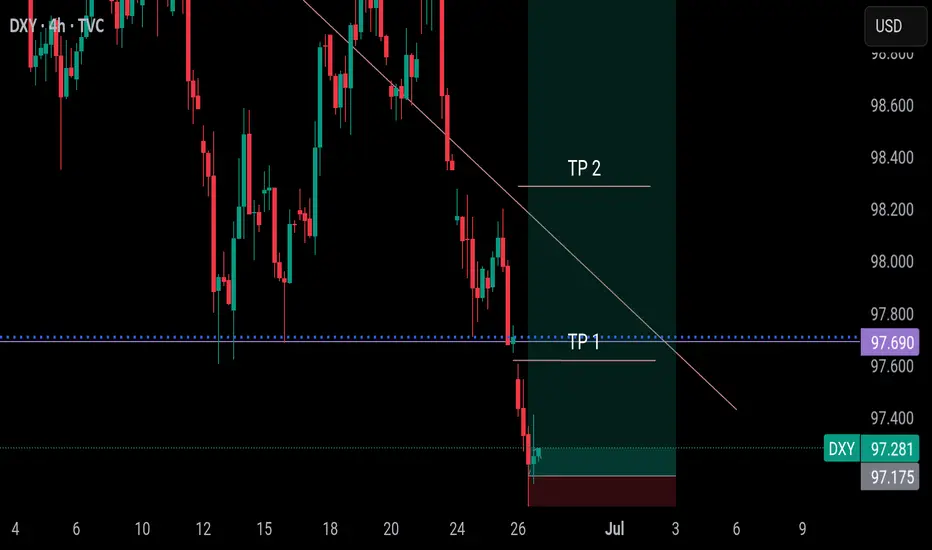
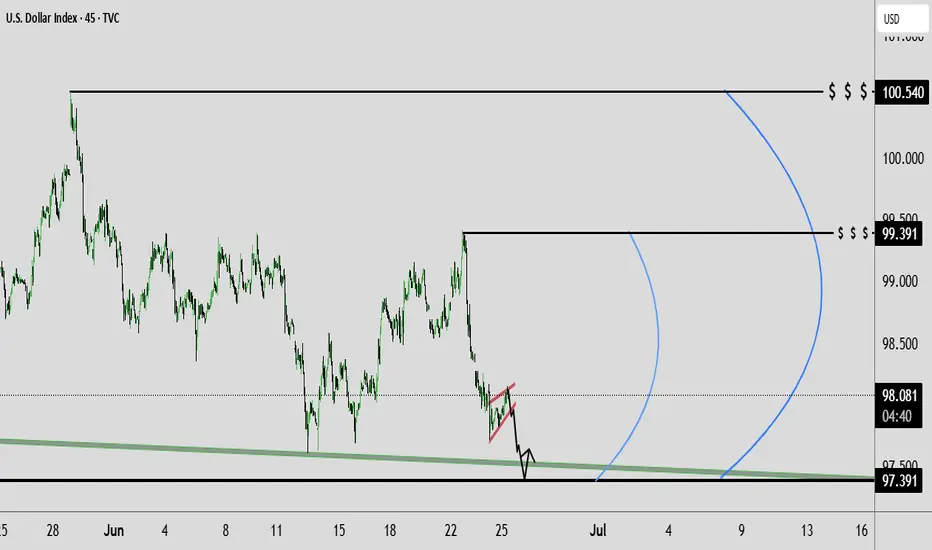
Dollar Index Analysis: Wedge + Powell Outlook – June 25, 2025📉 Technical Outlook: Bearish Rising Wedge + Liquidity Sweep Setup
TVC:DXY The Dollar Index (DXY) is currently trading within a rising wedge pattern, typically a bearish structure. We're anticipating a fake breakdown, potential sweep of the key demand zone, followed by a reversal move targeting key highs.
🔍 Key Technical Zones
📥 Demand Zone (Buy Area):
🔵 97.50 – 97.20 = Institutional accumulation + unfilled orders
🚫 Invalidation Level (Stop-Loss) :
❌ 96.70 = Clean break below confirms full bearish continuation
🎯 Target Projections (Upside Levels) :
TP1: 99.00
TP2: 100.00
TP3: 101.04 (HTF swing high liquidity cleanout)
🧠 Summary Setup :
Downtrend
Rising wedge formation
Sweep of 97.20 possible
Watch for fakeout & reversal play toward 101.04
🏛️ Fundamental Analysis – Powell’s Testimony Insights
Fed Chair Powell highlighted the following during his recent testimony:
🔄 “We’re not there yet on inflation” — Core services remain sticky
🛑 No immediate rate cuts — Growth is slowing but not crashing
🕰 Rate cuts likely postponed to Q4 2025
🔐 “Real rates are restrictive enough” = No more hikes expected
💡 Implication for DXY :
✅ Short-term bullish bias as higher U.S. yields remain attractive if rate cuts are delayed.
🌍 Macro Context Snapshot (as of June 25, 2025)
🇺🇸 US Disinflation: CPI & PCE easing, but not collapsing
🇪🇺 ECB Cut in June: Euro may weaken further
🇯🇵 BOJ Policy Unclear: USD/JPY likely volatile
🌐 Global Risk Appetite High: Volatility may return with geopolitical events
🔥 Watch This: Trade Tariff Narrative Heating Up
🚨 New U.S. Tariff Signals on Chinese tech and EU autos are resurfacing. This could:
Push inflation risk higher
Delay Fed’s easing timeline
Add support to USD short term as markets price in geopolitical tension and uncertainty
📌 Trading Strategy Recap :
Monitor wedge support near 97.20
Look for fakeout/sweep and bullish reversal
Target 99–101 zone on rebound
Stay alert to Powell/Fed rhetoric + tariff news
If you find this analysis helpful, Like, Comment, and Follow for more DXY, gold, and macro trades!
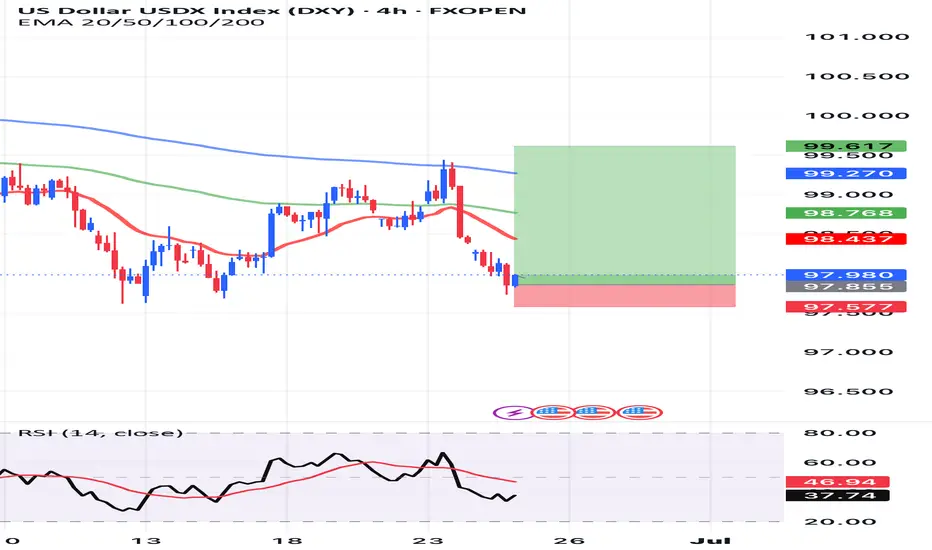
USD Bears Show Big Response to Rate Cut TalkThe bearish trend in USD has run for most of this year so far, and this has happened even as many members of the Fed refrain from talking up possible rate cuts. Last week, Jerome Powell once again reiterated that he thought tariffs would produce inflation, and he seemed to dismiss the forecasts that indicated two possible rate cuts in 2025.
Another inflationary factor showed with geopolitical risk, as tensions between the U.S. and Iran threatened to impact oil prices. And given how most consumer products in the U.S. transport via trucks, that could produce vulnerability to inflation from higher oil prices.
But, so far, we've seen a 'buy the rumor, sell the news' phenomenon around that, as Iran's retaliation hasn't seemed to excite markets, with oil prices heading lower after the attack. We've also seen the bid that drove the USD after the weekly open evaporate, and the daily bar is currently showing as a bearish engulfing candlestick.
There's quite a bit of U.S. drive from the calendar for this week including speeches from Jerome Powell along with numerous other Fed members. Friday brings the Fed's preferred inflation gauge, and sellers, at this point, seem to have an open door to make a run at the lows in USD. - js
Dollar Monthly CLS I Model 1 I Reversal I DOBHey, Market Warriors, here is another outlook on this instrument
If you’ve been following me, you already know every setup you see is built around a CLS Footprint, a Key Level, Liquidity and a specific execution model.
If you haven't followed me yet, start now.
My trading system is completely mechanical — designed to remove emotions, opinions, and impulsive decisions. No messy diagonal lines. No random drawings. Just clarity, structure, and execution.
🧩 What is CLS?
CLS is real smart money — the combined power of major investment banks and central banks moving over 6.5 trillion dollars a day. Understanding their operations is key to markets.
✅ Understanding the behavior of CLS allows you to position yourself with the giants during the market manipulations — leading to buying lows and selling highs - cleaner entries, clearer exits, and consistent profits.
📍 Model 1
is right after the manipulation of the CLS candle when CIOD occurs, and we are targeting 50% of the CLS range. H4 CLS ranges supported by HTF go straight to the opposing range.
"Adapt what is useful, reject what is useless, and add what is specifically your own."
— David Perk aka Dave FX Hunter ⚔️
👍 Hit like if you find this analysis helpful, and don't hesitate to comment with your opinions, charts or any questions.
DXYThe DXY (U.S. Dollar Index) measures the strength of the U.S. dollar against a basket of major world currencies — mainly the euro, yen, pound, Canadian dollar, Swedish krona, and Swiss franc.
What it tells you:
• If DXY rises → The dollar is getting stronger overall.
• If DXY falls → The dollar is weakening.
Why DXY matters:
• It reflects global demand for the U.S. dollar.
• It reacts to U.S. interest rate decisions, inflation data, recession fears, geopolitical tensions, etc.
• Traders and investors use it to gauge the dollar’s trend — helping in decisions like shorting EUR/USD, buying gold, or trading commodities.
DXY BULLISH MOMENTUM ABOUT TO BEGIN !The recent price action shows lower highs and lower lows, indicating a bearish market structure. The latest move bounced slightly off the 98 level, suggesting it is being respected as support, further US attacked Iran called successful operation which in my opinion could give a boost to DXY . watch tightly !
TA BY MIRZA

Short Term USD Strength This Week! Sell The Majors?This is the FOREX futures outlook for the week of Jun 8 - 12th.
In this video, we will analyze the following FX markets:
USD Index, EUR, GBP, AUD, NZD, CAD, CHF, and JPY.
USD gained some strength on Friday's job data. Talks with China this week may add to it. But I believe the bullishness will be short term.
Look for valid sells in EUR and GBP. Be cautious with AUD and NZD. CAD and CHF will also offer opportunities to sells.
CPI Data due Wed, making that day and the days that follow potentially the best trading days this week.
Enjoy!
May profits be upon you.
Leave any questions or comments in the comment section.
I appreciate any feedback from my viewers!
Like and/or subscribe if you want more accurate analysis.
Thank you so much!
Disclaimer:
I do not provide personal investment advice and I am not a qualified licensed investment advisor.
All information found here, including any ideas, opinions, views, predictions, forecasts, commentaries, suggestions, expressed or implied herein, are for informational, entertainment or educational purposes only and should not be construed as personal investment advice. While the information provided is believed to be accurate, it may include errors or inaccuracies.
I will not and cannot be held liable for any actions you take as a result of anything you read here.
Conduct your own due diligence, or consult a licensed financial advisor or broker before making any and all investment decisions. Any investments, trades, speculations, or decisions made on the basis of any information found on this channel, expressed or implied herein, are committed at your own risk, financial or otherwise.

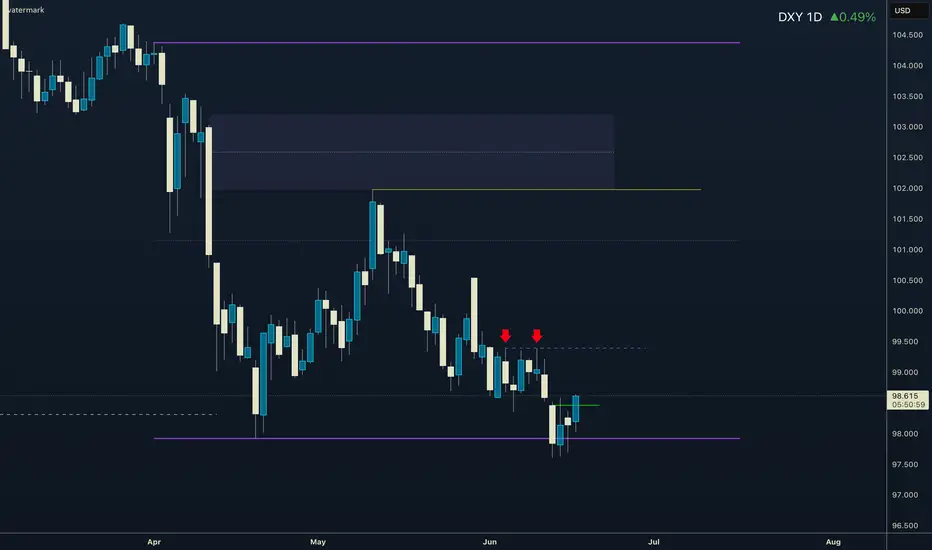
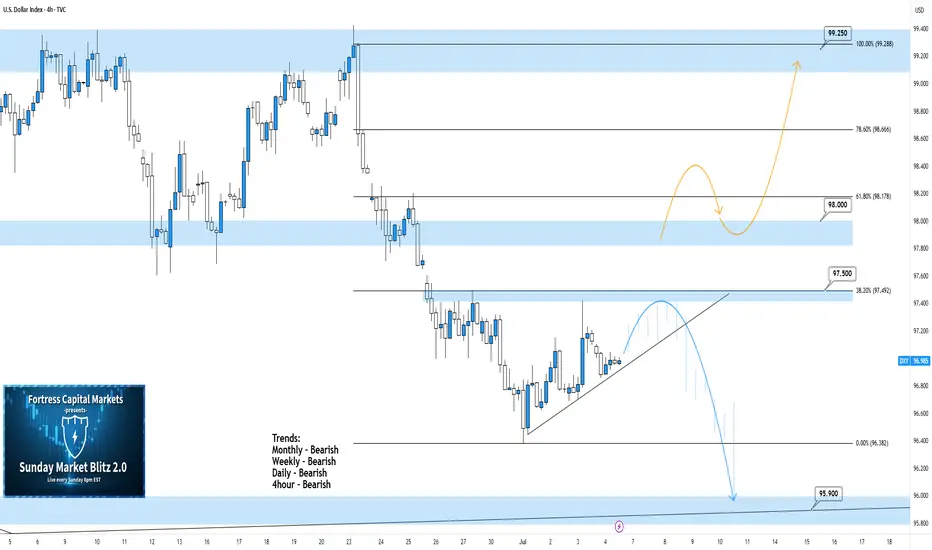
DXY 4Hour TF - July 6th, 2025DXY 7/6/2025
DXY 4hour Bearish Idea
Monthly - Bearish
Weekly - Bearish
Dailly - Bearish
4hour - Bearish
All timeframes are suggesting we are sitll very much bearish. Going into this week we can spot two scenarios that will consider DXY either bullish or bearish.
Bearish Continuation - Ideally we can see price action stay below our 97.500 resistance zone which is also our 38.2% fib level. Look for price action to reject 97.500 with strong bearish conviction. This will most likely confirm a bearish dollar for the week ahead. Keep in mind, price action can push up to the 98.000 zone and still remain bearish.
Reversal - This is the less likely move for the week ahead but not impossible. For us to consider DXY bullish again on the 4hour timeframe we would need to see price action push above our 98.000 resistance area with a confirmed higher low above. Look for strong bullish rejection above & off of 98.000 acting as support. This is the first step for DXY in becoming bullish again.
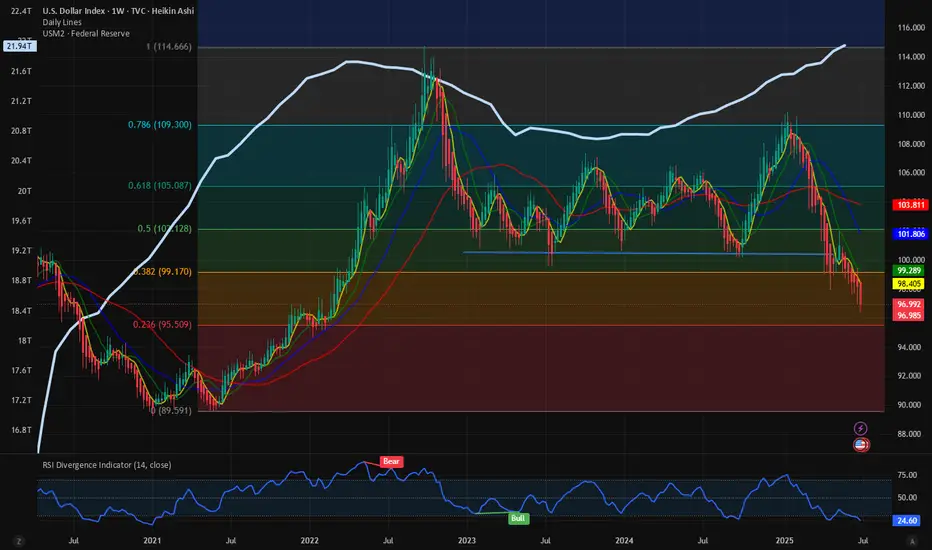
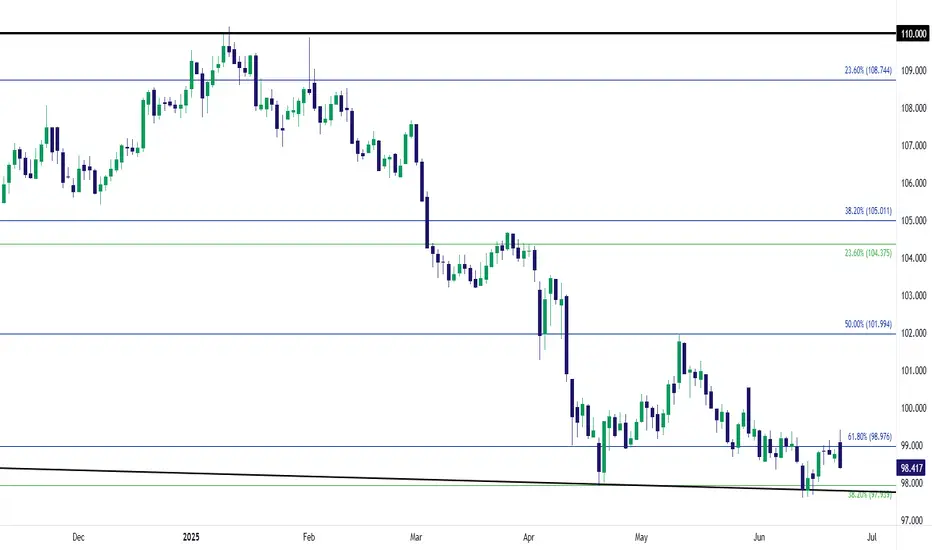
$DXY: New lows begets new lows. $USM2: Why is it increasing? Here we are again with one more TVC:DXY chart analysis. I think the US Dollar does not fail to surprise us week after week. Making new lows every week is giving a boost to the Equity markets. The SP:SPX and NASDAQ:QQQ are at ATH. In my articles on April 18 and June 16
Perfect trade setup: AMEX:GLD to 325; DXY to 95 for AMEX:GLD by RabishankarBiswal
TVC:DXY weakness and EM markets: NSE:NIFTY more upside? for NSE:NIFTY by RabishankarBiswal — TradingView
We have time and again said that in the near term TVC:DXY chart looks weak and could touch 95 by end of July. I think it might be achieved earlier. We have looked at the consequences of 95 handle on TVC:DXY on various asset classes like AMEX:GLD , NSE:NIFTY and EMs. These asset classes are reaching ATH every single week. But we have seldom investigated the reason behind the weakness in $DXY. Looking through my macro charts I found an amazing chart which might explain most of this weakness.
The ECONOMICS:USM2 is almost at 22 T $ surpassing its previous high on March 2022. M2 is basically the total amount of money in circulation in the economy on top of the nominal M1. Higher M2 indicates higher amount of liquidity which is then channelized into riskier assets like CRYPTOCAP:BTC , AMEX:GLD , SP:SPX , NASDAQ:QQQ and EMS like $NIFTY. And with such high ECONOMICS:USM2 in circulation, it is very clear why TVC:DXY is making new lows each week. This can also explain why US Fed is hesitant to reduce rates. With M2 so high US Fed should not hurry.
Verdict: TVC:DXY to 95 by 31 July, Cycle low of 90 by year end. ECONOMICS:USM2 keeps increasing. US Fed stays put.