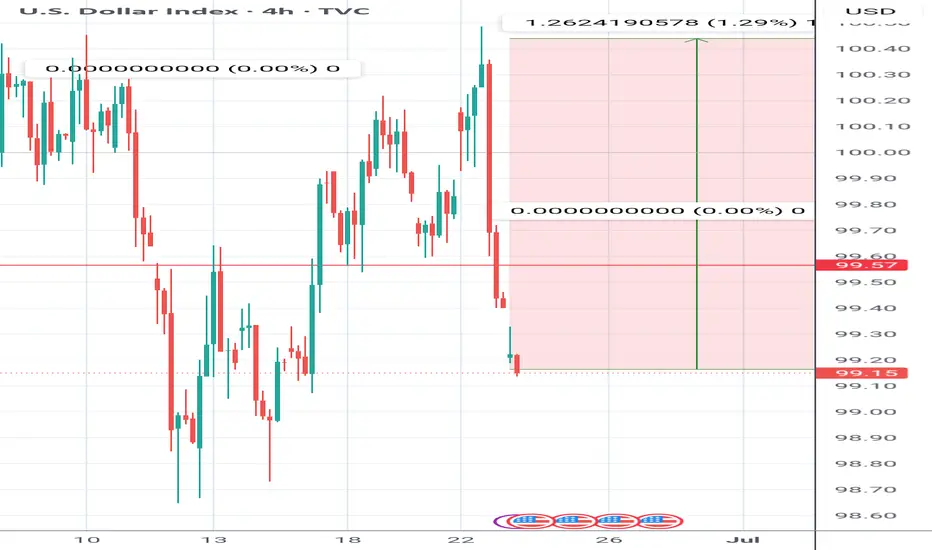
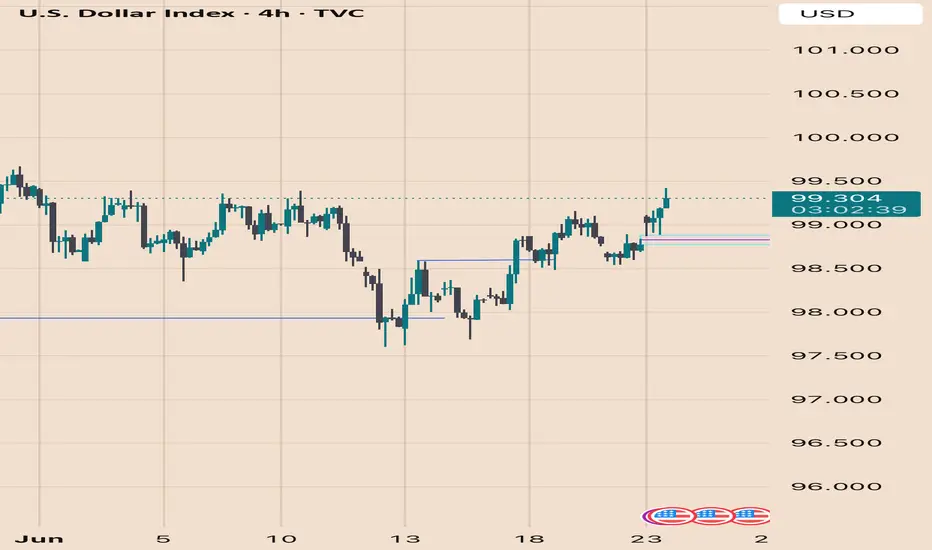
Price action Since the dxy failed to make a lower low and failed to break below but above this is a scenario that might play out
USDX trade ideas
Dollar Back to bearishAmazing run on the liqudity I outlined over the weekend. We literally stabbed through with a few pips and massive rejection. This is all war related but you see how these levels get appreciated all the time.
Insane rejection after taking the liquidity

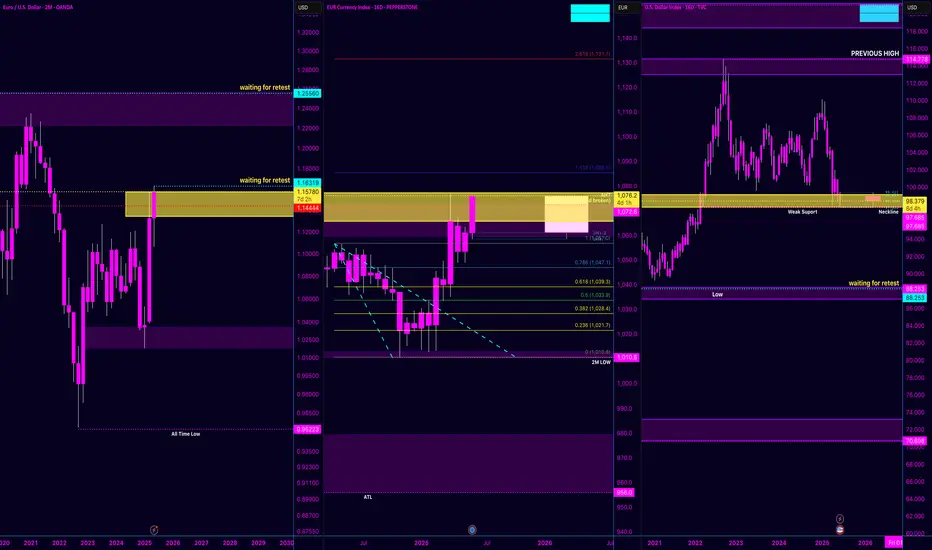
EUR/USD Macro Structure | Don’t Miss the Cycle ShiftAfter reviewing the 12M, 2M, and currency indexes — this isn’t just a bounce, it’s a potential macro reversal.
EUR/USD (2M Chart)
We’ve now got two Morning Star Dojis followed by a bullish engulfing — price is climbing steadily toward 1.16319 (neckline zone). If we break and retest clean, 1.25560 becomes a high-probability target. I view this as the neckline of a multi-year W-formation.
💶EUR Index (16D Chart)
The breakout has already occurred. Retest is happening now around the 1.057 zone. Fibonacci structure supports continuation, and volume confirms strength. If momentum holds, 1.085 – 1.130+ are valid extensions.
💵 USD Index (DXY - 16D Chart)
Meanwhile, the dollar is breaking down from a neckline around 98. If the 97–98 range gives way, we may revisit 88.253, confirming a shift in USD dominance.
🌐 Fundamental Alignment:
The Eurozone is pushing hard for digital transformation, with the ECB advancing legislation on the digital euro. Christine Lagarde has been vocal about blockchain innovation — and XRP’s involvement in cross-border integration is no coincidence.
🎯 Key Price Levels:
1.16319: Neckline (retest zone)
1.25560: Mid-term target
1.60195: Macro expansion (long-term, structure-dependent)
📌 I encourage all traders to zoom out and track structure across multiple timeframes. Sometimes the past holds clues to the future.
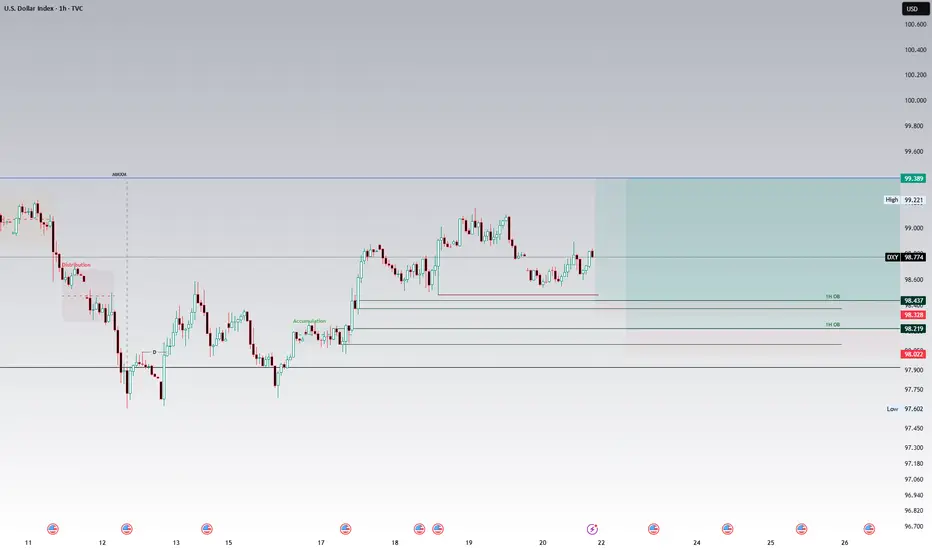
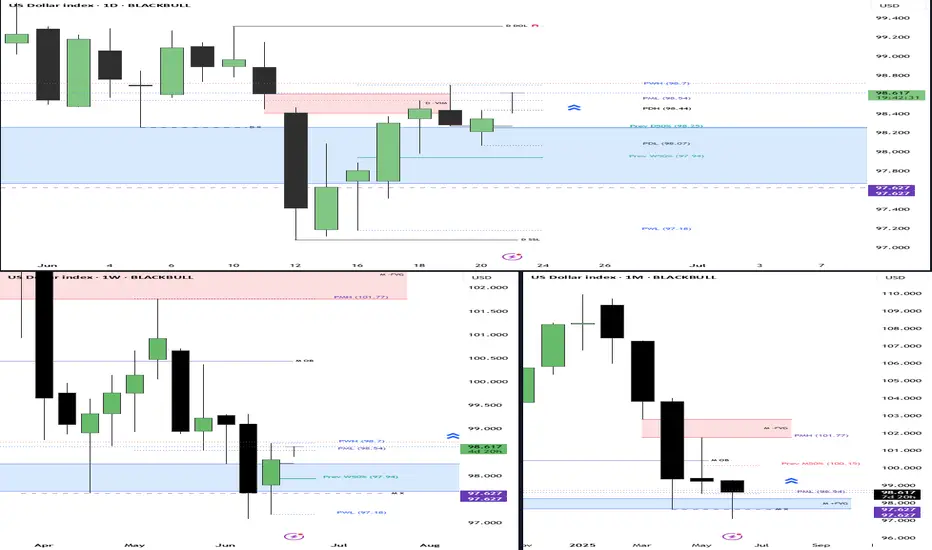
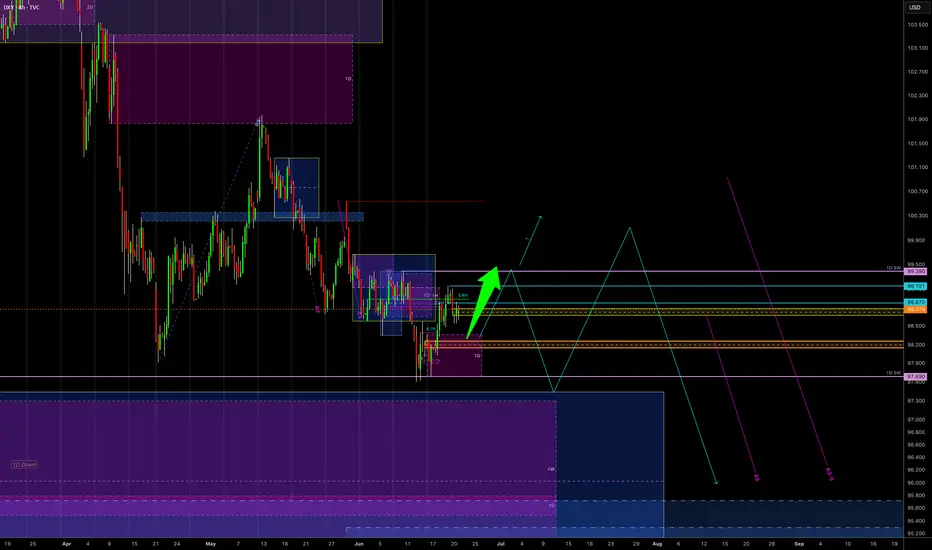
Potential Bullish Scenario for DXY, target objective is 99.392Higher timeframe analysis
As discussed in last week's analysis of the DXY, the higher timeframe draw on liquidity is the bearish monthly Fair value gap set at 101.977. This warrants a higher timeframe bullish bias until this level has been achieved.
Intermediate timeframe analysis
We note the relative equal highs on the daily and 1H chart at 99.392. This serves as a intermediate timeframe draw on liquidity and target objective.
Also note that the buyside of the curve of the market maker buy model has commenced which further fuels bullish sentiment.
Scenario 1
On the 1H chart, note the relative equal lows at 98.482. These lows are expected to be ran to serve as a liquidity primer for the bullish 1H order block at 98.436 which is expected to be respected and held. This poses a rather handsome risk to reward ratio.
Scenario 2
Should price push past the invalidation point of the bullish 1H order block we could see it head to the bullish 1H order block at the initial accumulation at 98.219. The reward on this setup would make up for the loss of scenario 1.
Disclaimer
The above analysis is intended for educational purposes only and should not be interpreted as financial advice.
DXY: Target Is Up! Long!
My dear friends,
Today we will analyse DXY together☺️
The price is near a wide key level
and the pair is approaching a significant decision level of 98.274 Therefore, a strong bullish reaction here could determine the next move up.We will watch for a confirmation candle, and then target the next key level of 98.606 .Recommend Stop-loss is beyond the current level.
❤️Sending you lots of Love and Hugs❤️
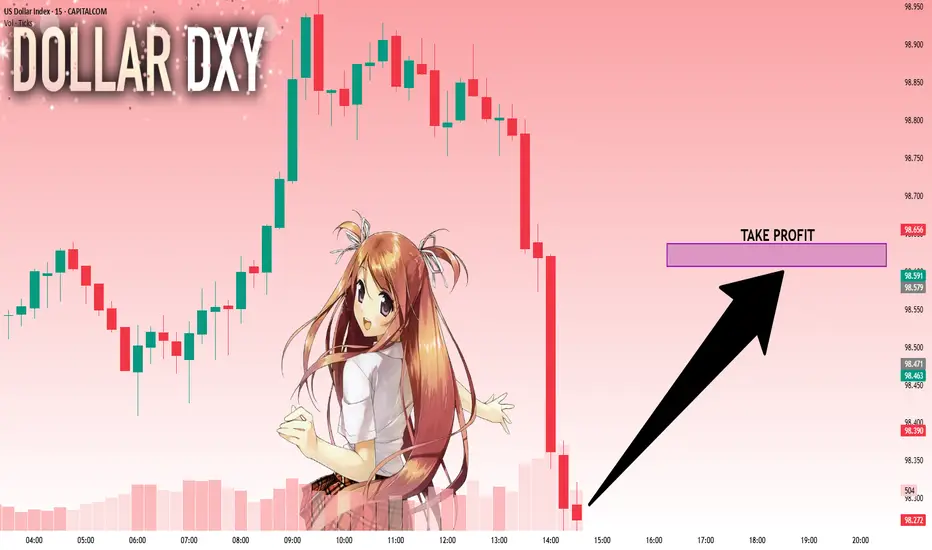
USXUSD HOTW SetUSXUSD HOTW Set
Lower prices for DXY.
Everyone and their mum think DXY will surge because of USA vs Iran, perfect time to sell DXY.
H4 Close like this confirms this idea for me.
Let's see...

DXY SELLS - (DOLLAR FALLING) Like this post to stay tuned to more updates that will follow in the comment section below

DXY Head and Shoulders - Overall BearishIt looks to me that price was retesting this head and shoulders following the breakout of the neckline. If the current H4 resistance zone holds and we get a breakout of the bearish flag then the downtrend will resume.

DXYThis US dollar index is going a little down before continuing going up. Since there are gaps to be filled.
What to Expect From FOMC and the Market’s Reaction to It? With tariffs and Middle East escalation in focus, central banks have somewhat fallen to the backstage recently. But today’s FOMC meeting might change that. The federal funds rate upper band is most likely to stay at 4.50% with a unanimous vote. However, today’s focus will not be on the interest rate itself but rather on the dot plot and updated economic forecasts.
Inflation continues to move closer to the 2% target, but that trend may have shifted with the latest CPI report. Although recent inflation data came in better than expected, inflation appears to be flattening above 2% and could start rising again in the near future. Last week’s CPI and Core CPI reports showed early signs of this, and the upcoming PCE and Core PCE data could confirm those signals. Why is inflation still low despite tariffs? The main reason is frontloading.
U.S. consumers and firms frontloaded many goods, especially durable good, ahead of the tariff hikes. Now, with tariffs in effect, consumption has slowed, and many firms are holding elevated inventory levels. In this environment, firms are reluctant to raise prices due to lower demand and high stockpiles. This suppressive effect is expected to gradually fade, allowing prices to rise. For that reason, the Fed is unlikely to begin rate cuts prematurely. Inflation could make a peak in the last quarter of 2025 or the first quarter of 2026 in our view. But the possible oil price spike due to Iran – Israel war could change this projection.
At the March FOMC meeting when the economic projections were last updated, some of the tariff impacts were already incorporated. Inflation and unemployment were revised higher, while GDP was revised lower. Despite this, the Fed maintained its forecast of two rate cuts for both 2025 and 2026. However, since March, newly announced tariffs have been more extensive than expected. Some board members including Jerome Powell stated that. As a result, a similar adjustment to the forecasts may occur today: higher inflation and unemployment, lower GDP. Accordingly, the dot plot could show only one rate cut for 2025 and three for 2026. Why would the Fed cut more in 2026? Because the tariff impact is expected to be a one-time shock, not a structural shift. Once the effects wear off, the Fed could ease more. But there are some risks to that. According to some new research and New York FED President Williams, not only long term inflation expectations needs to be anchored, rather the “whole curve” So during a possible inflation peak came with tariff effects, FED could not cut repeatedly and should closely watch the effects on short-term inflation expectations.
The main focus of today’s FOMC will be on the economic forecasts and the dot plot. If the new projections reflect only one cut for 2025, this would be bullish for the dollar. If the 2026 projection also shows only two cuts, that would be even more bullish. On the other hand, if the current forecast of two cuts in both 2025 and 2026 remains unchanged, the reaction could be slightly dovish for the dollar.
During the post-meeting press conference, Chair Powell is likely to focus on uncertainties related to tariffs and energy prices, especially given the rising geopolitical tensions in the Middle East. Powell may downplay the hawkish tone of the dot plot during the conference, potentially reducing the overall market impact.
With all this in mind, the dollar index could either break out of the descending wedge formation on the hourly chart or continue drifting toward the lower boundary. Holding above the 99 level could be key for short-term price action.

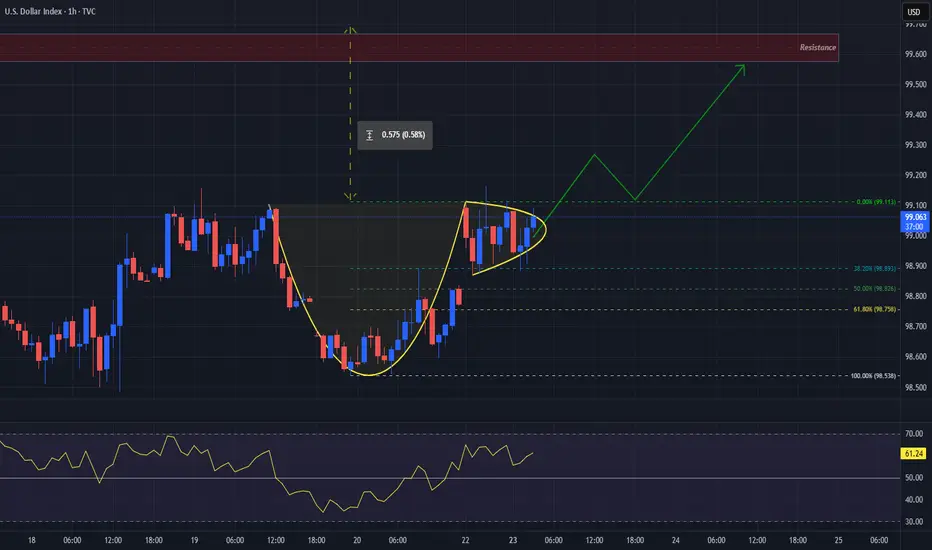
Cup of the Morning for DXYThe TVC:DXY seems to be forming a Cup and Handle Pattern on the 1Hr Chart!
Cup and Handle pattern is considered a strong Reversal Pattern where we should expect Bullishness for the USD.
After the 2nd or Equal High to the 1st was formed, Price made a Retracement to the 38.2% Fibonacci level and found Support to the begin forming the "Handle" or Consolidation Phase of the Pattern.
Price must Break and Close above the "Brim" or Equal Highs of the Cup @ 99.113 to Confirm the pattern!
Once confirmed, we can then look for price on DXY to rise up to the next level of Resistance in the 99.6 area!
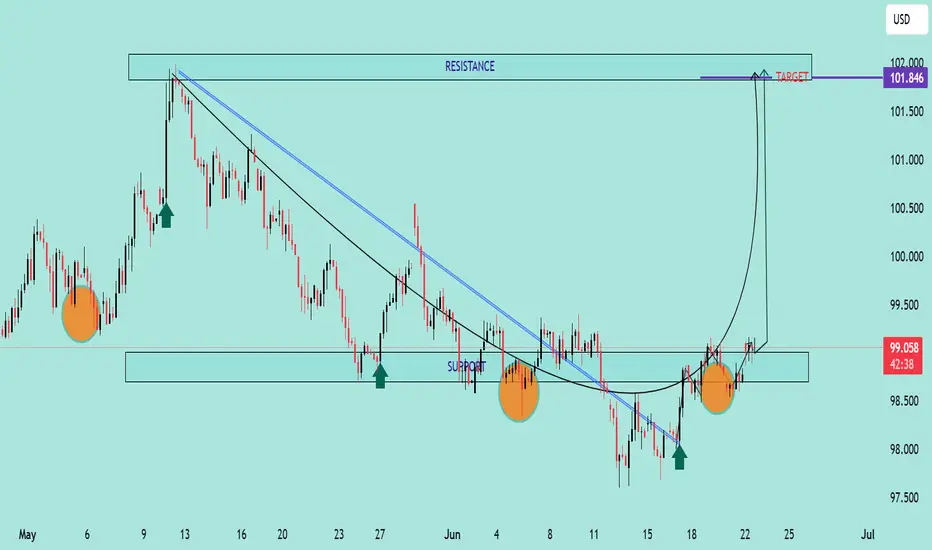
DXY Bullish Reversal & Cup Formation The DXY (US Dollar Index) is exhibiting a strong bullish reversal pattern, with multiple technical signals suggesting upward momentum:
🔍 Technical Analysis Summary:
✅ Support Holding Strong:
Price has respected the horizontal support zone around 98.00–98.50 on multiple occasions (highlighted by orange circles and green arrows), forming a solid base.
✅ Breakout from Downtrend:
A clear breakout above two descending trendlines (black and blue) indicates a shift from bearish to bullish sentiment.
✅ Cup Pattern Formation ☕:
A textbook Cup pattern is visible, where price formed a rounded bottom — a bullish continuation formation. The handle is minor and price has broken above the neckline (around 99.00), signaling a potential continuation toward the target.
✅ Bullish Target 🎯:
Based on the cup pattern and prior resistance, the projected target is around 101.846, aligning with previous major resistance.
📌 Key Levels to Watch:
Support Zone: 98.00 – 98.50
Immediate Resistance: 99.50 – 100.00
Major Resistance/Target: 101.846
🧭 Outlook:
As long as the price remains above the 98.50 zone, the bullish scenario remains intact. The cup breakout indicates strong buying pressure, and momentum could push DXY toward the 101.846 target in the coming sessions.
$DXY After the Iran strike, don’t be surprised if the dollar surges.
Traders want safety. Capital flies back home.
TVC:DXY might rally as global money seeks shelter.
Safe haven season is back.
#Macro #Geopolitics #USD #Iran #DXY #DollarDemand
Fx Outlook for the Week June 23-27 Fx Outlook for the Week June 23-27
#DXY
#USDJPY
#EURUSD
#GBPUSD
#GOLD
**Disclaimer:**
The technical analyses provided herein are based solely on my personal analysis and are intended for my own study and reference. They do not constitute a recommendation or solicitation to buy or sell any financial instruments. Any decision made by individuals based on this analysis is their own responsibility, and I assume no liability for any losses or damages incurred as a result of using this information. It is advisable to conduct thorough research and consult with a qualified financial advisor before making any investment decisions.
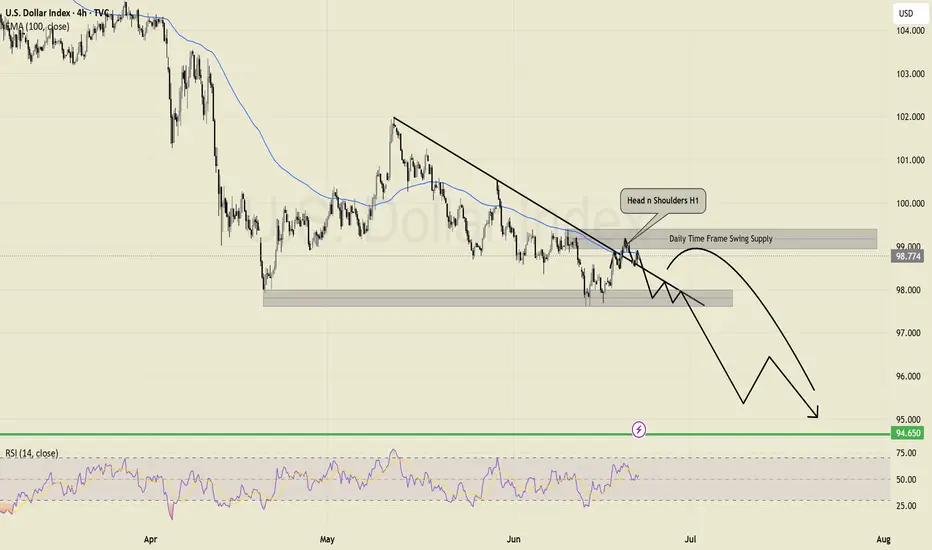
Falling expected of $$ Index.📉 DXY Analysis – June 22, 2025
The U.S. Dollar Index (DXY) is showing clear signs of rejection from the Daily Time Frame Swing Supply Zone around 99.000. A confirmed Head & Shoulders pattern on the H1 chart suggests a short-term bearish reversal. Price action remains under the 100 EMA on the 4H, and the market continues to respect the descending trendline.
Technical Outlook:
🔻 Target 1: 98.000
🔻 Target 2: 94.650 (Major support zone)
📈 RSI divergence confirms downside pressure.
🧭 Fundamental View:
Fed Pivot on the Horizon: Softer inflation and weakening U.S. macro data (e.g. unemployment ticking up, sluggish GDP) increase the probability of a rate cut by Q3 2025.
Risk-On Sentiment Returning: Global risk appetite is improving, pulling capital away from safe-haven USD assets.
Geopolitical Tensions (US–Iran–Israel): Ongoing Middle East conflict is driving temporary spikes in DXY due to safe-haven demand, but if escalation slows or a ceasefire is reached, this could accelerate downside moves in the dollar.
Oil Impact: Rising oil prices due to conflict could hurt the U.S. economy further, worsening the Fed’s policy dilemma and adding pressure on the dollar.
Bias: Bearish
❌ Invalidation above 99.200
🔎 Events to Watch: Fed speeches, PCE inflation, geopolitical developments in the Middle East
#DXY #Forex #USD #Geopolitics #USIranIsrael #HeadAndShoulders #Fed #MacroAnalysis #Tradewithnajamahmed #TechnicalAnalysis #DollarIndex
The DXY eince 1979 and Rate Rises / Cuts & the Crucial point NOW
What i want to draw your attention now, more than anything is simplay that DXY PA is on the line of Support created in the 2008 Crash
Thisis Crucial as if it drops belwo, that is the $ on the international stage loosing the strongest line of support it has ever had
If we look at the stage now, you will also see that the DXY was loosing traction BEFORE the FED began cutting Rates.
This is due to many things on the internationa stage, Like BRICS gaining momentum.
If we look closer, at the weekly chart since around 2017
We can see how the DXY has been Ranging, with a Few Peaks and Drops, the deepest being in 2021, just before the Bitcoin ATH that year.
It bounced well and hit a Peak in late 2022, when Bitcoin was in its Deep Bear.
DXY has ranged ever since j a tight range...
Untill this year
And now, we find DXY on that line of support once moew, Bitcoin maybe heading to a New ATH
But this time we have the serious threat of Global Mayhem
So, the thing to watch here, Like a HAWK, is if DXY can hold this line of support.
Can the $ regain international support and bounce OR will it Fall through this line of support ?
Or Range on it as in 2021
I am not going to pretend to know the answer but I certainly recommend we all pay attention to this- This could take a while................

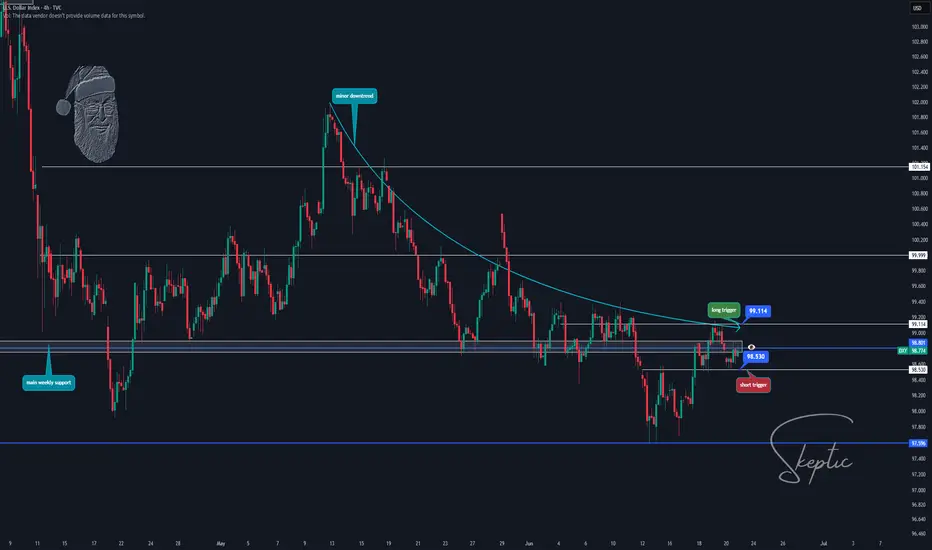
Skeptic | Weekly Watchlist Top Triggers for Forex, Gold & More!DXY: The Market’s Compass
Let’s kick it off with DXY—the Dollar Index every trader needs to watch to get the market’s big picture.
Daily Timeframe: After a failed break below the critical support at 98.801 , DXY dumped to 97.596 , then pulled back to test 98.801 . With rate cuts looking likely soon , I’m betting on more downside for DXY. The only wildcard? Rising Middle East tensions could spike inflation, push rates higher, and strengthen DXY, hammering crypto and CFD indices.
4-Hour Triggers:
Short: Break below 98.530 —a clean setup to ride down to 97.596 . I’m leaning heavier on this, pairing it with USD-based forex trades for max R/R. 😤
Long: Break above 99.114 —riskier against the trend, so keep stops tight and profits quick.
Pro Tip: Shorts are the safer play here, but watch geopolitical news for sudden reversals.
EURX: Uptrend Power
EURX is flexing some muscle.
Weekly Timeframe: The resistance at 1072.6 looks broken. If we avoid a fakeout and hold above this zone, I’m expecting the major uptrend to keep rolling.
Game Plan: No trigger needed—just confirm a few 4-hour candles above 1072.6, and I’m opening longs on EUR-based pairs. Patience for confirmation is key! 🙌
Pro Tip: Watch for fake breakouts—let the market prove itself before jumping in.
Commodities: Gold & Silver
XAU/USD (Gold)
My gold analysis from last week still holds ( check it if you missed it—it’s got Middle East war scenarios and Bitcoin insights too ). No need to repeat—go read it for the full scoop! 📚
XAG/USD (Silver)
Silver’s been on a wild ride after a massive pump.
4-Hour Timeframe : We’re now in a 4-hour range, which makes sense, and I expect it to linger into next week.
Triggers:
Long: Break above resistance at 37.31559 .
Short: Break below support at 35.56800 .
Pro Tip: If you’re holding my 33.68317 long from last week, don’t close yet—let it ride for more gains. If you’re not in, avoid FOMO and wait for the range break. 😎
Forex Pairs
EUR/USD: Ready to Pop
With EURX in an uptrend and DXY likely breaking support, I’m super bullish on EUR/USD next week.
4-Hour Triggers:
Long: Break above resistance at 1.15429 . No need for RSI or SMA confirmation—just a clean breakout, and we’re in. 🚀
Short: Break below 1.13566—only if EURX’s 1072.6 break turns out to be a fakeout.
Pro Tip: Longs are the play here—keep it simple and ride the breakout wave.
GBP/USD: Bearish Break
GBP/USD is looking spicy after a downward move.
Daily Timeframe: The upward channel broke to the downside. I cloned the channel and placed it below—support at 1.34090 is massive, with multiple reactions in the past.
4-Hour Trigger: Break below 1.34090 opens a bearish move with high R/R. I’m personally shorting this break. 😤
Pro Tip: This is a key level—set alerts and don’t miss it!
USD/JPY: Range Game
USD/JPY is stuck in a long 4-hour box range.
4-Hour Timeframe: Price keeps testing the ceiling but travels less toward the floor, showing traders want to break up, not down.
Triggers:
Long: Break above ceiling at 146.204.
Short: Break below the upward trendline, then support at 145.194 .
Pro Tip: Longs have more juice—watch for volume on the break.
EUR/CHF: Mirror of USD/JPY
EUR/CHF is vibing like USD/JPY—a 4-hour box range.
4-Hour Triggers:
Long: Break above resistance at 0.94293 .
Short: Break below channel floor at 0.92963 .
Pro Tip: Wait for a clean break—ranges can be choppy!
Final Vibe Check
That’s your Weekly Watchlist , fam! I’ll keep you updated daily as markets shift. Stay safe with capital management—max 1% risk per trade, no excuses. This week’s loaded with banger triggers, so sit down now, analyze, and set your alerts so you don’t miss a single move. Let’s make it a profitable week! 🚨
💬 Let’s Talk!
If this watchlist got you hyped, smash that boost—it means the world! 😊 Got a pair or setup you want me to hit next? Drop it in the comments. Thanks for rolling with me—keep trading sharp! ✌️
Short Term USD Strength This Week! Sell The Majors?This is the FOREX futures outlook for the week of Jun 8 - 12th.
In this video, we will analyze the following FX markets:
USD Index, EUR, GBP, AUD, NZD, CAD, CHF, and JPY.
USD gained some strength on Friday's job data. Talks with China this week may add to it. But I believe the bullishness will be short term.
Look for valid sells in EUR and GBP. Be cautious with AUD and NZD. CAD and CHF will also offer opportunities to sells.
CPI Data due Wed, making that day and the days that follow potentially the best trading days this week.
Enjoy!
May profits be upon you.
Leave any questions or comments in the comment section.
I appreciate any feedback from my viewers!
Like and/or subscribe if you want more accurate analysis.
Thank you so much!
Disclaimer:
I do not provide personal investment advice and I am not a qualified licensed investment advisor.
All information found here, including any ideas, opinions, views, predictions, forecasts, commentaries, suggestions, expressed or implied herein, are for informational, entertainment or educational purposes only and should not be construed as personal investment advice. While the information provided is believed to be accurate, it may include errors or inaccuracies.
I will not and cannot be held liable for any actions you take as a result of anything you read here.
Conduct your own due diligence, or consult a licensed financial advisor or broker before making any and all investment decisions. Any investments, trades, speculations, or decisions made on the basis of any information found on this channel, expressed or implied herein, are committed at your own risk, financial or otherwise.

DXY Weekly ForecastDXY Weekly Forecast
- DXY expect to be strong due to fundamental factors
- bigger structure needed before DXY to come down to 96.000 level
- look for up move this week
A Message To Traders:
I’ll be sharing high-quality trade setups for a period time. No bullshit, no fluff, no complicated nonsense — just real, actionable forecast the algorithm is executing. If you’re struggling with trading and desperate for better results, follow my posts closely.
Check out my previously posted setups and forecasts — you’ll be amazed by the high accuracy of the results.
"I Found the Code. I Trust the Algo. Believe Me, That’s It."
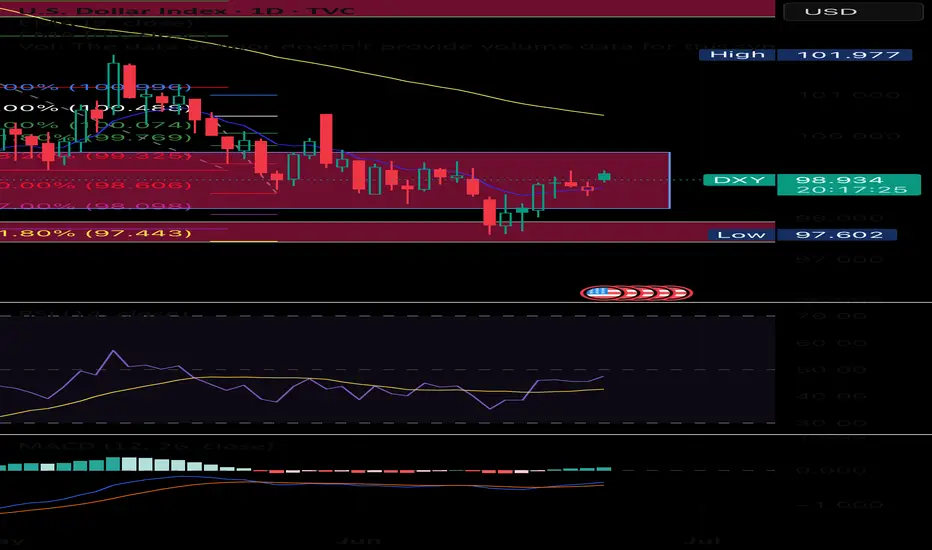
DOLLAR INDEXThe relationship between the US Dollar Index (DXY) and the 10-year US Treasury yield is generally positive but has shown signs of weakening and occasional breakdowns recently.
Key Points:
Typical Positive Correlation:
Historically, when the 10-year Treasury yield rises, the dollar tends to strengthen, and when yields fall, the dollar weakens. This is because higher yields attract foreign capital seeking better returns, increasing demand for the dollar. Conversely, lower yields reduce dollar appeal.
Mechanism:
The 10-year yield reflects investor expectations about inflation, economic growth, and Federal Reserve policy. Higher yields often signal stronger growth or inflation, supporting a stronger dollar due to higher real returns on US assets.
Recent Weakening of Correlation:
Since early 2025, this positive correlation has weakened significantly. Despite rising 10-year yields (around 4.4% to 4.5%), the DXY has hovered near the 98–99 range and even declined over 10% year-to-date. This divergence is attributed to:
Investors re-evaluating the dollar’s reserve currency status and shifting capital to other markets (e.g., European equities).
Outflows from US assets amid geopolitical and economic uncertainty.
Asynchronous monetary policy cycles globally, with some central banks hiking or cutting rates at different paces than the Fed.
Market Sentiment and Safe-Haven Flows:
In times of stress, the dollar’s traditional role as a safe haven can be challenged, further complicating the yield-dollar relationship.
Conclusion
While the 10-year Treasury yield and the US dollar index usually move together, recent market dynamics have disrupted this pattern. Rising yields have not translated into a stronger dollar in 2025, reflecting broader shifts in investor sentiment, geopolitical risks, and global monetary policy divergence.

Dollar - Slightly Bullish Short Term but overall bearishDollar
Just expressing my feel on the dollar for the coming week

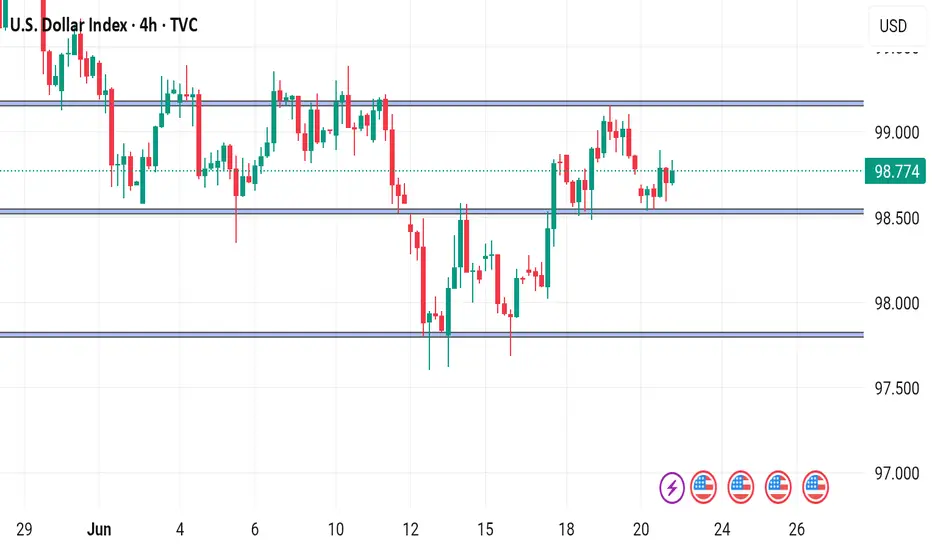
DxyWe are currently at the support zone so we have to wait and see what will happen and also consider the coming days candlestick
Price action DXY I failed to make a new lower currently bullish yet what it needs is a new low higher to complete the structure the we can start looking for longs
