VETUSD trade ideas
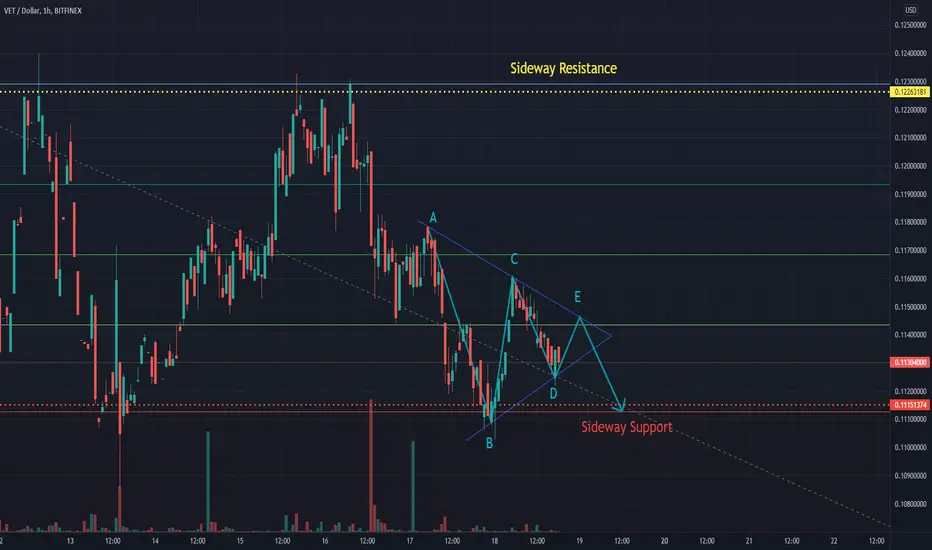
VETUSD Spot Trade Idea - VeChain
Entry: 0.11000
Take Profit: 0.12200
10% Profit In and Out and the trade is done in a few days even shorter.
I use the 1HR charts for these trades.
Saturday 18th Sep/21. Bitcoin just did a lower low to $47600. This is the first video I ever published on TradingView. Suggest any improvements below thank you. I watch markets 24/7.
This is just a basic buy and sells trade! Est a day or a few days/weeks.
Though HODL as long as you want.
Jaffasoft Signals:
See me on Twitter as Jaffasoft and Etoro for the performance of a publicly shared portfolio.
Disclaimer: You must understand trading has risks and this is not financial advice.

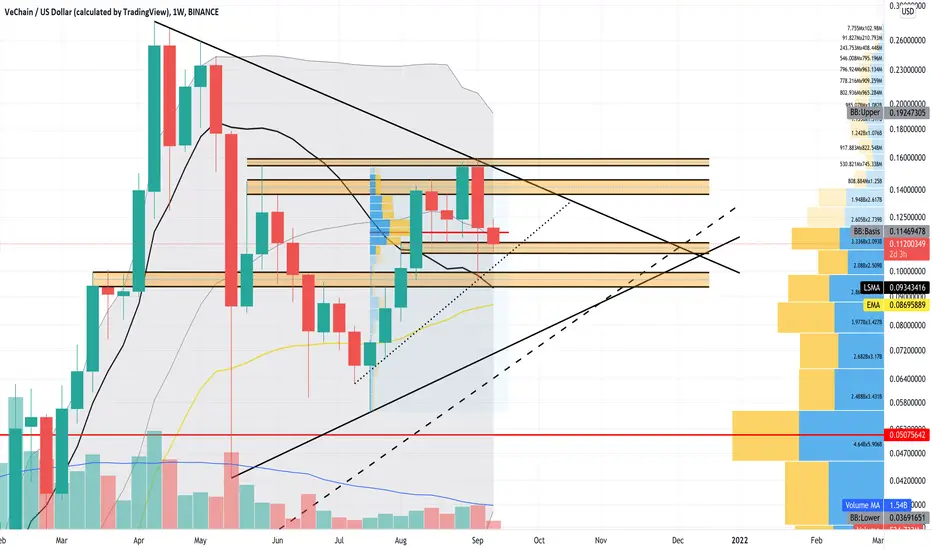
VeChain - Longterm Weekly Chart AnalysisLet’s have a look at the weekly chart for the most criminally undervalued crypto EVER. A Blockchain that is actually being USED by some of the words top companies and has a client base that would make any corporate jealous & salivate with envy. It HAS and IS everything every other Blockchain wishes it was. Worthy of note it that the behemoth PwC is an actual shareholder! I’m talking of course about VeChain.
VET is below its Bollinger Bands Middle Band Basis 20 Period SMA. A weekly CLOSE ABOVE this level is crucial.
VET is still above its 50EMA on this 1W timeframe.
VET is still above its Least Squares Moving Average (LSMA) and note that the last weekly candle bounced off the LSMA as support.
Note that overall Volume is still relatively low and the last 16 weekly Volume Bars have been below its Volume 20 Period Moving Average.
VET is still above its Volume Profile Visible Range Point of Control (VPVR POC) for this charts Visible Range.
VET is below its Volume Profile Fixed Range Point of Control (VPFR POC) for the fixed range of 9 Weekly Candles that i have selected. A weekly Candle CLOSE ABOVE this POC is crucial.
I have added a few support and resistance areas. At the moment, VET has found some support from its lower support area located at around $0.107 - $0.113 . A weekly CLOSE ABOVE the support are is crucial but not the end of the world if we don’t as there is still a lot of support below.
Note that VET is in a massive Symmetrical Triangle on this weekly timeframe. Note that the APEX is around the week of the 13th December.
The Moving Average Convergence Diveragnce (MACD) is indicating momentum is downwards at the moment and note that the MACD Line (Blue Line) has crossed back under its Signal Line (Orange Line) creating a Red Histogram. Note however that the MACD Line (Blue Line) is still above the 0.0 Base Line in the Positive Zone. A drop below the 0.0 basle line on this 1W timeframe will be very bad so its crucial VET stays above the 0.0 base line in the positive zone.
The On Balance Volume (OBV) is indicating momentum is downwards within a range at the moment. Note that the OBV (Blue Line) is below its 9 Period EMA (Yellow Line). We need the OBV (Blue Line) to cross back above the 9 Period EMA (Yellow Line) as well as break back ABOVE the dotted line at around 162.8B and then at around 163.72B for upwards momentum confirmation. The OBV indicator needs to stay above the 160.079B level.
Looking at this longterm chart, even if VET does drop lower, it would still be in a longterm uptrend so long as VET CLOSES ABOVE its Longterm Trend-Line (Dashed Line).
Unless BTC massively shits the bed again down to $28k then VET won’t drop to $0.07 but VET may possibly drop to $0.099 - $0.0934 if downwards pressure continues and VET cannot make a higher low or higher high next week.
Hopefully, after the release of POA2.0, we’ll see VeChain added onto other major exchanges & platforms like Kraken, Coinbase, Phemex, eToro and Bitstamp which will bring much needed liquidity and exposure. I mean FFS, if ShibaInu & Dogecoin are good enough for Coinbase & eToro, surely VET must be. ;-)
I hope this is helpful with your Trading and Hodl-ing.
Notes for those who don’t know:
LSMA = Black Squiggly Line on Chart
50EMA = Yellow Squiggly Line on Chart
Bollinger Bands = Grey Bands on Chart
Longterm Trend-Line = Dashed Line on Chart
VPVR POC = Long Horizontal Red Line on Chart
VPFR POC = Short Horizontal Red Line on Chart
Volume Bars = Green and Red Bars Bottom of Chart
Volume 20 Period MA = Blue Line going through Volume Bars on Chart
Support and Resistance Areas = Black Lines with Yellow Shading on Chart
Symmetrical Triangle = Ascending dn Descending Trend-Lines
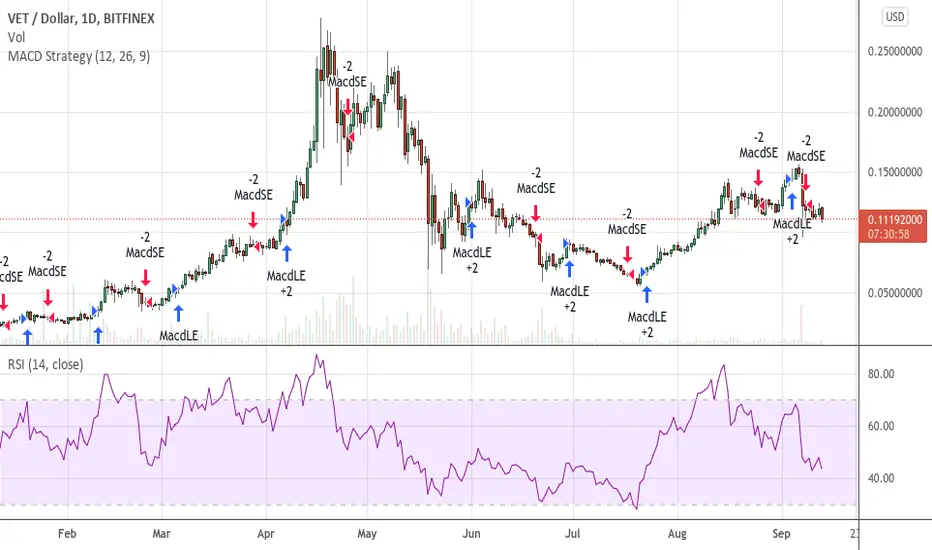
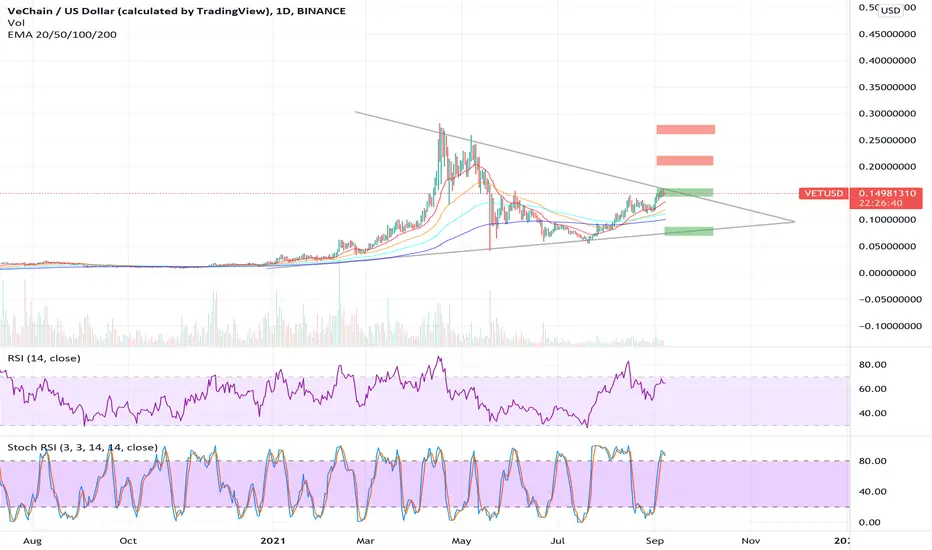
Absolute Buy for VeChain!Great opportunity to buy VeChain before it flies up. Look how a falling wedge is forming, in combination with a rising MACD. VeChain has been locked in the wedge for a long time now: how longer the price stays in the wedge, the more explosive the upward move will be. Great buy.


VeChain Daily IdeaLooking for this short setup. When we reach the shorting area, take a look at the lower timeframes and watch the price action there.
Most of the coins have similar action.
Take care in this market.

VeChain logarithmic trend-based chart.
Chart that shows there is a lot of upside potential for VET, potentially through until next year. Another chart that might indicate more of a slow-burning Christmas and New Year. Hopefully things look bullish through until at least next spring.

VET MegaphoneTF: 4 hr
Looks like a possible megaphone pattern. If the pattern plays out price should advance to around $0.16 before making another possible move down followed by another move higher. If price breaks above or below the pattern expect some volatility

VET to ~$.50 range or higherWe would all love to see $.50+... However, I'm cool with this amount of hopium... for now! ;)

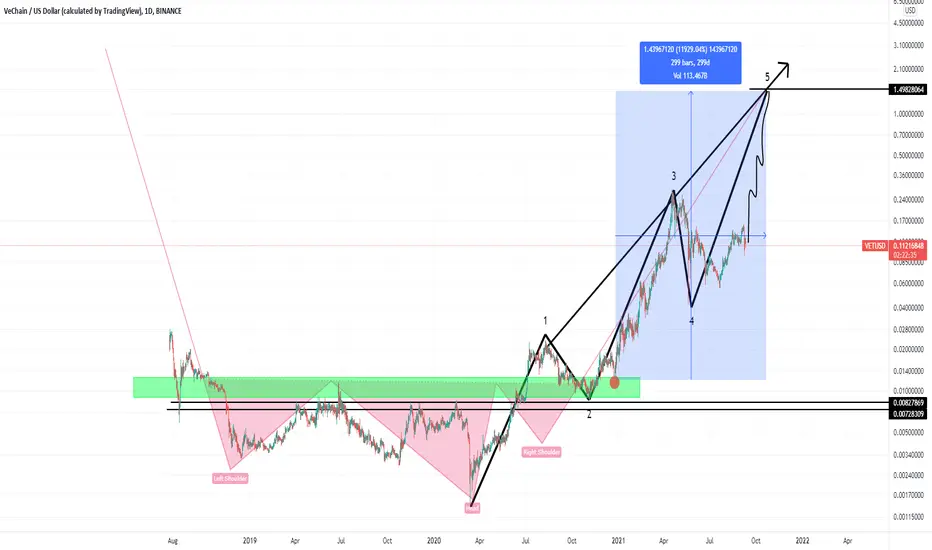
1.4 dollar vechaini looked at this chart a lot, weeks, months, i think this chart will role out.
this is ofc not financial advise, always use good risk reward and place stoplosses.
will see how this plays out later
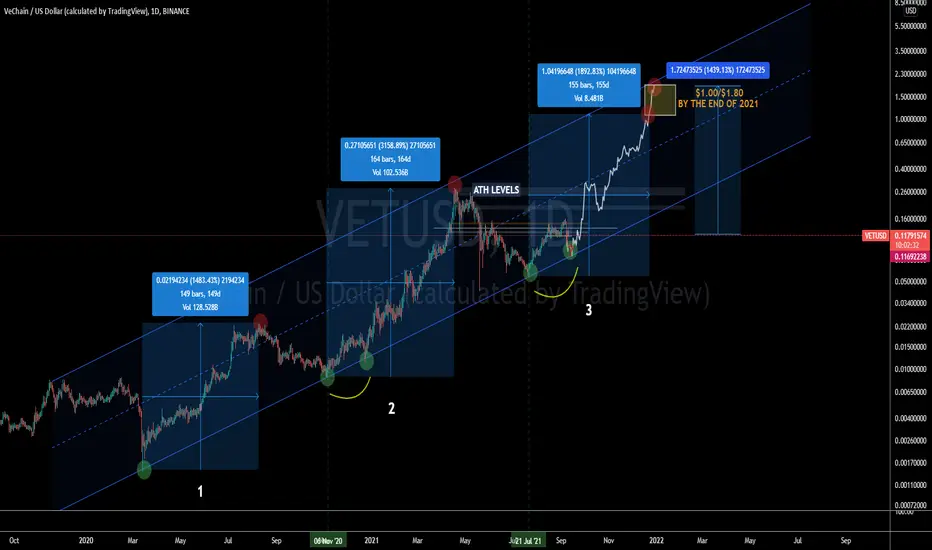
#VeChain Expected to Grow 1,436.13% by the EOYReaching price ranging Between $1.00-$1.80 from today's price
Price is moving in accumulation zone for investors
Price may touch lower channel line as a strong support to continue the uptrend
as today VeChain is up 114.17% from July21st meaning 1,324.96 remain available to gain
NFA
NOTE: Price Line Extension (White) is Only a Visual Representation how Price May Move in the Near Future
with Unknown Specific Time Frame Depending on the Velocity of the Price and Variables of the market
NFA
Hope to See your Likes 👍 to Support My Work
To Follow All My Ideas Go to My Profile and Select the Follow Green button 😁
See You In the Next one!
the best time to buy VeChain has come The crypto crash may have deterred some but for the ones who want to become crypto investors Vechain is a good buy and hold for the next two months

VET Analysis against BTC - Areas of ConfluenceVeChain Potential Bullish Breakout against USD and BTC Area of Confluence (Highlighted Green)

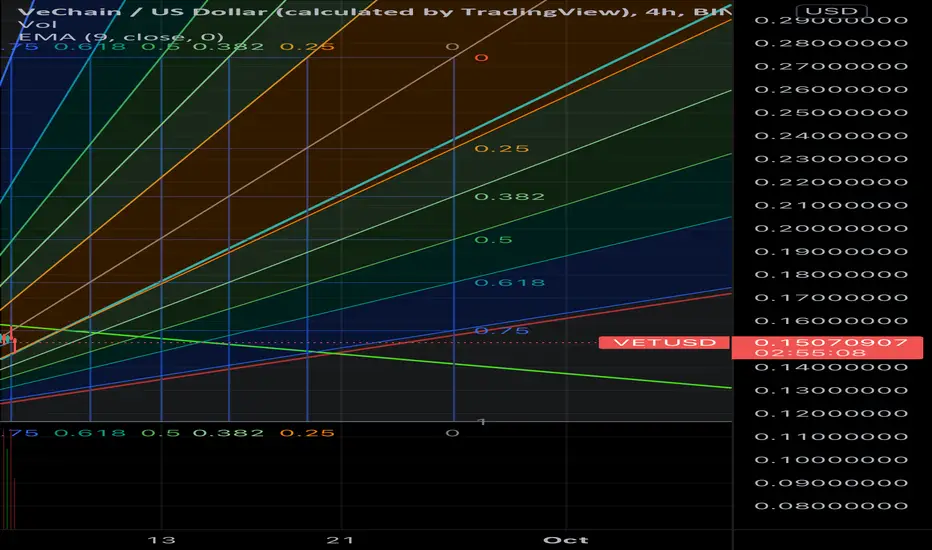
VeChain - 4hr Chart UpdateVeChain 4hr Chart Update
As usual with the massive Longs Liquidation yesterday, our beloved VeChain got hit with one of the worst drops compared to other assets, basically erasing all the gains from 31st August. More on this later.
VET is still within its upwards Pitchfork Pattern (A,B,C), it actually dropped all the way to its lower blue support line and bounced back up. VET eventually needs to make it back ABOVE the Pitchfork Median Line.
VET is below its 50EMA on this 4hr timeframe.
VET is below its 200EMA for this 4hr timeframe.
At the moment of typing this, VET has found some resistance from its Least Squares Moving Average (LSMA) Level. We need a successful 4hr candle CLOSE ABOVE this level for continued upwards momentum.
VET is way below its Bollinger Bands Middle Band Basis 20 Period SMA, we have had massive expansion of the Upper and Lower Bands but note that the Upper Band is starting to point downwards and the Lower Band is starting to curve around indicating we may see some consolidation and reduce volatility.
VET is still above the Volume Profile Visible Range Point of Control (VPVR POC) for this charts visible range.
VET is back above its Volume Profile Fixed Range Point of Control (VPFR POC) for the Fixed range of 10x 4hr Candles that i have selected.
We have seen increased Volume on this 4hr timeframe and note that the last 2 4hr Volume Bars have closed green and above its Volume 20 Period MA.
The Average Directional Index (ADX DI) is indicating the trend strength is strong with the ADX (Orange Line) at 45.40 above its 9 Period EMA (Black Line) which is at 40.72. Note that the +DI (Green Line) is pointing upwards at 9.94 and the -DI (Red Line) is pointing downwards at 37.29. This tells me that while Negative Momentum is strong, it has lost some momentum and Positive Momentum is starting to increase. We need the +DI (Green Line) to cross back over and ABOVE the -DI (Red Line) for renewed positive upwards momentum strength.
The Chaikin Money Flow (CMF) is indicating that VET is back in the Accumulation Zone. Note that the CMF (Green Line) is below its Least Squares Moving Average (LSMA) which shows a lack of accumulation strength. We need the CMF (Green line) to cross back ABOVE the LSMA (Blue Line) for renewed upwards momentum.
I got asked yesterday, “why does VeChain suffer the most when Binance Futures gets liquidated? is it because of weak hands?” It’s nothing to do with weak hands, from my opinion VeChain suffers because it doesn’t yet have the liquidity cushion of other exchanges like Coinbase, Bitstamp, Kraken and many other major exchanges that BTC, ETH and ADA have to help cushion any major drop, so when Binance Longs gets gutted by Binance themselves, VET suffers greatly. This is just my opinion, but it actually makes sense, so it's probably true ;-). Hopefully after the release of POA2.0, we’ll see VeChain and VTHO added onto some of other major exchanges increasing liquidity.
I hope this is helpful with your Trading and Hodl-ing.
Notes for those who don’t know:
LSMA = Black Squiggly Line on chart
50MA = Yellow Squiggly Line on Chart
200MA = Red Squiggly Line on Chart
Bollinger Bands = Green Bands on Chart
Pitchfork = A,B,C Pattern on Chart
VPVR POC = Long Horizontal Red Line on Chart
VPFR POC = Short Horizontal Red Line on Chart
Volume Bar = Bottom of Chart
Volume 20 Period MA = Orange Line Going through Volume Bars

Here I made it simple and reality VETLet's keep it real! Traders and Investors worse enemy are themselves. Forever sabotaging their success in life.

vet targethello
you can check my vet target in the chart
low leverage and a tight stop loss
not financial advice

VeChain (VET) - September 7Hello?
Welcome, traders.
By "following", you can always get new information quickly.
Please also click "Like".
Have a nice day.
-------------------------------------
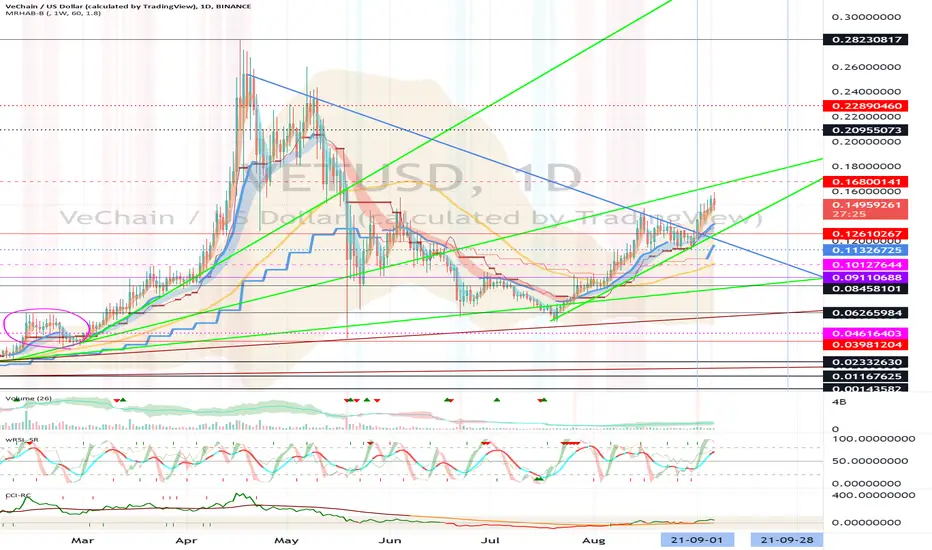
(VETUSD 1W Chart)
If the price holds above the 0.06265984 point, it is expected that the uptrend will continue.
(1D chart)
I think it has entered the high point section as it climbed above 0.12610267 point.
Overall, the 0.16800141-0.22890460 section forms a resistance section.
Therefore, you should check the change in volume when it rises above the 0.16800141 point.
Among them, the largest resistance section is 0.20955073-0.22890460 section.
It is important to keep the price above the 0.16800141 point, even to break through this resistance area.
If it falls in the 0.11326725-0.12610267 section, Stop Loss is required to preserve profit and loss.
However, careful trading is required as it can touch the 0.06265984-0.08458101 section and follow the uptrend line.
-------------------------------------
(VETBTC 1W chart)
If the price holds above the 158 Satoshi point, it is expected to continue the upward trend.
In particular, if the price is maintained above the 221 Satoshi-237 Satoshi section, it is expected to create a new wave.
(1D chart)
It remains to be seen if there is any move upwards above the 342 satoshi point, with support from the 260 satoshi-281 satoshi section.
If it falls in the range of 221 Satoshi-237 Satoshi, Stop Loss is required to preserve profit and loss.
However, it is possible to touch the 158 Satoshi-177 Satoshi section and rise, so you should also think about preparing for it.
Careful trading is required as volatility to break above the wide resistance range 342 satoshi-411 satoshi can often occur.
------------------------------------------
We recommend that you trade with your average unit price.
This is because, if the price is below your average unit price, whether it is in an uptrend or in a downtrend, there is a high possibility that you will not be able to get a big profit due to the psychological burden.
The center of all trading starts with the average unit price at which you start trading.
If you ignore this, you may be trading in the wrong direction.
Therefore, it is important to find a way to lower the average unit price and adjust the proportion of the investment, ultimately allowing the funds corresponding to the profits to regenerate themselves.
------------------------------------------------------------ -----------------------------------------------------
** All indicators are lagging indicators.
Therefore, it is important to be aware that the indicator moves accordingly with the movement of price and volume.
However, for the sake of convenience, we are talking in reverse for the interpretation of the indicator.
** The wRSI_SR indicator is an indicator created by adding settings and options to the existing Stochastic RSI indicator.
Therefore, the interpretation is the same as the traditional Stochastic RSI indicator. (K, D line -> R, S line)
** The OBV indicator was re-created by applying a formula to the DepthHouse Trading indicator, an indicator disclosed by oh92. (Thanks for this.)
** See support, resistance, and abbreviation points.
** Support or resistance is based on the closing price of the 1D chart.
** All descriptions are for reference only and do not guarantee a profit or loss in investment.
Explanation of abbreviations displayed in the chart
R: A point or section of resistance that requires a response to preserve profits.
S-L: Stop Loss point or section
S: A point or section where you can buy to make a profit as a support point or section.
(Short-term Stop Loss can be said to be a point where profit and loss can be preserved or additional entry can be made through split trading. It is a short-term investment perspective.)
GAP refers to the difference in prices that occurred when the stock market, CME, and BAKKT exchanges were closed because they are not traded 24 hours a day.
G1 : Closing price when closed
G2: Opening price
(Example) Gap (G1-G2)
#vetstarburst The Good News!! VeChainLooks like we might need to cool off a little, the green is our goal. New vacation territory. Bouncing off the red still good news, it’s like we don’t have a choice anymore… we will get there study Jon Fiorucci
VET golden cross and potential for 20x Golden ema cross or bull trap ?
If crypto market continues to go up and BTC behaves nicely i don't see VET hitting 3$ a problem. it can be real.
bullish ema cross of ema50 and ema200.
Bar pattern from last cross makes 2000% !

VET 09/05/2021Vechain as most coins closed Bullish as well on the Daily. However we still need a strong close above .16 and a good market retest and market structure to continue the bullish analysis. We will be looking for further confirmation within this new week.

$GRT Is slowly making it's way back to supply zonesI've been in GRT for quite some time and am happy this slow crawler is starting to show some life. Volume is picking up and we're seeing signs of more bullish momentum to come.
