VET LongThere is a downtrend on the VET 1 hour chart that has retested and I project a bullish swing.
VETUSDT.3S trade ideas
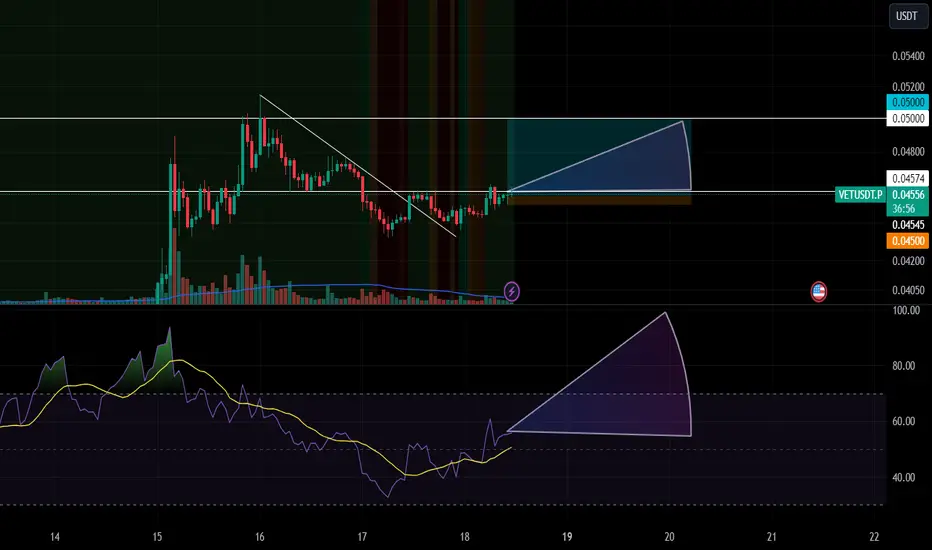
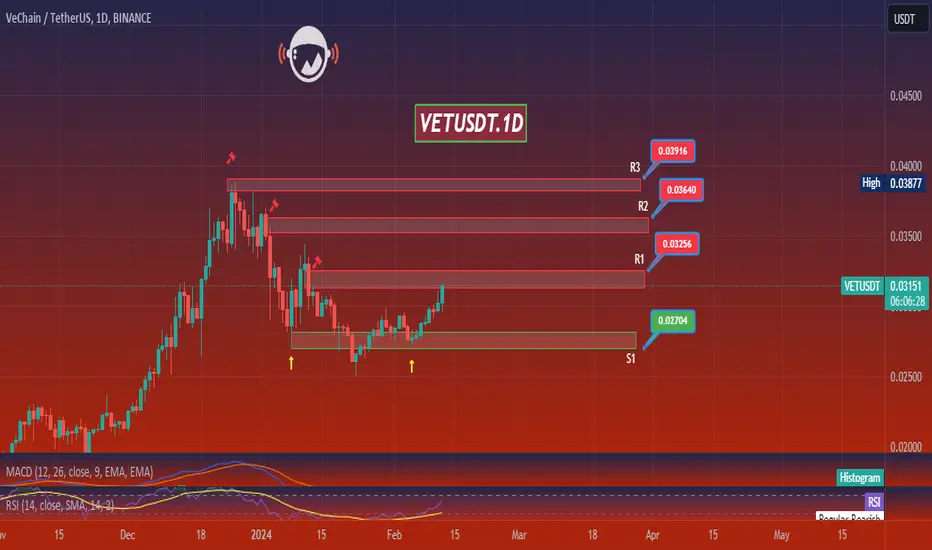
VET 2 scenariosI think at this point there is one of 2 scenarios:
1- Its either just a correction in the upward trend and you can see the green arrow to where it would lead.
2- It became a downward trend which will follow the red arrow.
This all depends on how it will react to the Fibonacci resistance levels.
VET - $0,09 - 85% increaseVTHO has made massive increaes yesterday. Will Vechain be next? VTHO has reached a strong resistance level, but VET not yet. VET can go to $0,09 which is a potential increase of approx. 85%. Currently VET is in an Elliot wave 5 which is very bullish.
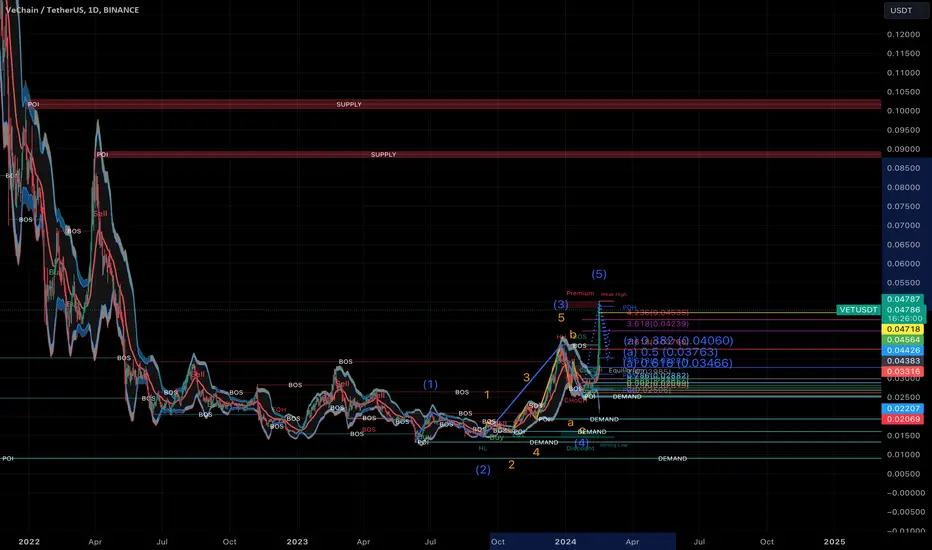
VET Challenging Resistance and Could Pull Back to $0.03495BINANCE:VETUSDT is attempting a challenge at the $0.04820 resistance level. If it manages to close a daily candle above this threshold today, it could have the foundation needed to continue rising in the next 48 hours. VET could subsequently rise to the next barrier at $0.05750.
On the other hand, failure to close today’s trading session above $0.04820 may trigger a wave of panic selling from traders. This could then put the VeChain price at risk of dropping to the immediate support level at $0.03495 in the following week. Continued sell pressure may even pull the altcoin’s value down to within the consolidation channel between $0.02935 and $0.03495.
Despite the potential threat that the VeChain price may correct in the coming week, there is a medium-term positive trend line that has formed on the altcoin’s daily chart over the past couple of weeks. This trend line could stay in effect for as long as VET remains above the middle level of the sideways channel, which is situated at around $0.03207.
Technical indicators on the crypto’s daily chart point to a continuation of VET’s positive trend in the next 48 hours. Both the Moving Average Convergence Divergence (MACD) and the Relative Strength Index (RSI) are flagging bullish.
The MACD line is breaking away above the MACD Signal line, which may be a sign that VET’s bullish trend is growing stronger. In addition to this, the RSI line is also rising above its Simple Moving Average (SMA) line. Traders generally see this as a signal that bulls are growing stronger against bears. However, the steep ascent of both technical indicators could be followed by a sharp drop soon, so traders may want to keep an eye out for any signs that VET’s bullish trend will turn bearish.

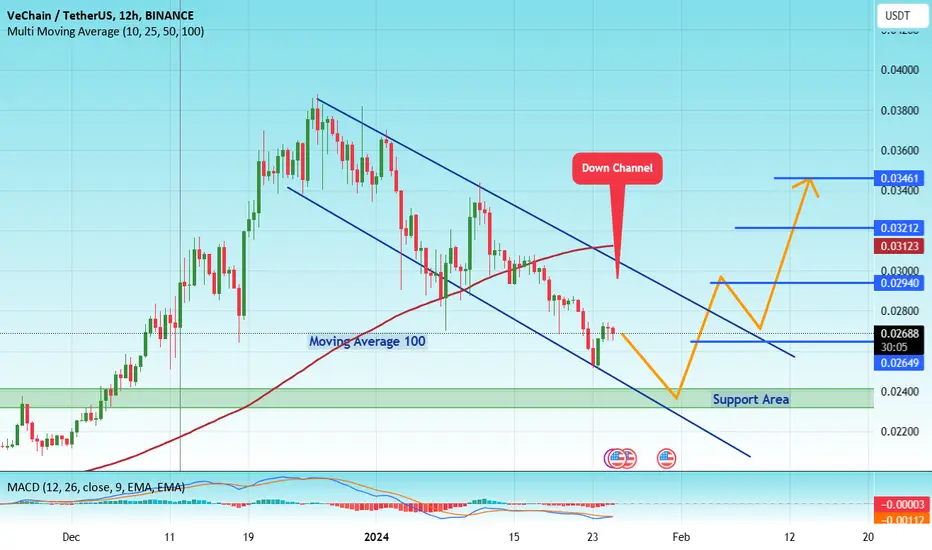
#VET/USDT#VET
The price is moving in a downward channel and sticking to it well
The price is expected to remain within it for some correction to the support level at 0.02400
The price is below moving average 100, so we have some correction to the support level
Entry price is 0.02400.
First target 0.02684
Second target 0.02940
Third goal 0.03212
Fourth goal 0.023461
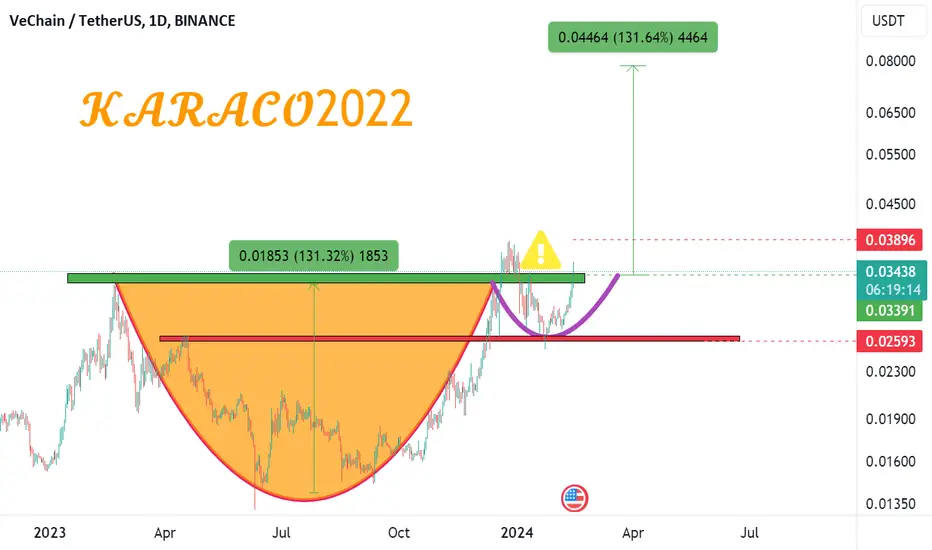
At the beginning of a big move, but wait, the accident is lurkinThis currency is ready to grow by 130% after breaking its important resistance range. This failure can be fake, so it is better to keep an eye on this currency and if it breaks the previous peak and stabilizes it, we can have a safe entry.
VET SHORT hello Traders, here is the full analysis for this pair, let me know in the comment section below if you have any questions, the entry will be taken only if all rules of the strategies will be satisfied. I suggest you keep this pair on your watchlist and see if the rules of your strategy are satisfied. Please also refer to the Important Risk Notice linked below.
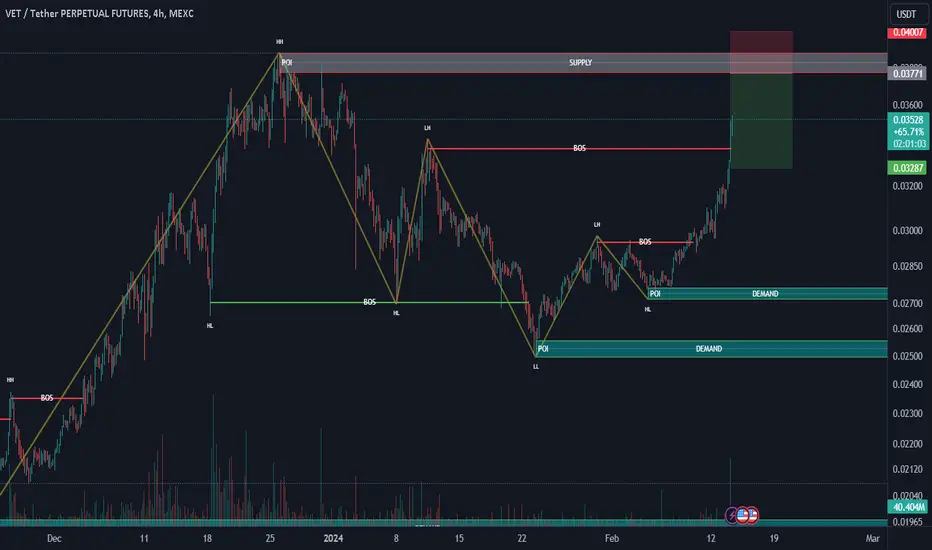
VETUSDT.1DBased on the given market data, the current price of VET (VeChain) against USDT (Tether) is at 0.031. The Relative Strength Index (RSI) for 4 hours, 1 day, and 7 days are 69.98, 63.0, and 66.22 respectively, which are near to the overbought territory (RSI of 70 and above). This might suggest that there could be a potential price pullback in the short term.
The Moving Average Convergence Divergence (MACD) for 4 hours, 1 day, and 7 days are positive, indicating a bullish market sentiment. The price is at the Bollinger Bands (BB) middle line for both 4 hours and 1 day, suggesting the market is in a neutral state.
The support levels are at 0.030, 0.028, and 0.027 for 4 hours; 0.028, 0.027, and 0.024 for 1 day; and 0.027, 0.021, and 0.014 for 7 days. Meanwhile, the resistance levels are at 0.031, 0.032, and 0.035 for 4 hours; 0.032, 0.034, and 0.036 for 1 day; and 0.032, 0.039, and 0.044 for 7 days.
In my opinion, although the RSI is nearing overbought levels, the positive MACD indicates bullish sentiment. However, traders should watch out for the resistance and support levels and also the RSI for any potential price reversals. As always, it is recommended to use these technical indicators in conjunction with other information and not rely solely on them for trading decisions.
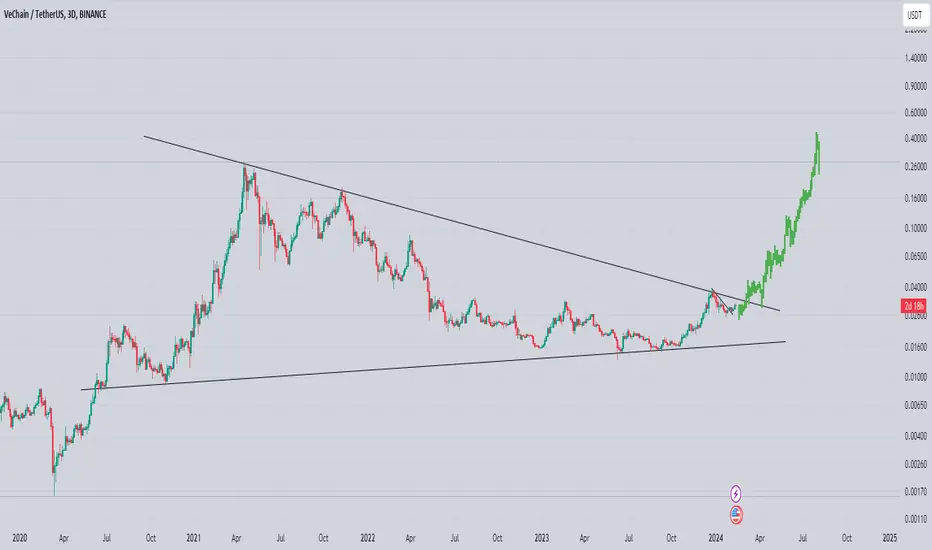
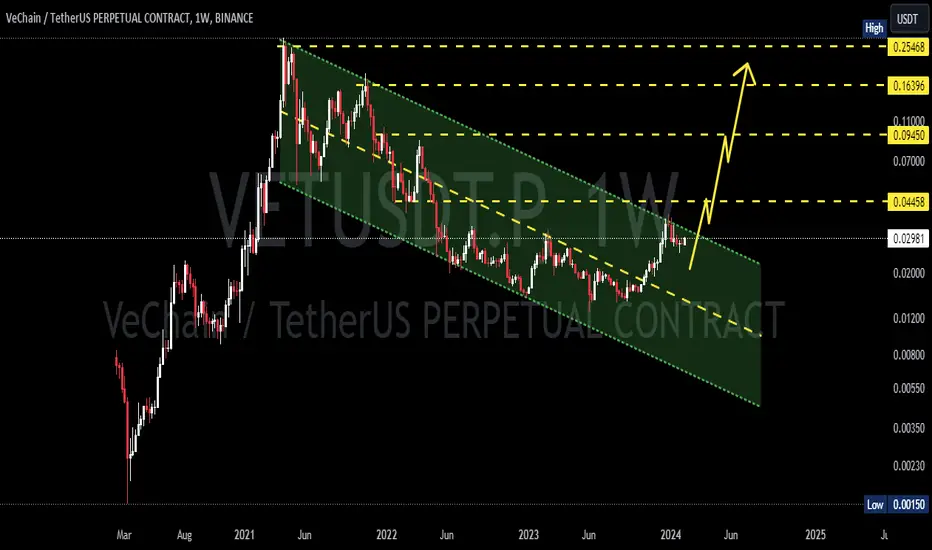
vechain getting ready for 3 to 4x bullish rally seems like has already bottomed out and preparing for solid recovery in coming weeks
Over All Consolidating In Symmetrical Triangle & Recently Breaks Range In Lower Tf Now Approaching Towards Multi Year Trend Line & Expecting Breakout Incase Of Successful Breakout Expecting Massive Recovery In Midterm Expecting 3-4x Bullish Rally
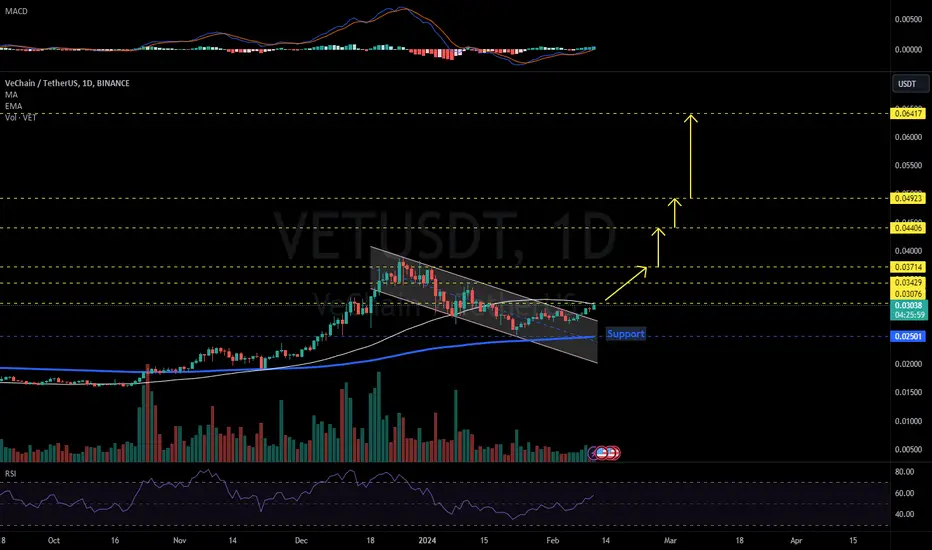
VETUSDT 1D#VET is doing amazing. Broke out the Bullish flag. Currently it is testing MA50 + 0.236 Fib level on Daily chart. Price can easily get doubled.
Targets are:
$0.03429 $0.03714 $0.04406 $0.04923 and $0.06417
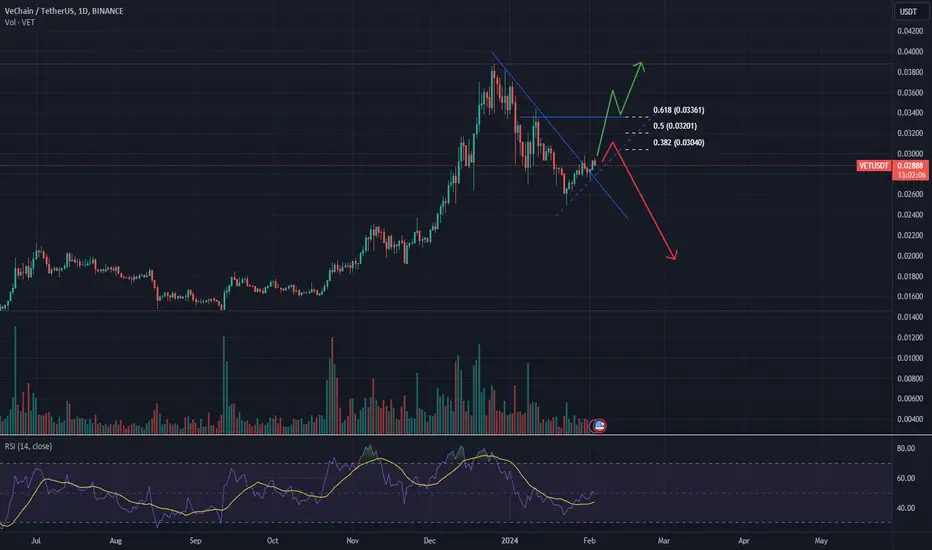
Vechain is bullish breaking out of its daily timeframe pattern Vechain is breaking out of it's descending triangle.
we must expect resistance in the zone between 0.034 and 0.037 ,
if we break through, and bullish retest,
the price target will be around the 0.045 region.
remember :
trade safe and always use a stoploss
never ever invest money you cannot afford to lose
MY CHARTS ARE NOT FINANCIAL ADVISE, FOR INSPIRATIONAL USE ONLY
i just visualise what i see in the charts
VeChain(VET): Waiting For A Breakdown!Another coin that is looking promising is VeChain, where we are looking for a potential breakdown that would result in a nice downward fall in the market price.
We are going to look for a breakdown as long as we are below that 200EMA, so keep an eye sharp for this one!!
Swallow Team

buy vet right now don't wait for restestthis price never come again don't miss buy right now
no one no about vet blast any time vet going to boom
restest done at 0.025 and vet going to up buy not don't
wait for retest

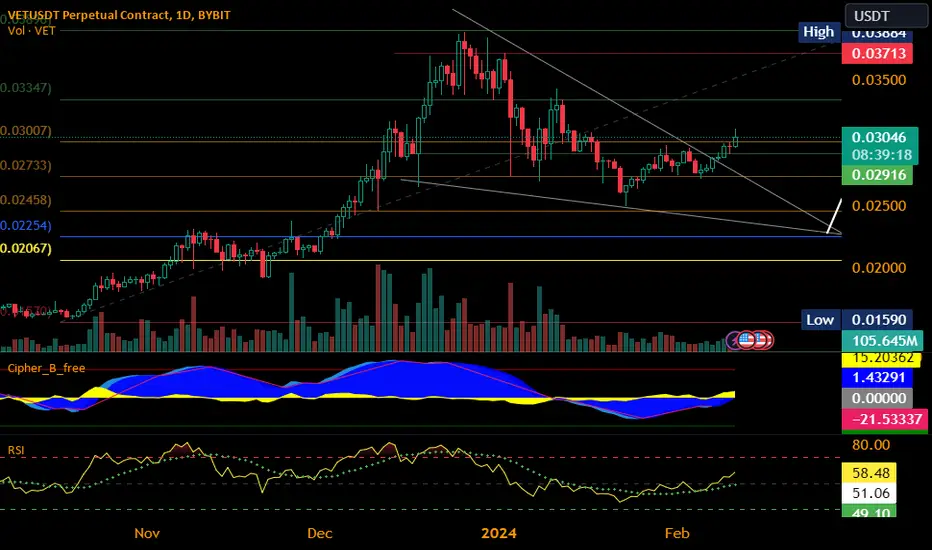
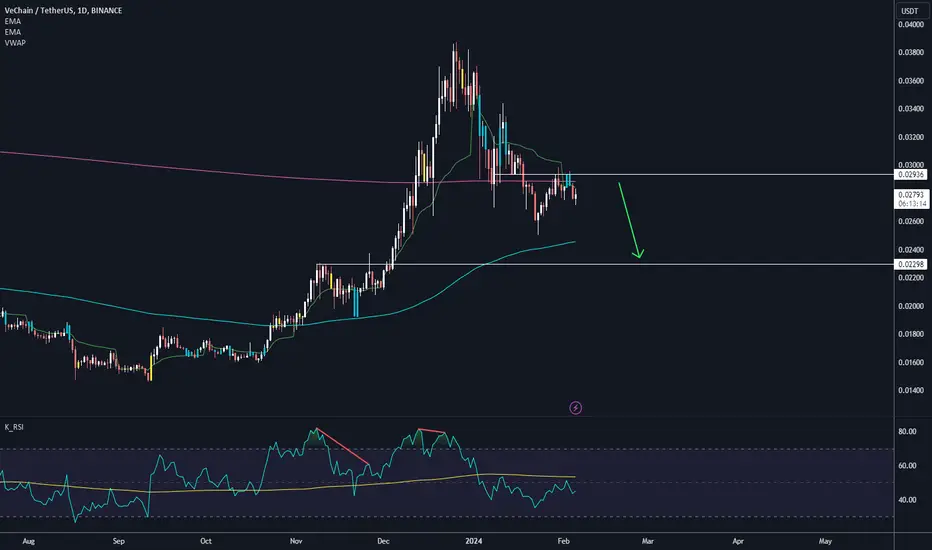
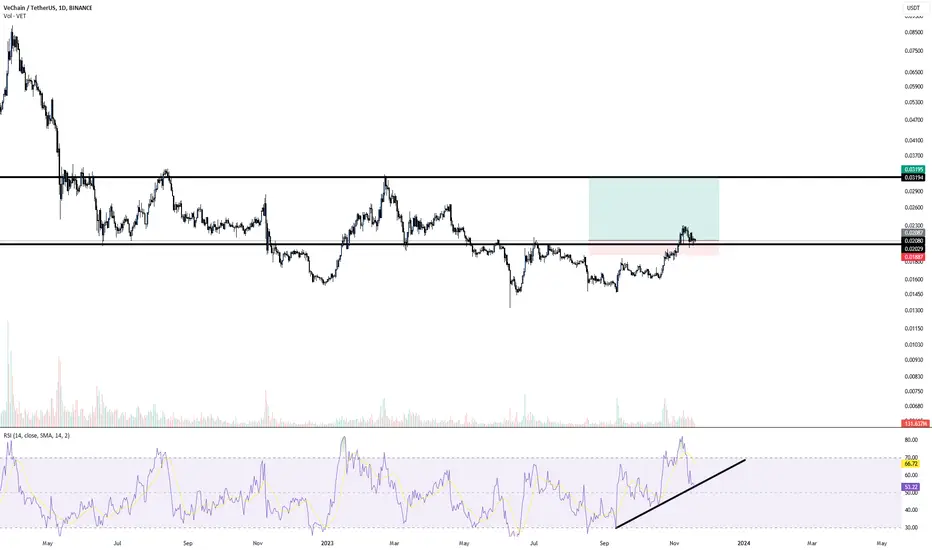
VET / USDT - Bearish SignsShow some weak signs:
1: Break Weekly 200 Moving average and retest which also resistance level at 0.02936
2: Break VWAP
if price continue down move
Target
1. Daily 200 MA
2. 0.02298 level
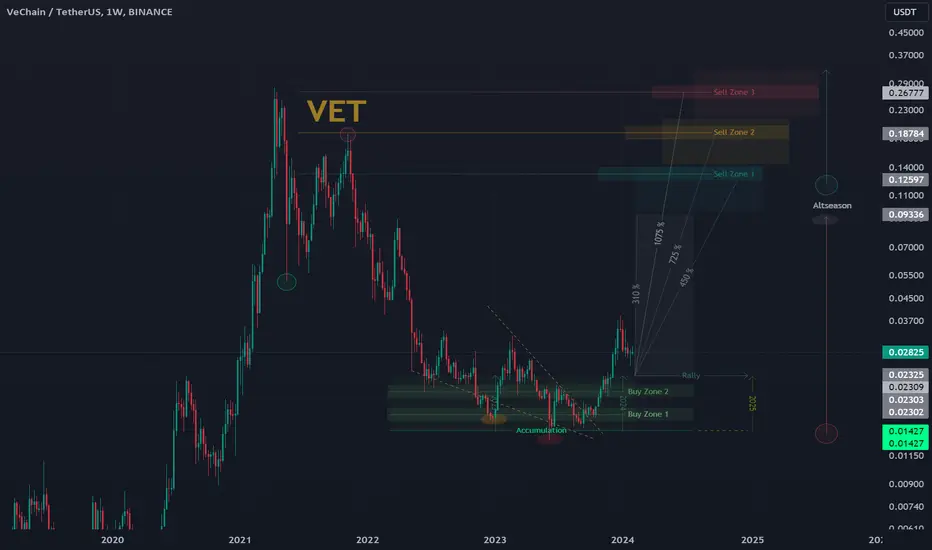
VET/USDT | Vechain | 1W 👀Certainly, I hold this token in my portfolio, comprising no more than 2% of the total balance. I find the $0.025 and $0.017 levels intriguing for accumulation, where I've positioned my limit buy orders. Consequently, I'm prepared for potential further market downturns, which remain a possibility.
- Not financial advice, trade with caution.
✅ Stay updated on market news and developments that may influence the price of Vechain. Positive or negative news can significantly impact the cryptocurrency's value.
✅ Exercise patience and discipline when executing your trading plan. Avoid making impulsive decisions driven by emotions, and adhere to your strategy even during periods of market volatility.
✅ Remember that trading always involves risk, and there are no guarantees of profit. Conduct thorough research, analyze market conditions, and be prepared for various scenarios. Trade only with funds you can afford to lose and avoid excessive risk-taking.
#Crypto #Vechain #Investment #VET
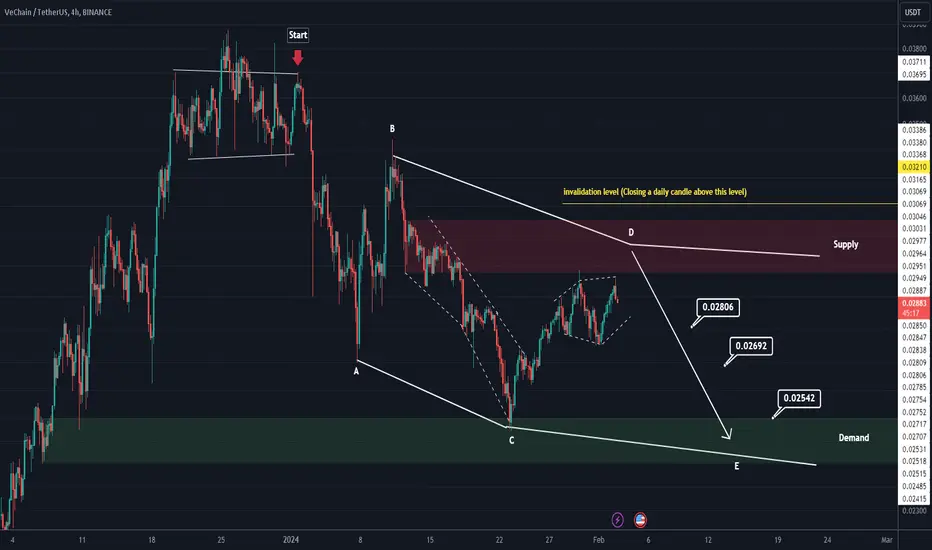
VET ANALYSIS (4H)On the chart, from where we entered "START", we seem to see a correction.
This correction seems to be a diametric.
There was a suitable place for the termination of the D wave on the chart, which we marked with red color.
If the price reaches this range, you can enter a sell/short position.
We have specified the targets on the chart. We also specified the invalidation level. Closing a daily candle above this level will violate the analysis
For risk management, please don't forget stop loss and capital management
When we reach the first target, save some profit and then change the stop to entry
Comment if you have any questions
Thank You
Vet vs USD - abandon shipThis weekly chart shows price action is overbought and starting to correct. The candle stick patterns 'spinning top' represent buyer / seller indecision/ This tells us neither buyers or sellers are knowing which direction to go. The bears have clearly taken control following this overbought period.

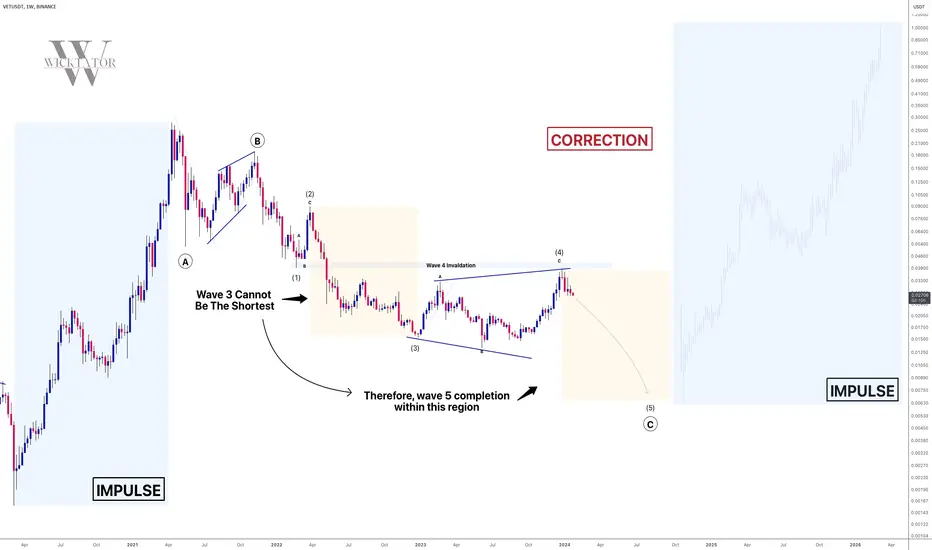
VECHAIN - Massive Drop Inbound!In our last analysis we identified that we were in wave 4 correction and were looking for one more move lower.
We successfully remained below the wave 4 invalidation level, making our current scenario valid.
We are expecting price to move lower to 0.013 to complete subwave 5 of wave C.
Trade Idea:
- look for shorting opportunities with stops above the wave 4 invalidation level (stops above 0.04)
- Target: 0.013 and then taper as we move lower
Goodluck and trade safe!
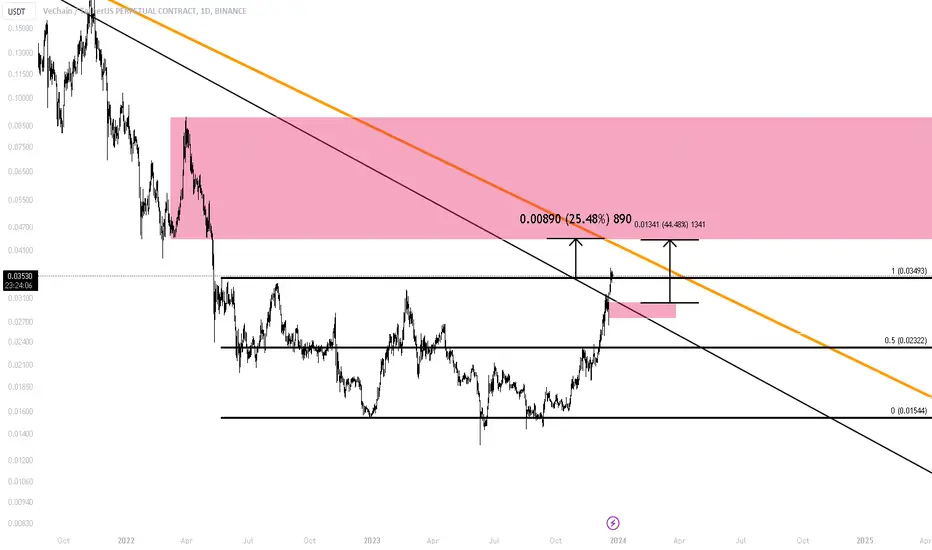
VET longReclaimed long 2022 range. Back to top of the range. Playing long narrative after long downtrend. Keep it simple.
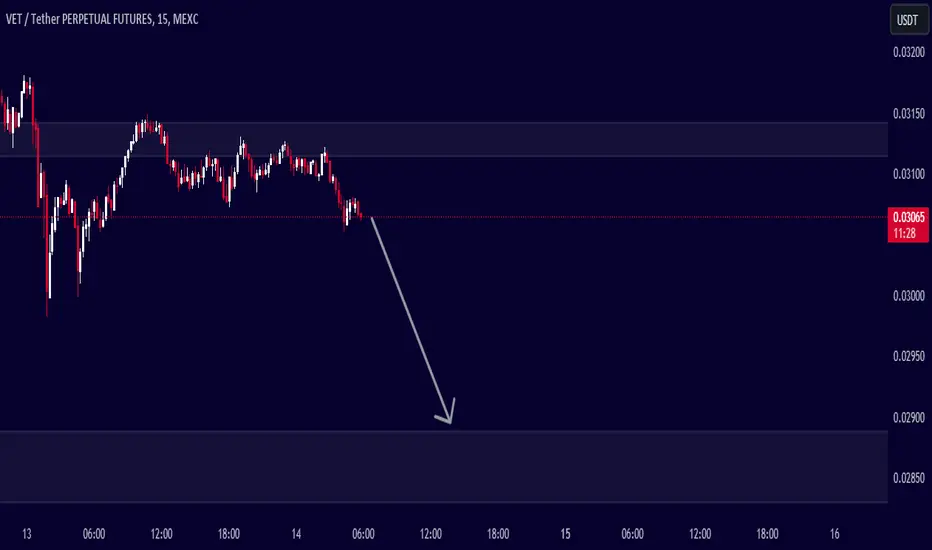
it's time to going down for VETUSDTbefore buying, please check for being sure about your opinion about this CRYPTOCURRENCY!!!
(in every target you want, closed the position but our target is the third one)
*Guy's the entry place is importance things in enter in a position and be careful do not going up your leverage over 7x ,all things it's about risk management*
*************************************************
if you want to enter in this position:
Enter Price: here
Target1: 0.03010
Target2: 0.02964
Target3(Final Target): 0.02889
Stoploss: 0.03184
*************************************************
Guy's if this idea was useful and it was intresting for you please follow for more
please do comment and like my idea
If you like my idea show me in comment section
doing and living in the best quality
thanks of all of you dear's ;)