VETUSDTVET ~ 4D
#VET If you still have Conviction on this coin,. Wait for this descending pattern to be successfully broken out and start buying gradually afterward. Target 20%++
VETUSDT.3S trade ideas
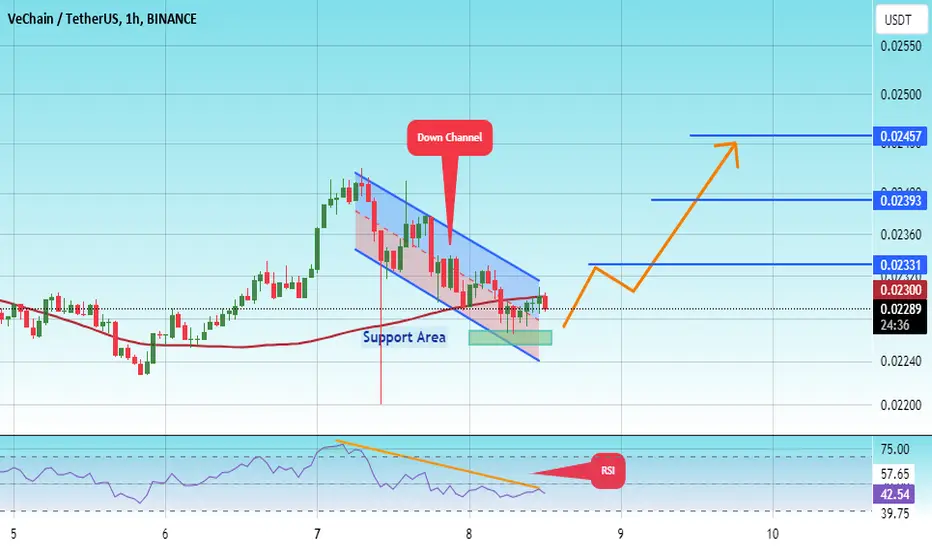
#VET/USDT#VET
The price is moving in a descending channel on the 1-hour frame
And it is sticking to it well
We have a bounce from the lower limit of the ascending channel and we are now touching this support at a price of 0.02250
We have a downtrend on the RSI indicator that is about to be broken, which supports the rise
We have a trend to stabilize above the moving average 100
Entry price 0.02277
First target 0.02330
Second target 0.02400
Third target 0.02457
VETUSDT Long Setup Setting / Divergence on the ChartBINANCE:VETUSDT
COINBASE:VETUSD
📈Which side you pick?
Bull or Bear
SL1 ---> Low-risk status: 3x-4x Leverage
SL2 ---> Mid-risk status: 5x-8x Leverage
(If there is just one SL on the chart, I suggest, low risk status🙂
👾Note: The setup is active but expect the uncertain phase as well.
➡️Entry Area:
0.2295-0.2352
⚡️TP:
0.2360
0.2405
0.2440
0.2481
🔴SL:
0.2203
🧐The Alternate scenario:
If the price stabilize against the direction of the position, below or above the trigger zone, the setup will be canceled.

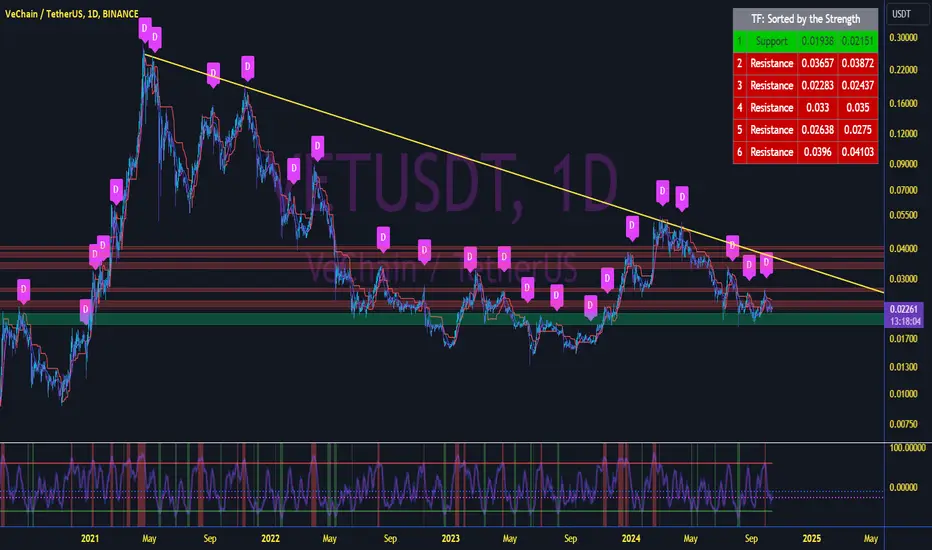
VET USDT- MUST WATCH THIS ANALYSISIf the price breaks the parallel channel and support, then the price can dump further, If price bounces from the support zone, then price can go up to above mid level of the parallel channel

VET USDT- MUST WATCH THIS ANALYSIS! If price rejects from the resistance zone, Then we can watch the below support zone

plenty of resistance, key support though..looking how things are right now we are right back at that level of support again.
this could swing either way, and there is plenty of volume above us still pushing down..
short term, I think a bit more downside, then reassess.
Let's see
#VET TRENDLINE BREAK#VET broke out of the downward trendline and made a HH after touching our weekly support.
There's a possibility that we might touch down on weekly support once more before the next move up.
Looks like a reversal is coming!

VETUSDT IdeaTDLR; this is a wave pattern and is expected to close last wave from here, otherwise is a void.

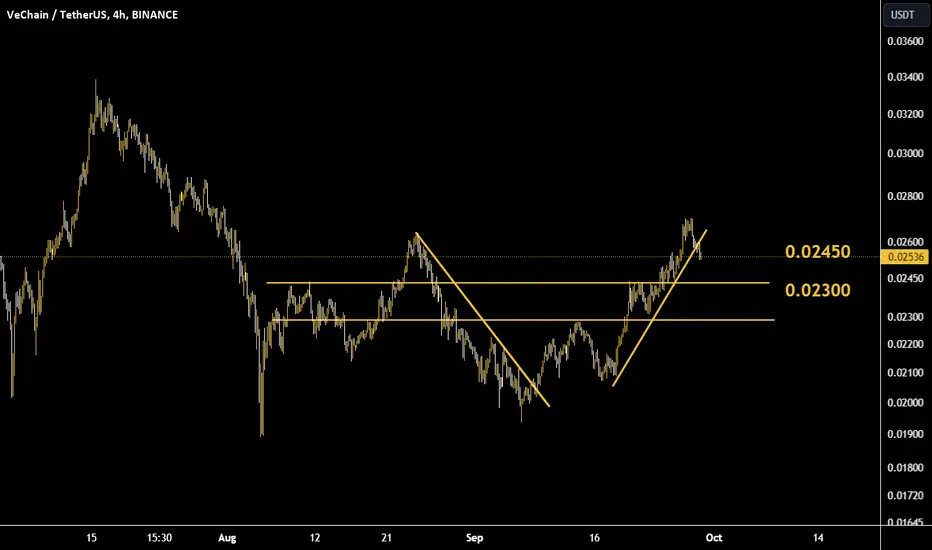
trend vet usdt#vetusdt
Uptrend is broken
Moving towards 0.0245 and if this support is broken, 0.0230 is the next downside target.
VETUSDT 1:1 Long Setup SettingBINANCE:VETUSDT
COINBASE:VETUSD
SL1 ---> Low-risk status: 3x-4x Leverage
SL2 ---> Mid-risk status: 5x-8x Leverage
👾The setup is active but expect the uncertain phase as well.
➡️Entry Area:
Yellow zone
⚡️TP:
0.02525
0.02551
0.02581
0.02621
🔴SL:
0.02354
🧐The Alternate scenario:
If the price stabilizes below the trigger zone, the setup will be cancelled.

VET - Long idea - Order Block concept testingVET - Long idea - Order Block concept testing
Just testing the SMC Order Block concept - please comment and lets learn together/

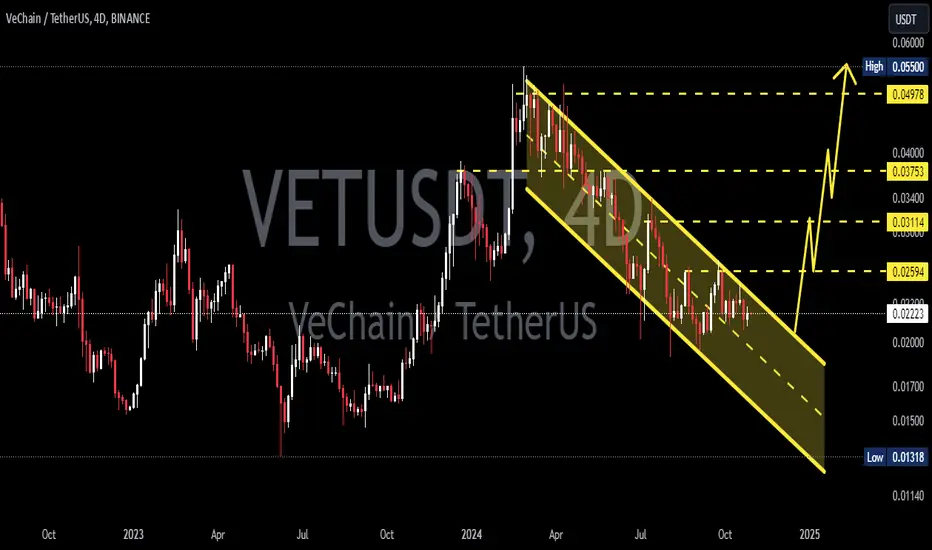
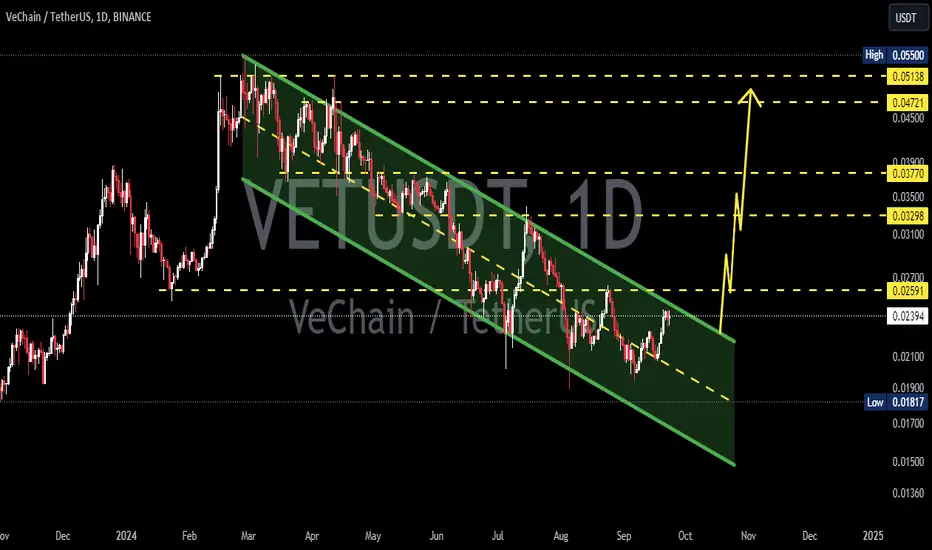
VETUSDTVET ~ 1D ✅
In 1D Time Frame,. #VET Moves in this descending pattern. The best way for now. Make purchases gradually after successfully breaking through the resistance line of this descending pattern.
VETUSDT looks bullishVETUSDT looks bullish on daily chart.
expecting breakout iin couple days. you can also buy when breakout for confirmation
VET SETUPBased on the provided chart for VET/USDT on a 1-day timeframe from Binance, here is a detailed trading plan:
### Entry Points
- **Primary Entry**: Around 0.02335 USDT
- This is the key entry level where price has formed a consolidation and potential reversal area.
- **Secondary Entry (Lower)**: 0.02042 USDT
- This lower entry can be used if the price dips further but remains within the support zone, providing another opportunity to enter at a discounted price.
### Target (Take Profit) Levels
- **First Target (TP1)**: 0.02750 USDT
- This level is a 61.8% Fibonacci retracement from the recent swing high and may act as a resistance level.
- **Second Target (TP2)**: 0.04000 USDT
- A significant target and resistance level where the price may face some selling pressure.
- **Third Target (TP3)**: 0.05500 USDT
- A more ambitious target, representing a larger upside potential if the trend continues upward.
### Stop Loss
- **Stop Loss**: 0.01731 USDT
- The stop loss is set below the most recent support level to protect against further downside. This level ensures a tight risk management strategy.
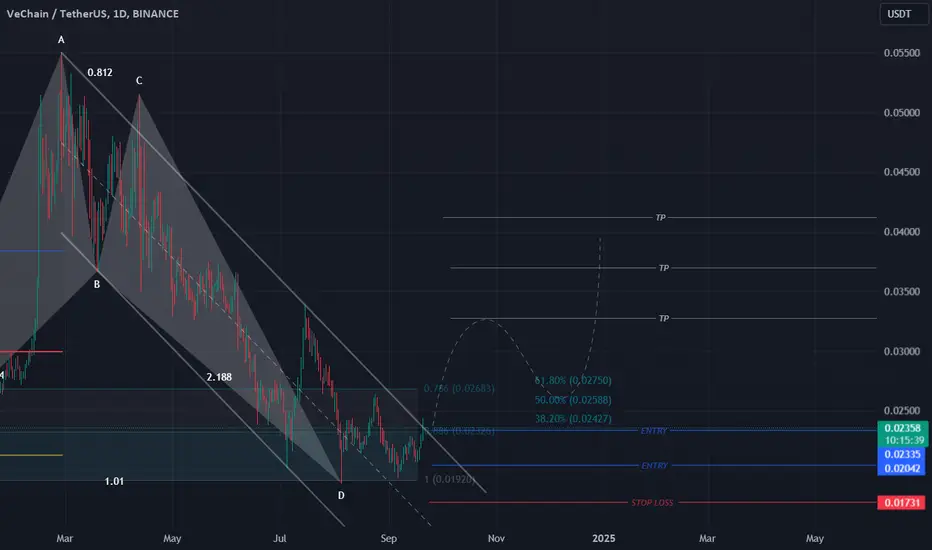
### Key Levels and Observations
- **Fibonacci Levels**:
- 38.2% retracement at 0.02427 USDT (resistance area).
- 50% retracement at 0.02588 USDT.
- 61.8% retracement at 0.02750 USDT (TP1).
- **Harmonic Pattern**: The chart forms a harmonic pattern, indicating potential bullish momentum once it breaks above the resistance zone.
- **Volume Profile**: There’s significant activity in the current price range, indicating a possible accumulation zone before a breakout.
### Technical Indicators
- **RSI**: Suggesting the potential for a bullish reversal from oversold conditions, which strengthens the bullish bias.
- **MACD**: Positive divergence forming, indicating a potential upward momentum shift in the coming days.
### Trade Plan Summary
1. **Enter** the trade between 0.02042 USDT and 0.02335 USDT.
2. **Set Stop Loss** at 0.01731 USDT to minimize risk.
3. **Target Levels**:
- **First Target (TP1)** at 0.02750 USDT.
- **Second Target (TP2)** at 0.04000 USDT.
- **Third Target (TP3)** at 0.05500 USDT.
This strategy leverages both Fibonacci retracement levels and harmonic pattern completion for potential upside. Ensure to adjust your position size and manage risk accordingly.
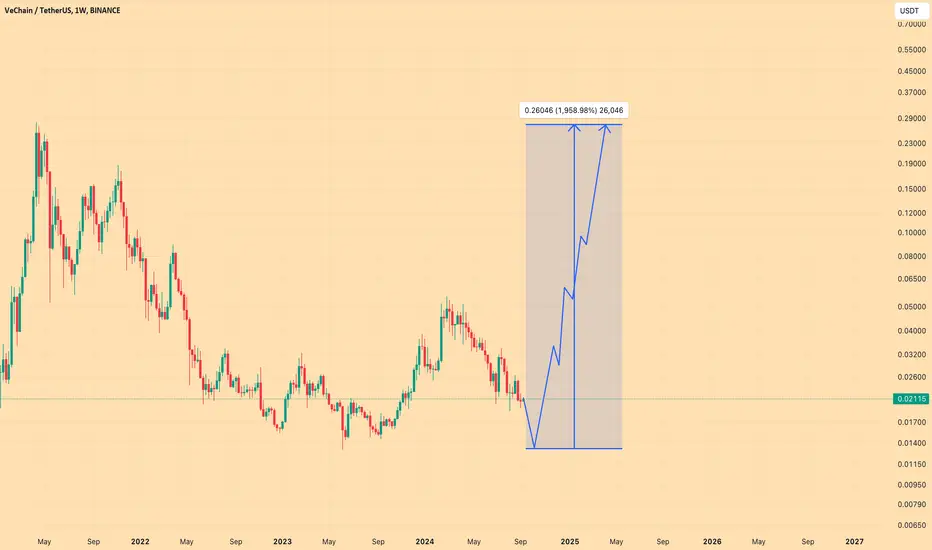
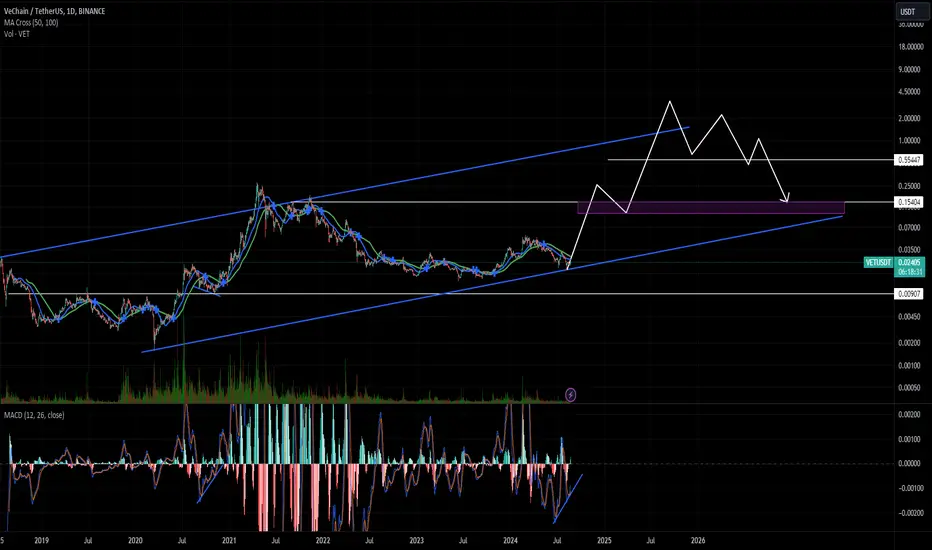
VET - new ATH in Oktober 2025? Hello everyone,
Like many others here, I'm predicting the real market top to happen around October 2025. With that in mind, I want to talk about one of my favorite projects, which, unlike many others from that time, didn’t lose steam. Instead, it’s remained attractive for new investors.
After its ICO launch in 2018, the project went through an accumulation phase that lasted over 650 days. Then, it had a breakout period of more than 220 days, which ended with a massive price surge of 10,000%. That took the price from $0.03 all the way to its all-time high of $0.30.
Now, looking at the current VET/USDT chart, we’ve just wrapped up another 650-day accumulation phase, and there was a solid breakout in Q1 2024. So, I think we’re still in the breakout zone, and I expect this to continue until around Q4 2024.
As for my prediction: I think we’ll finish the breakout zone by Q1 2025, with the price hitting its previous ATH of $0.05. Then, by Q3/Q4 2025, I see a big surge, with October 2025 marking the top. A 10x from there seems possible, bringing the price to at least $0.50.
Honestly, I wouldn’t be surprised if it reaches $1, but $0.50 feels like a ‘safe’ target to me.
NFA as always,
Cheers

VET USDT spot trade | 2000% potential or ATH in 2025 bull marketVET/USDT is setting up for a massive run, with 2000% potential or a new ATH in the 2025 bull market. With VeChain's strong fundamentals and increasing real-world adoption, this could be a top performer in the next cycle. Keep an eye on key breakout levels! 🚀 #VET #VeChain #Crypto
Buy and hold in spot.
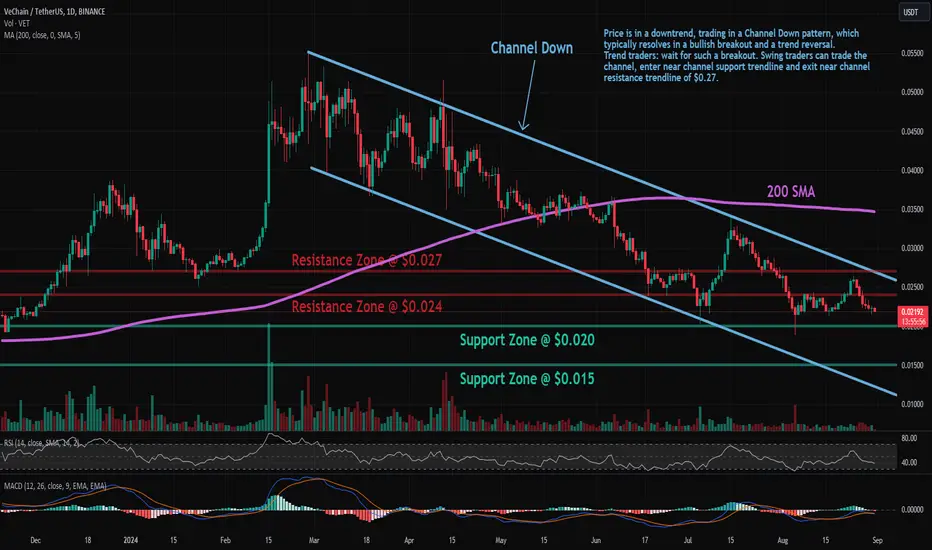
VET (VeChain): Channel DownTrade setup : Price is in a downtrend, trading in a Channel Down pattern, which typically resolves in a bullish breakout and a trend reversal. Trend traders: wait for such a breakout. Swing traders can trade the channel, enter near channel support trendline and exit near channel resistance trendline of $0.27.
Pattern : Price is trading in a Channel Down pattern. With emerging patterns, traders who believe the price is likely to remain within its channel can initiate trades when the price fluctuates within its channel trendlines. With complete patterns (i.e. a breakout) - initiate a trade when the price breaks through the channel's trendlines, either on the upper or lower side. When this happens, the price can move rapidly in the direction of that breakout. Learn to trade chart patterns in Lesson 8.
Trend : Short-term trend is Strong Down, Medium-term trend is Down and Long-term trend is Strong Down.
Momentum : Price is neither overbought nor oversold currently, based on RSI-14 levels (RSI > 30 and RSI < 70).
Support and Resistance : Nearest Support Zone is $0.02, then $0.015. Nearest Resistance Zone is $0.024, then $0.027.
#VET/USDT breaks the Diagonal Trendline in 1-Hour TF!#VET/USDT breaks the Diagonal Trendline in 1-Hour TF!
NYSE:VET can pump hard if CRYPTOCAP:BTC gives a room. The local resistance level is PDH $0.02345 and the support level is PML $0.02211.

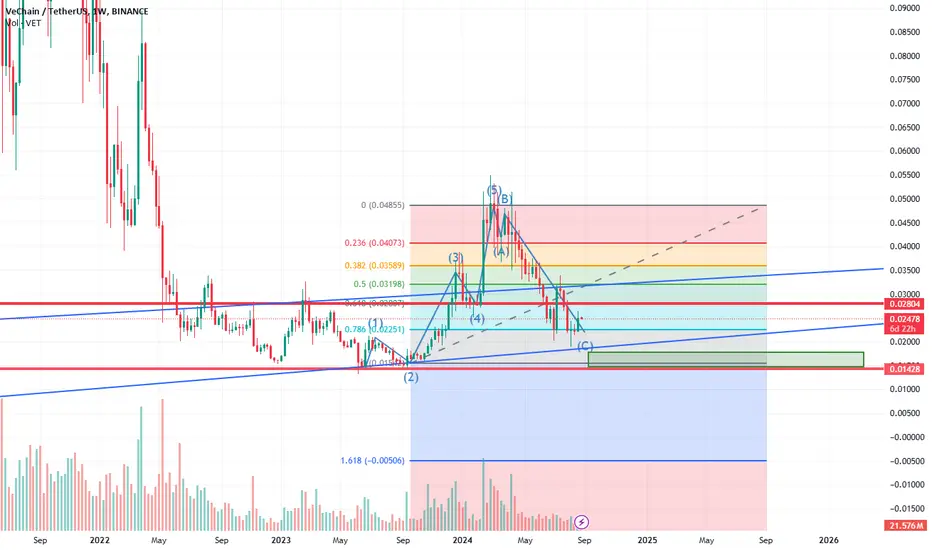
VECHAIN [LONG] Coming out of a 1-5 elliot wave we had a retracement to our 0.786 level and even a WICK down to our multi-year channel that confirms we've established these lows. Our levels off of our FIB from SEPT2024 are also being confirmed with our resistance/support around 0.618. If we wick below our low of our channel this will be a good "buy the dip" opportunity with "a shakeout before we break out" into another 1-5 wave pattern. We have to clear 0.02804 before this will be a secondary confirmation with the rules of the "Elliot wave theory" taken into account. DCA is the play here, at our lower levels and even once we clear that # with the rules in play. Happy investing!
$VETUSDT Stay Bullish on 2025good coin RWA for long term, stay hold to the moon
keep calm road to 1$
Possible 2 XDaily TF
1 - ema 20 crosses ema 50, down. 50% drop in price follows from April to July 24. 20 hasn't crossed back up yet, but showing signs of a support/floor.
2 - 20 did not make it back for a cross up. But price action tagged along on BTC rise. Followed by retrace.
3 - Increased volume. Visual signal for long...
*** Possible 2 X from price 0.021***
1HR TF
4 - Short term signs of a rise. 20 ema crossed 50. price heading towards a touch with the 200ema. Then anticipate a pullback. Use this TF in confluence with the D TF to execute a possible long entry. If volume good on the bounce and BTC showing strength, wait for confirmation to enter long.
15 Min TF
As per Anchored Volume profile and diagonal resistance line, target entry price is 0.02281

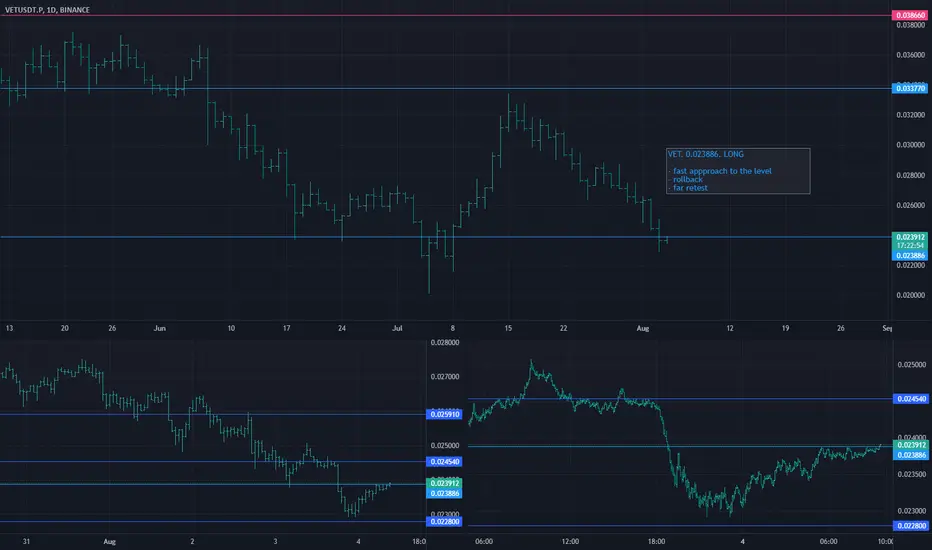
Intraday. VET. 0.023886. LONGThe token approached historical levels quite quickly. There was no impulse after the level was broken. There are signs of a pullback on minor timeframes. Looks like a good false breakout.
Daily Inverse HS Setup---6 Month support looks testedI was charting 6 month supports and VET caught my eye. Here we are seeing the lower time frame daily structure that has formed with inverse head and shoulders. But the 6 month chart is very impressive and the head of this daily inverse HS tested deeper into the 6 month support. This is an easy invalidation daily trade with the 6 month thesis. This could very well be bottomed and ready for the bull run. We'll see.
