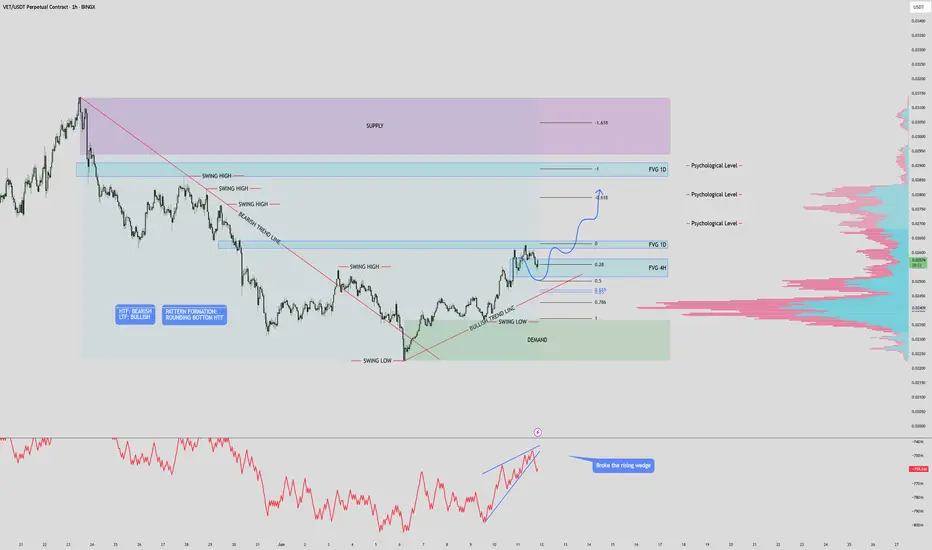
$VET USD 1HR INCOMING PUMP?Structure & Zones
Price is trading between a clear supply zone above and a demand zone below, offering defined areas for reaction.
Two unfilled FVGs on the 1D timeframe above current price could act as magnet zones for price continuation.
A 4H FVG just beneath current price is nearly filled — pote
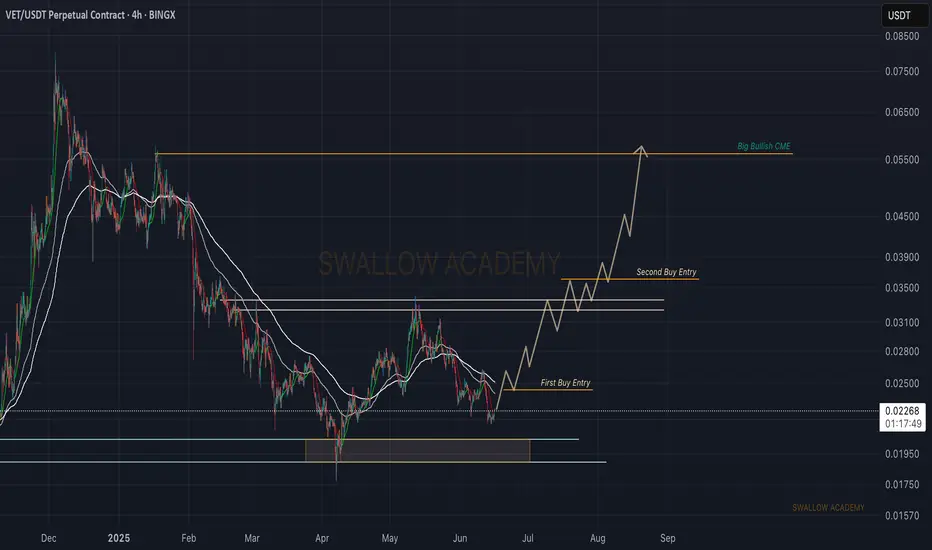
VeChain (VET): Huge CME Gap Near $5,60 | Bullish MovementAs markets are showing strong buyside dominance, so does the VET coin, where we seem to have established some sort of local bottom. If we keep similar buyside dominance, we will be seeing a good upward movement where, firstly, we will be targeting the $0.333, after which we will be targeting the bul
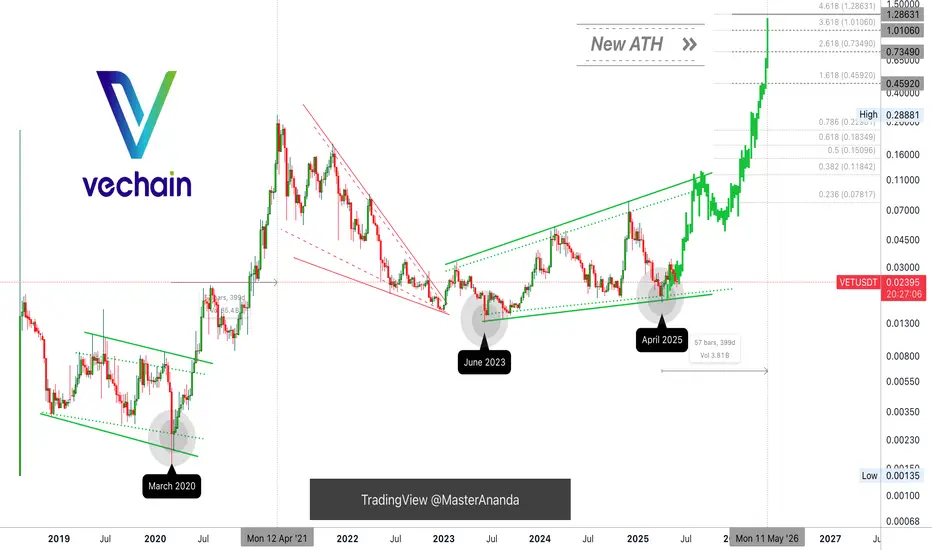
Vechain, Pick Your Own All-Time HighA mirror image from 2020-2021 would put a new all-time high for VETUSDT (Vechain) around mid-May 2026. Starts late ends late, right?
This is a great chart. Vechain hit bottom June 2023 and has been consolidating within a rising channel. A rising channel as in higher highs and higher lows. Now, this
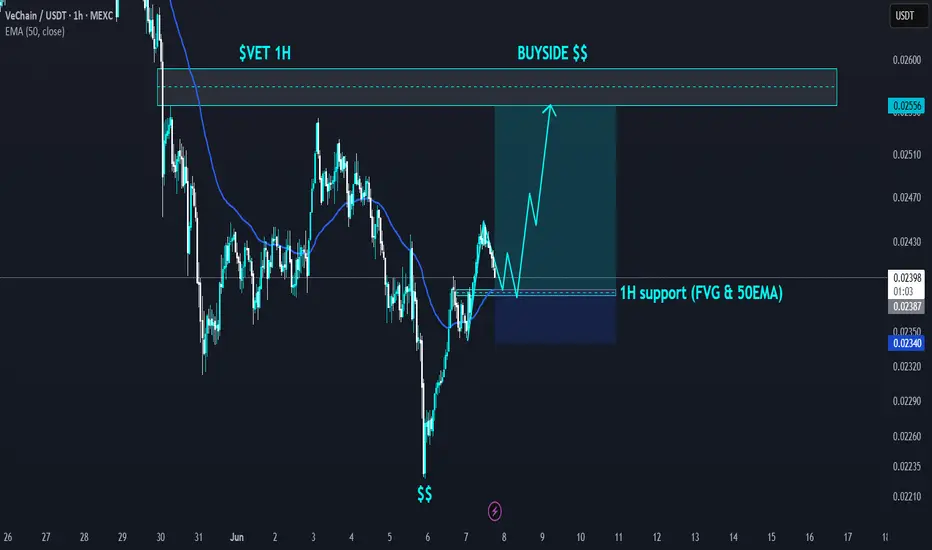
$VET sell side liquidity swept, buy side liquidity in sight!NYSE:VET has formed a classic double bottom pattern. The second leg has swept sell side liquidity and is heading towards the nearest area of interest.
Good luck traders!
Kieza Tradez
#VET/USDT#VET
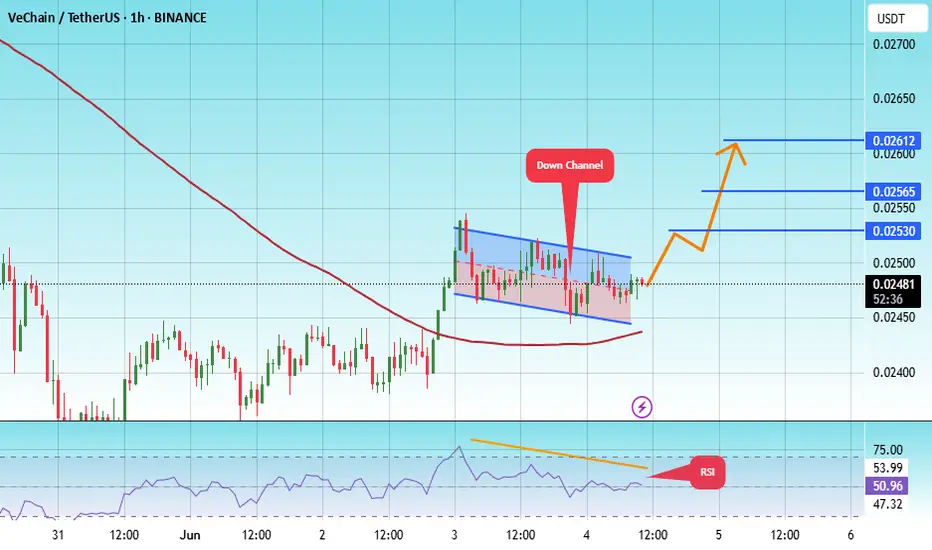
The price is moving within a descending channel on the 1-hour frame, adhering well to it, and is heading towards a strong breakout and retest.
We are experiencing a rebound from the lower boundary of the descending channel. This support is at 0.02456.
We are experiencing a downtrend on the RS
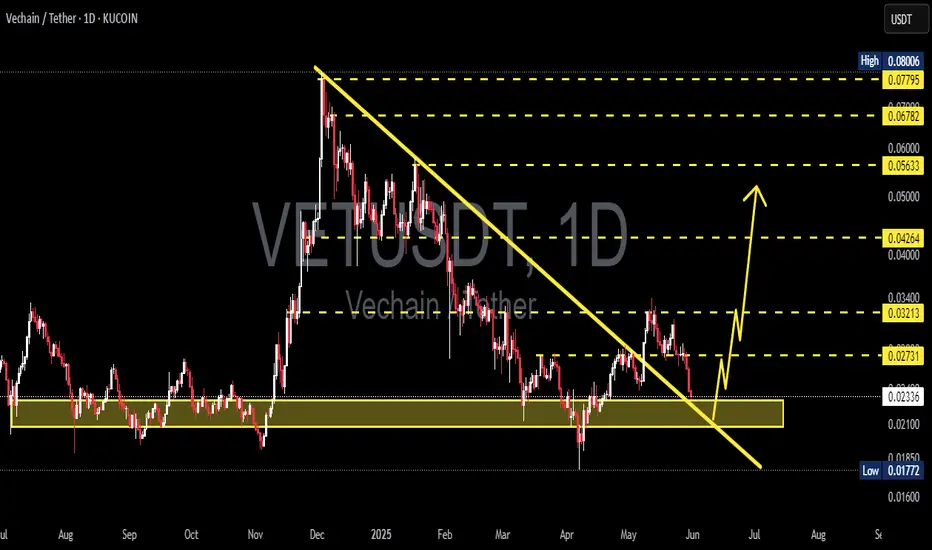
VETUSDT 1D Analysis VET ~ 1D Analysis
#VET This support block might be something you can start considering to start buying back from here with a short-term target of at least 10%++
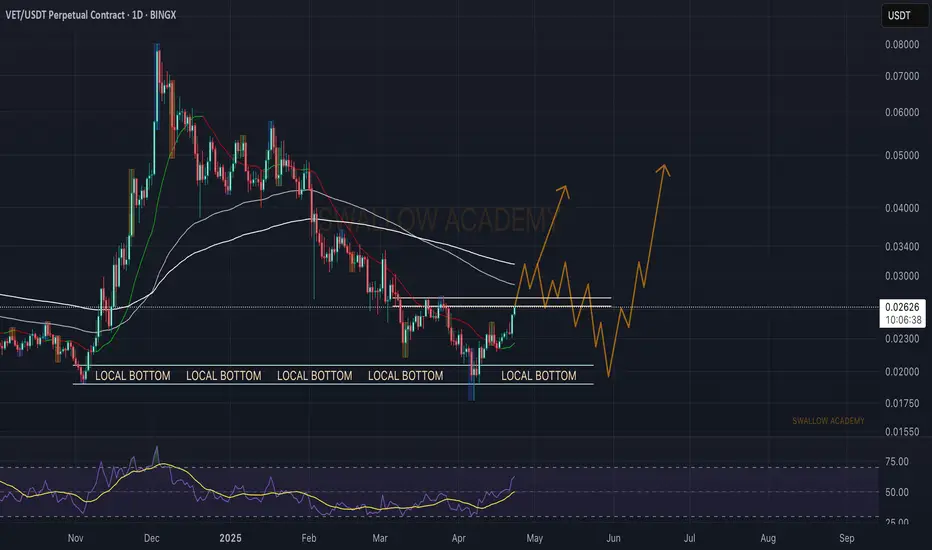
VeChain (VET): Aiming For 200EMA on Daily TimeframeVeChain has bounced well from the local bottom, where price might be heading now towards the 200EMA line once we see a proper breakout from the current resistance zone where price is at right now.
Swallow Academy
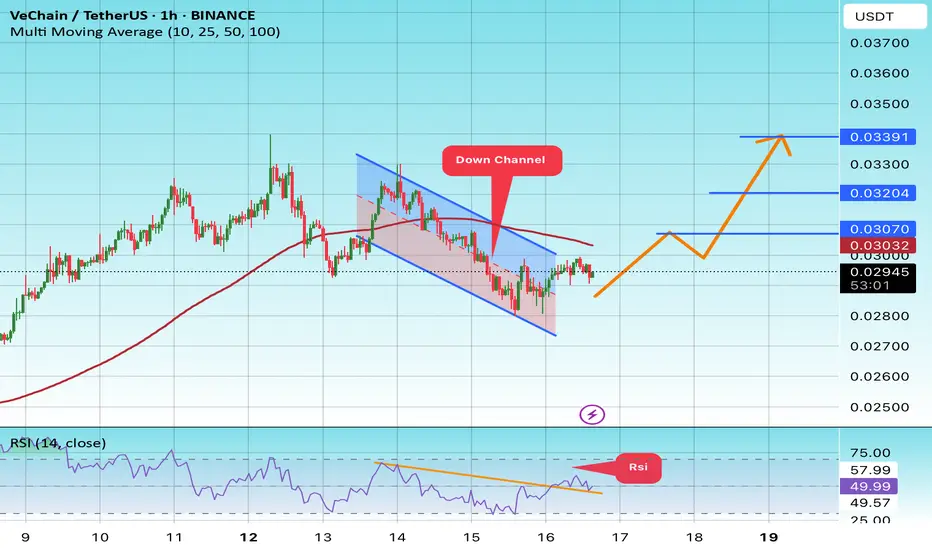
#VET/USDT#VET
The price is moving within a descending channel on the 1-hour frame and is expected to break and continue upward.
We have a trend to stabilize above the 100 moving average once again.
We have a downtrend on the RSI indicator that supports the upward move with a breakout.
We have a support a
TradeCityPro | VETUSDT The Best Entry Opportunity Awaits👋 Welcome to TradeCityPro Channel!
Let’s dive in and analyze one of the veteran coins in the cryptocurrency space, VET, which has a high potential for movement. Together, we’ll identify its entry triggers.
🌐 Overview Bitcoin
Before starting the analysis, I want to remind you again that we move
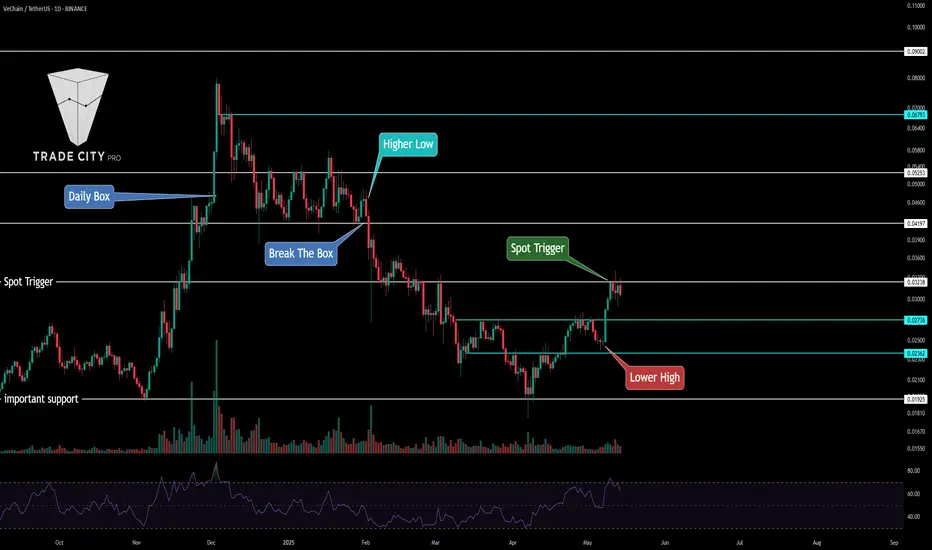
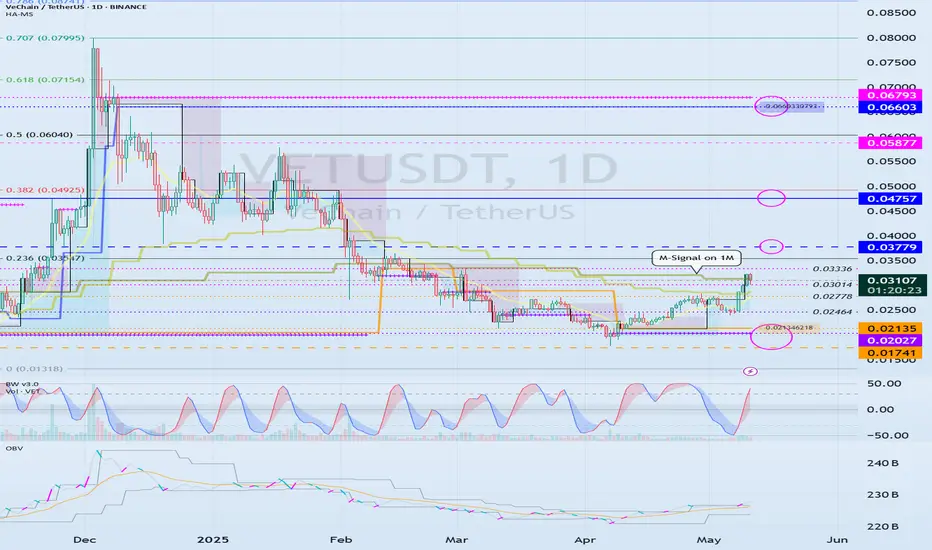
Check if it can break through 0.03779-0.04757 at once
Hello, traders.
If you "Follow", you can always get new information quickly.
Have a nice day today.
-------------------------------------
(VETUSDT 1W chart)
Support zone: 0.00440-0.101741
Resistance zone: 0.03779-0.04757
If it breaks through the resistance zone upward and maintains the price,
See all ideas
Summarizing what the indicators are suggesting.
Oscillators
Neutral
SellBuy
Strong sellStrong buy
Strong sellSellNeutralBuyStrong buy
Oscillators
Neutral
SellBuy
Strong sellStrong buy
Strong sellSellNeutralBuyStrong buy
Summary
Neutral
SellBuy
Strong sellStrong buy
Strong sellSellNeutralBuyStrong buy
Summary
Neutral
SellBuy
Strong sellStrong buy
Strong sellSellNeutralBuyStrong buy
Summary
Neutral
SellBuy
Strong sellStrong buy
Strong sellSellNeutralBuyStrong buy
Moving Averages
Neutral
SellBuy
Strong sellStrong buy
Strong sellSellNeutralBuyStrong buy
Moving Averages
Neutral
SellBuy
Strong sellStrong buy
Strong sellSellNeutralBuyStrong buy
Displays a symbol's price movements over previous years to identify recurring trends.