VETUSDT.P trade ideas

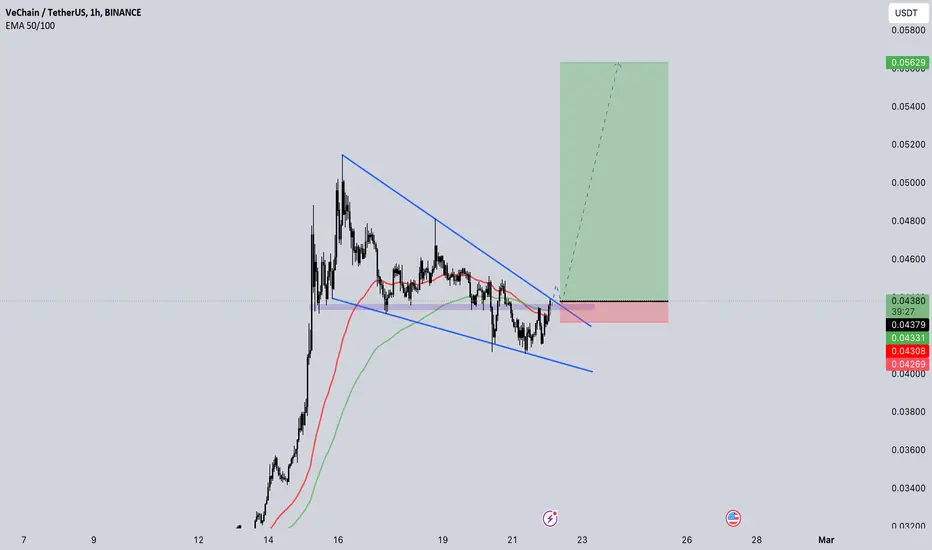
#VETUSDT CONTINUED GROWTH TO $0.55LONG #VETUSDT from $0.0515
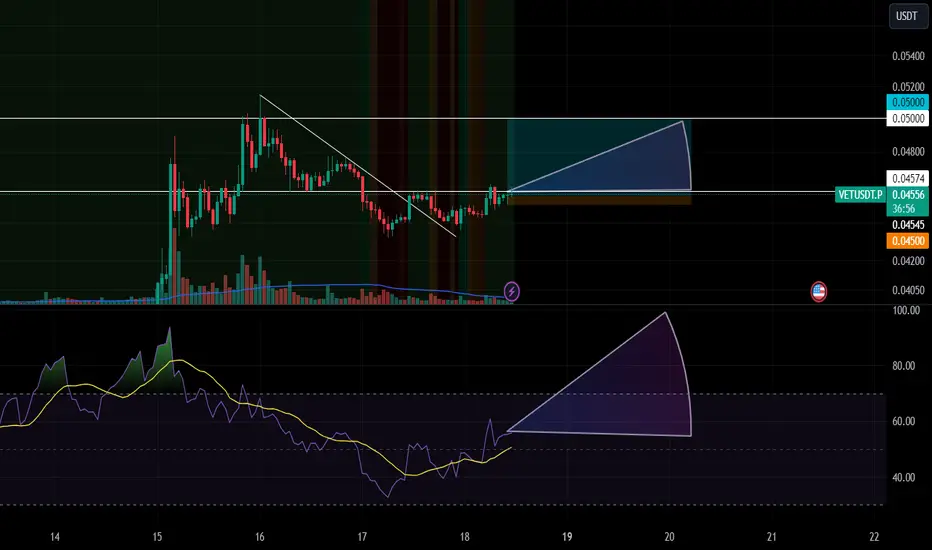
1h TF. This instrument is currently in the growth leaders, the upward movement structure continues globally, upon reaching the $ 0.05150 mark, we have started a sideways movement in which the price is currently located, trading volumes are quite high, there is a good price rounding to the maximum of the current growth after the breakdown of the marked hourly slope, I expect to see continued growth after the breakdown of the high with further movement to the level of 0.055$

VETUSDT IDEAUPDATE
Finally #vet Hits Even Surpassed Our Target This Is How Patience & Grip On Technical Analysis Pays Of Breakout Retest & Hits Targets📈
VeChain(VET): Good Drop To Come? VeChain caught our attention with really sweet potential for some drops to happen!!
As BTC is getting weaker currently, it is affecting the VET coin heavily, as you can see.
We are looking for those EMAs and also that middle line of Bollinger Bands as well.
Swallow Team

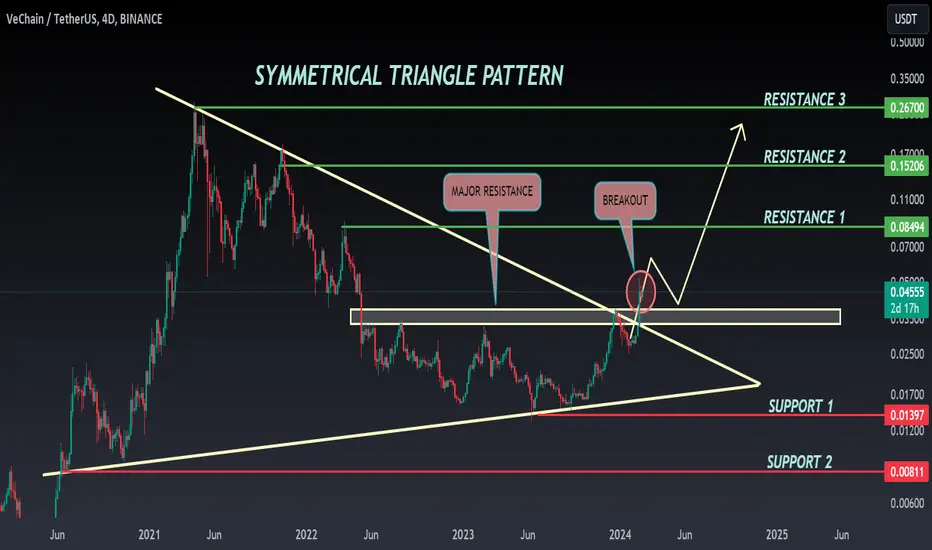
VET ANALYSIS (BREAKOUT)🔮 #VET Analysis - Breakout 🚀🚀
💲💲 There is a breakout of Symmetrical Triangle Pattern in #VET and trying to retests the level. It's a 4D time frame breakout and we will see more higher price in long-term. If the price perfectly retest the major resistance area then there will be a confirmation of bullish movement in #VET 📈📈
💸Current Price -- $0.04550
📈Target Price -- $0.08494
⁉️ What to do?
- We have marked crucial levels in the chart . We can trade according to the chart and make some profits. 🚀💸
#VET #Cryptocurrency #Breakout #DYOR
Can VET Climb the Wyckoff Ladder? Decoding the ChartThe VET/USD chart shows an interesting development with a potential resemblance to a Wyckoff accumulation pattern. This pattern, if confirmed, could theoretically indicate a move beyond $0.20. However, remember that the crypto market is volatile and reaching this target is not guaranteed. This is not financial advice, and other factors are crucial before investing. What are your thoughts on this potential pattern and its implications for VET?

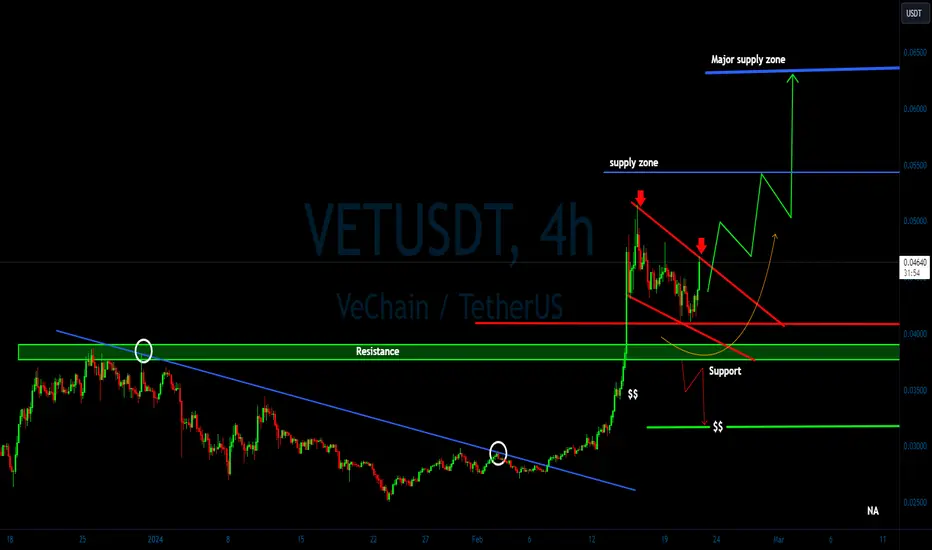
VET/USDT descending channel upward move? 👀 🚀
💎Paradisers! Our focus shifts to #VETUSDT as it navigates a descending channel, now nearing channel resistance with a strong bullish outlook.
💎 Throughout its path, $VeChain has been tracking along a descending channel but is currently setting its sights on the supply level at $0.05438. A breakthrough above the channel resistance and subsequent maintenance of upward momentum could herald a bullish journey towards the $0.05438 supply level. Surpassing this supply could open the doors to targeting even higher major supply zones.
💎 For the astute traders among us, should the upward trajectory begin to lose steam, keep an eye out for a potential bullish resurgence from the support level at $0.03812. Falling beneath this mark could indicate a transition towards bearish conditions.
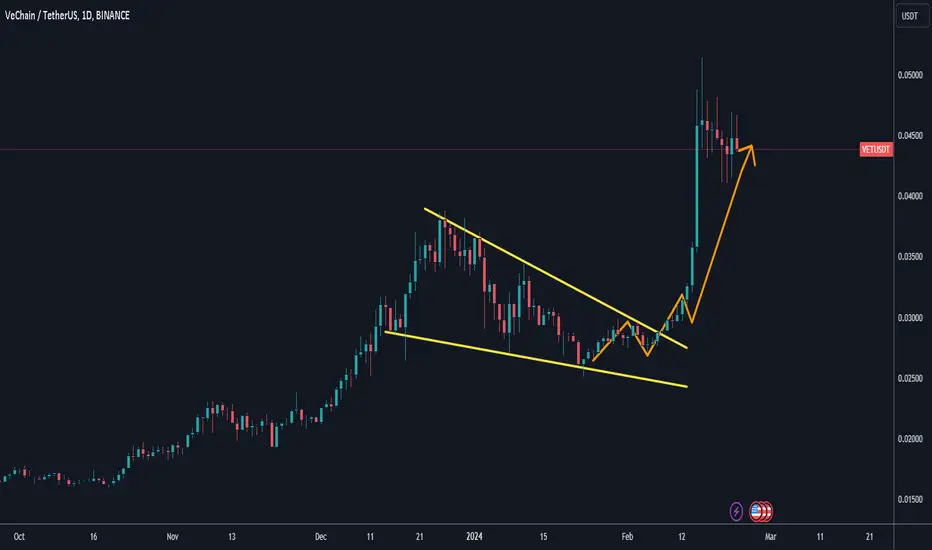
$VET FALLING WEDGE- BULLISH CONTINUATIONVechain has now developed a very nice falling wedge which is soon to break to the upside.
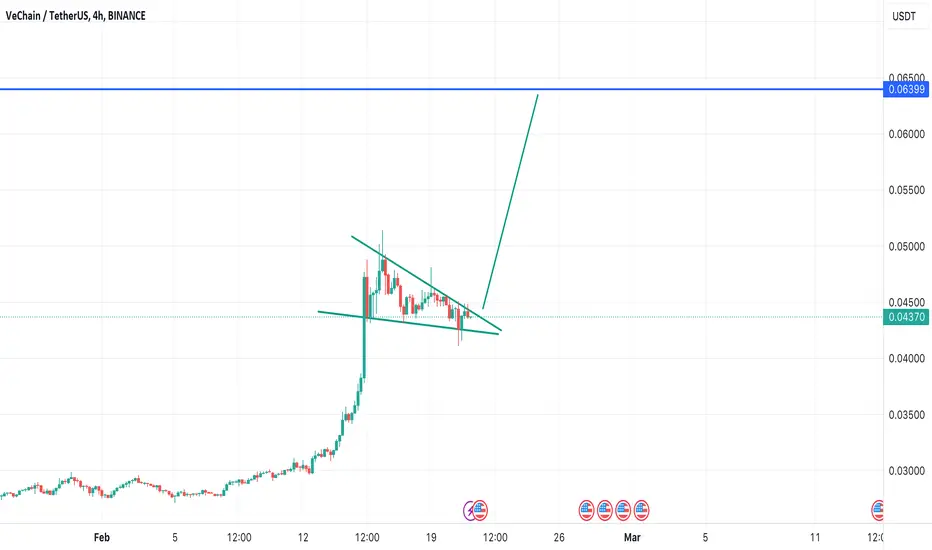
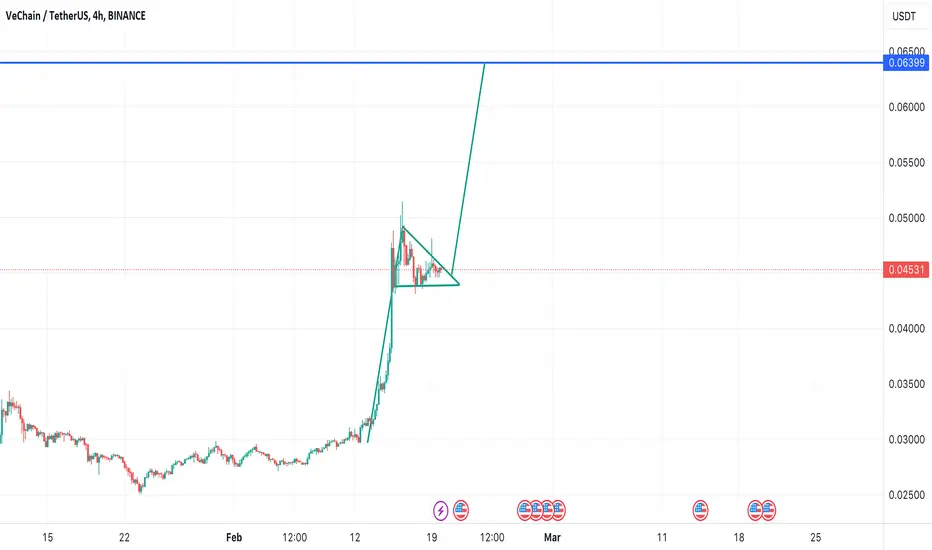
$VET BULL PENNANT- TARGET 0.064CRYPTOCAP:VET has formed a nice bull pennant. Looking for a continuation after a successful breakout-retest from this pennant.
VET/USDTITS GOOD LONG RIGHT NOW AFTER breakout OR U GUYS ALSO CAN hold in spot its . Good COIN TOO LONG IT with 35X good coin for us
VETUSDT ANALYSIS As a novice in the realm of analysis, I've recently delved into analyzing VETUSDT using Fibonacci retracement levels on the weekly timeframe. My approach involves identifying key resistance levels and setting targets accordingly.
Given my beginner status in analysis, I am eager to receive your insights and feedback on my method and conclusions. Additionally, I would greatly appreciate any guidance or suggestions you could offer to help refine my approach.
Thank you for taking the time to consider my analysis and share your expertise. Your feedback will play a crucial role in my growth as a trader.
Warm regards,
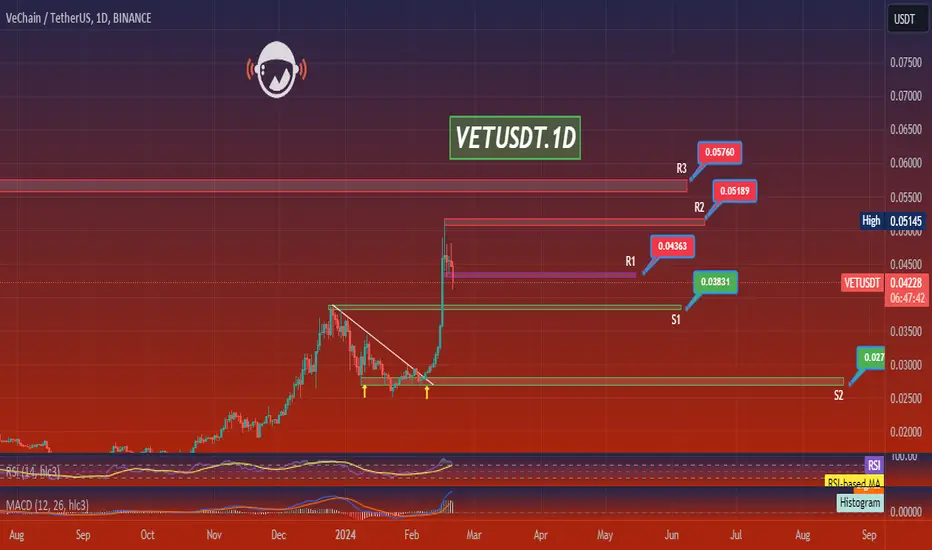
VETUSDT.1DBased on the provided market data, the VET/USDT pair is currently trading at a price of 0.042 USDT. The 4-hour chart indicators show that the relative strength index (RSI) is at 41.24, which suggests that the cryptocurrency is neither overbought nor oversold. The moving average convergence divergence (MACD) is at 0.00010, indicating a relatively balanced market with no clear signs of a bullish or bearish trend.
The Bollinger Bands (BB) on the 4-hour chart is at 0.046, indicating moderate price volatility. The support levels on the 4-hour chart are at 0.039, 0.038, and 0.035 USDT, while the resistance levels are at 0.044, 0.048, and 0.050 USDT.
On the daily chart, the RSI is at 68.61, which is approaching overbought territory, suggesting that a price correction might occur in the near term. The MACD is at 0.0043, which shows a slightly bullish market. The BB is at 0.04852, indicating moderate price volatility. The support levels on the daily chart are at 0.038, 0.034, and 0.032 USDT, while the resistance levels are at 0.046, 0.051, and 0.055 USDT.
On the 7-day chart, the RSI is at 79.04, which is in the overbought territory, suggesting a possible price correction in the future. The MACD is at 0.0045, which shows a bullish market. The BB is at 0.04853, indicating moderate price volatility. The support levels on the 7-day chart are at 0.033, 0.026, and 0.020 USDT, while the resistance levels are at 0.074, 0.081, and 0.088 USDT.
In conclusion, the market data suggests that the VET/USDT pair is currently in a balanced state with a slight bullish bias, especially in the long-term (7-day) perspective. However, the relatively high RSI on the daily and 7-day charts suggests that a price correction might occur in the near term. As always, it's important to consider other factors and conduct further research before making any investment decisions.
VET Following the waveVeChain is for sure in a bullish momentum and i am trying to follow the wave here. It's stuck and ranging in support zone, and it looks like it's accumulating before another pump. My target is the resistance zone at 0.058 and invalidation below support zone at 0.041

VET LongThere is a downtrend on the VET 1 hour chart and RSI that have both retested, therefore I predict a bullish swing represented with the projection tool.

VET LongThere is a downtrend on the VET 1 hour chart that has retested and I project a bullish swing.
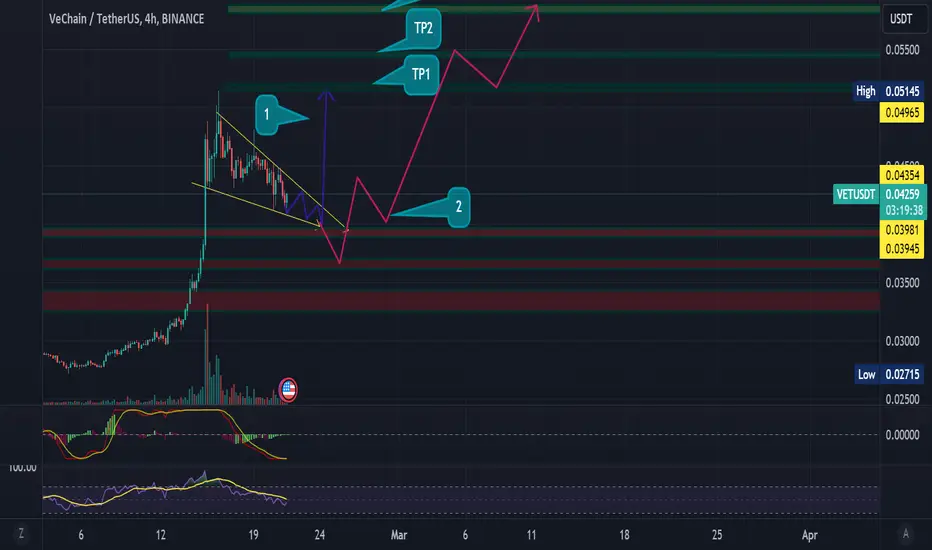
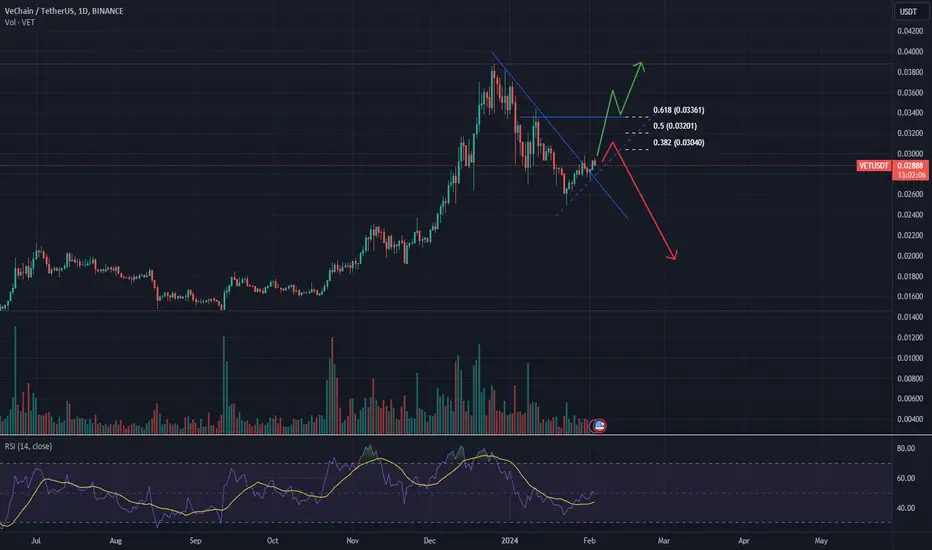
VET 2 scenariosI think at this point there is one of 2 scenarios:
1- Its either just a correction in the upward trend and you can see the green arrow to where it would lead.
2- It became a downward trend which will follow the red arrow.
This all depends on how it will react to the Fibonacci resistance levels.
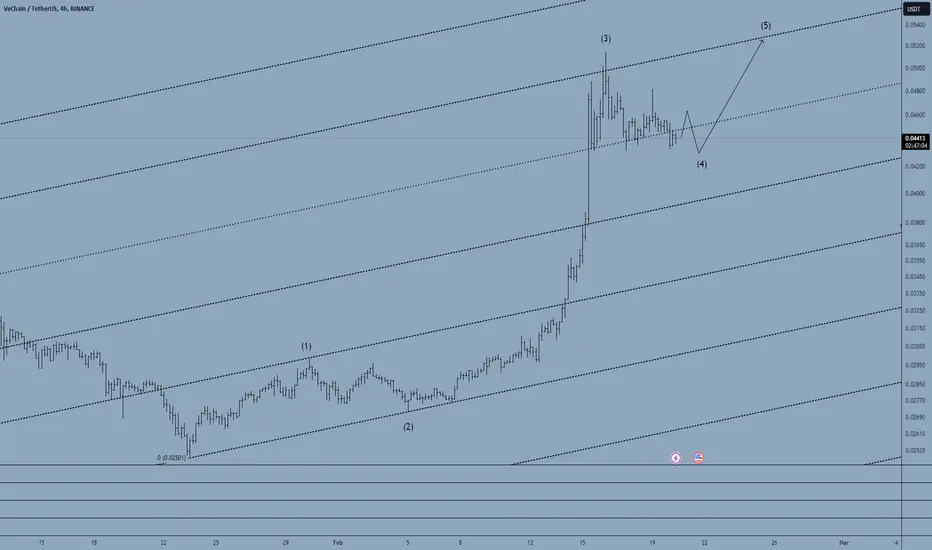
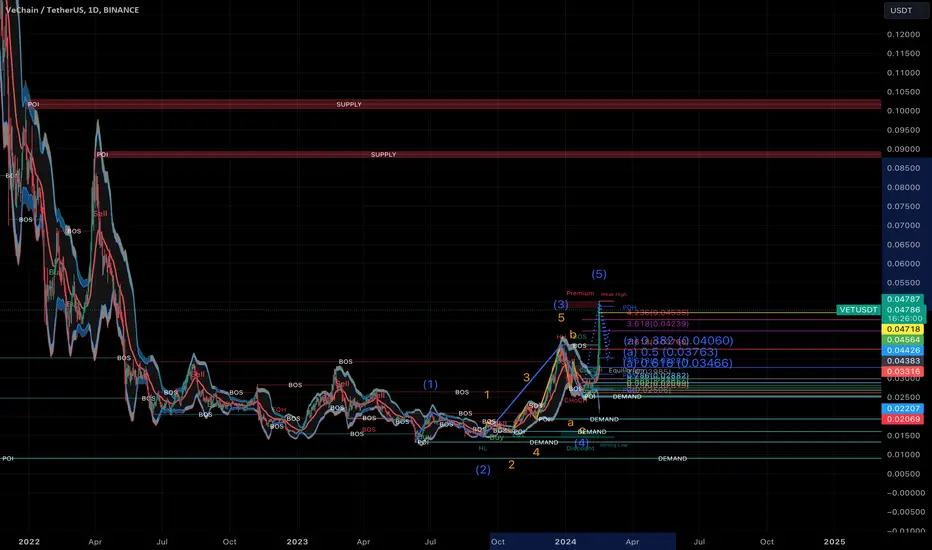
VET - $0,09 - 85% increaseVTHO has made massive increaes yesterday. Will Vechain be next? VTHO has reached a strong resistance level, but VET not yet. VET can go to $0,09 which is a potential increase of approx. 85%. Currently VET is in an Elliot wave 5 which is very bullish.
VET Challenging Resistance and Could Pull Back to $0.03495BINANCE:VETUSDT is attempting a challenge at the $0.04820 resistance level. If it manages to close a daily candle above this threshold today, it could have the foundation needed to continue rising in the next 48 hours. VET could subsequently rise to the next barrier at $0.05750.
On the other hand, failure to close today’s trading session above $0.04820 may trigger a wave of panic selling from traders. This could then put the VeChain price at risk of dropping to the immediate support level at $0.03495 in the following week. Continued sell pressure may even pull the altcoin’s value down to within the consolidation channel between $0.02935 and $0.03495.
Despite the potential threat that the VeChain price may correct in the coming week, there is a medium-term positive trend line that has formed on the altcoin’s daily chart over the past couple of weeks. This trend line could stay in effect for as long as VET remains above the middle level of the sideways channel, which is situated at around $0.03207.
Technical indicators on the crypto’s daily chart point to a continuation of VET’s positive trend in the next 48 hours. Both the Moving Average Convergence Divergence (MACD) and the Relative Strength Index (RSI) are flagging bullish.
The MACD line is breaking away above the MACD Signal line, which may be a sign that VET’s bullish trend is growing stronger. In addition to this, the RSI line is also rising above its Simple Moving Average (SMA) line. Traders generally see this as a signal that bulls are growing stronger against bears. However, the steep ascent of both technical indicators could be followed by a sharp drop soon, so traders may want to keep an eye out for any signs that VET’s bullish trend will turn bearish.

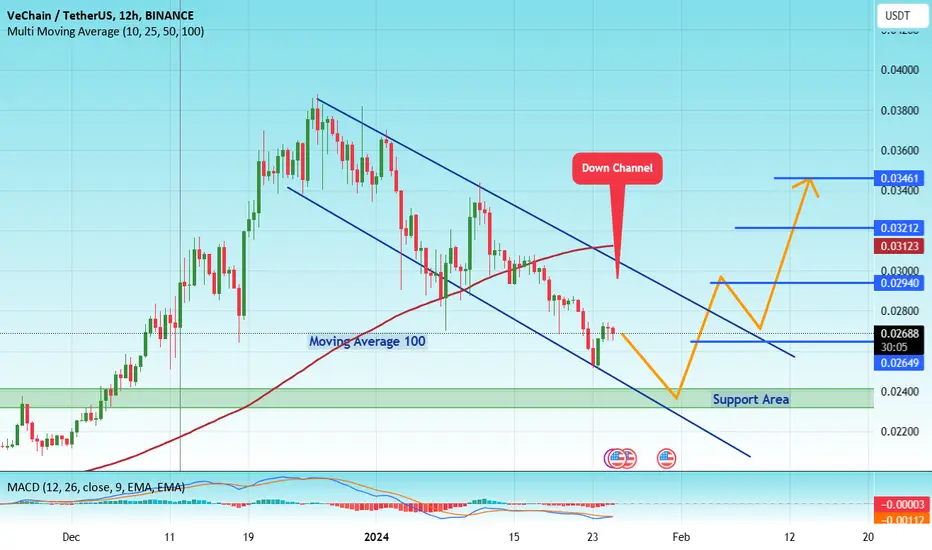
#VET/USDT#VET
The price is moving in a downward channel and sticking to it well
The price is expected to remain within it for some correction to the support level at 0.02400
The price is below moving average 100, so we have some correction to the support level
Entry price is 0.02400.
First target 0.02684
Second target 0.02940
Third goal 0.03212
Fourth goal 0.023461
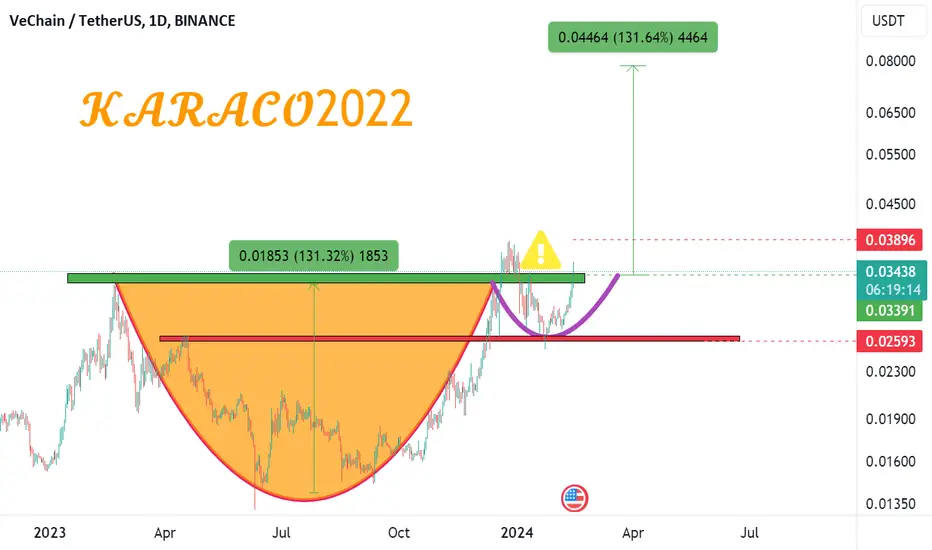
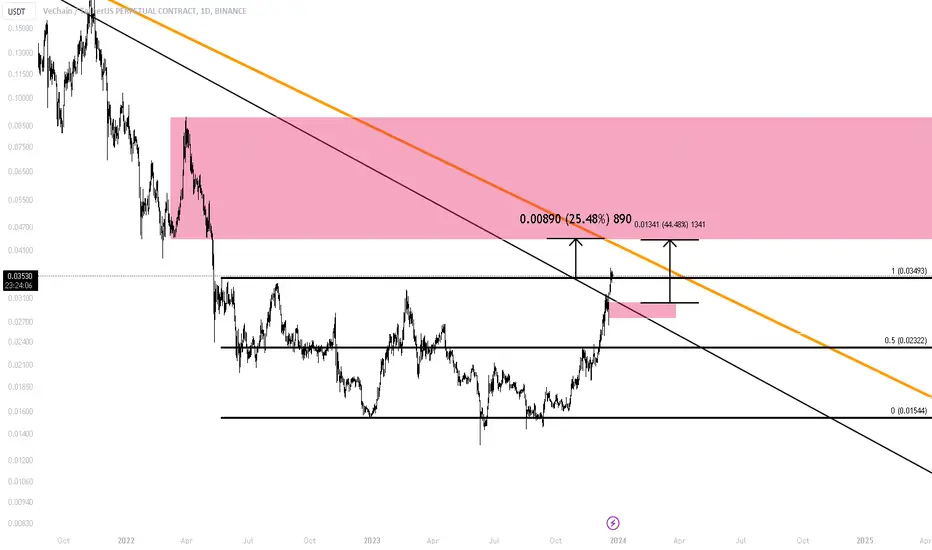
At the beginning of a big move, but wait, the accident is lurkinThis currency is ready to grow by 130% after breaking its important resistance range. This failure can be fake, so it is better to keep an eye on this currency and if it breaks the previous peak and stabilizes it, we can have a safe entry.