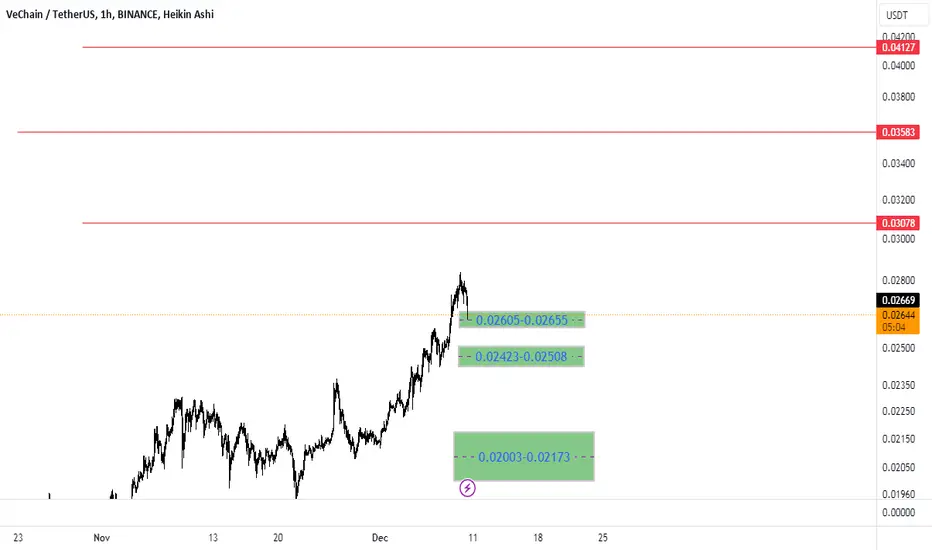
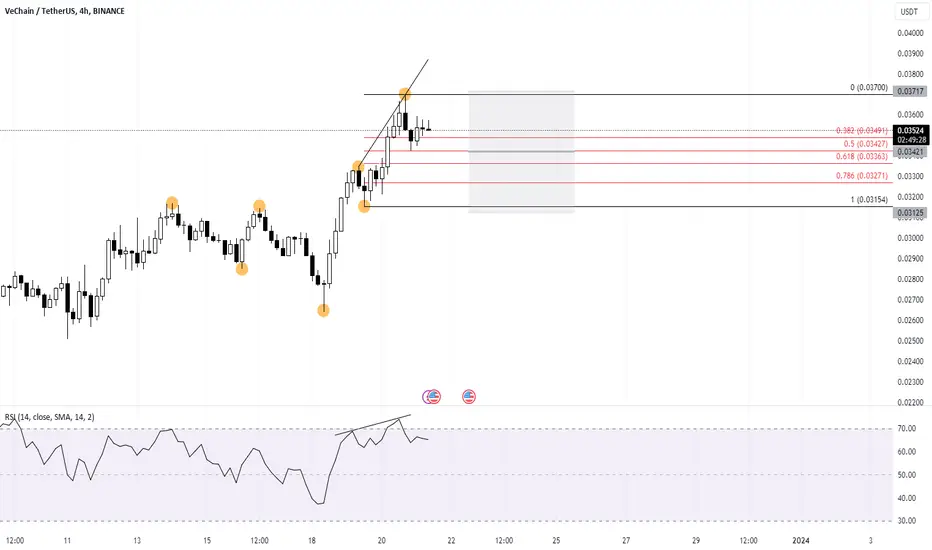
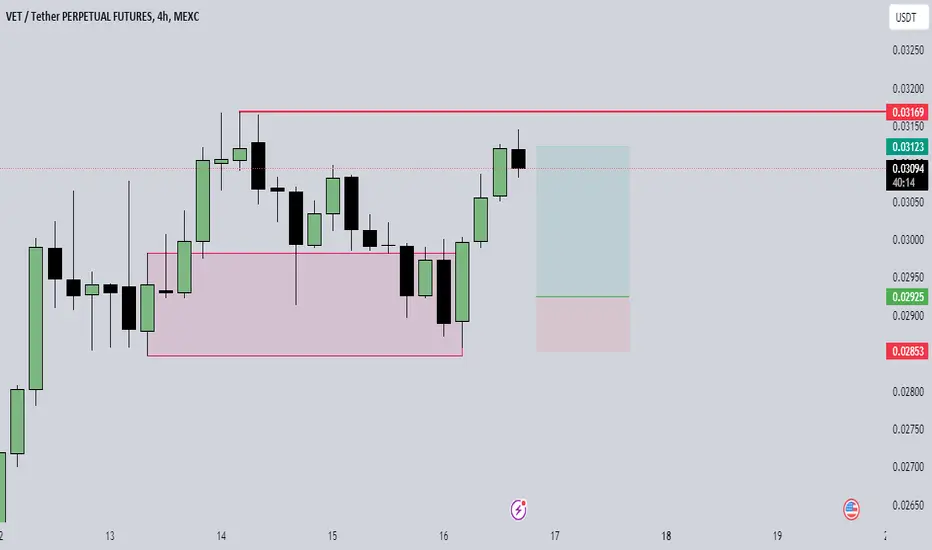
Mock Up Price Action for VET | Near-Mid Term (12HR)Mock Up Price Action for BINANCE:VETUSDT | Near-Mid Term (12HR)
- Watching and waiting for opportunities to enter short
Personal Approach & Base Chart Setup
- Stacked Parallel Channels for Grid of Confluence Points
- High Time Frame (HTF) Fib Extensions, Retracements, & Time Cycles
- Red Filled Horizontal Rectangles between areas of major Fib level from Extensions and Retracements
- Price Label Callout with Red Circle highlighting points of interest where I'd consider making a trade
- I will consistently monitor and adjust taking into consideration long/mid/near term price action and market conditions/news
Additional Remarks
Still watching and waiting for a movement like this before I consider entry into short. My most likely scenario to play out will be continued BTC ETF approval speculation and hype driven bullish pump for market leading into SEC decision, then upon the news dropping good or bad (IMO likely good and green light ETF approvals), a "buy the rumor sell the news" short term healthy pullback for the market. BTC has run for the past couple months and so in January my anticipated small/normal pullback correction and people taking profits playing to the buy the rumor sell the news.. Which this in my observation would initially present like a panic sell off of everything, but once folks realize BTC isn't going into the dirt and things stabilize out, range and accumulate, then ETH to take a turn in February next, before then the ALTs February into March. Money flowing from Large to Mid to Small to Micro cap as is the natural progression of things. And in March with the market having confirmed recovered and run bullish for all this time, some kind of bullish recovery top and then massive cascading dump leading into the BTC Halving event March through April, pulling back hard recovering, then May the beginning of a steady climb up and true bull cycle. I'm not chasing anything right now, as I believe its too risky to assume one way or the other. I Entered the market and made my trades October through November and essentially pulled out of all short term speculative positions/trading. I am now taking the opportunity to observe the market, watchlist and monitor the winners and price actions, map out potential bullish and bearish targets, and simply patiently wait for whatever this correction / crash / rug pull moment before cherry picking re-entering the market in earnest. Until then I will simply take advantage of quick trades in and out, in parallel to just accumulating my mid to long term bags of things I actually believe in like OKX:CSPRUSDT and BINANCE:XRPUSDT
VETUSDT.P trade ideas

VET on the moveWe see a multiple buy prints and our first target is the red line and there beyond the target print. DYOR

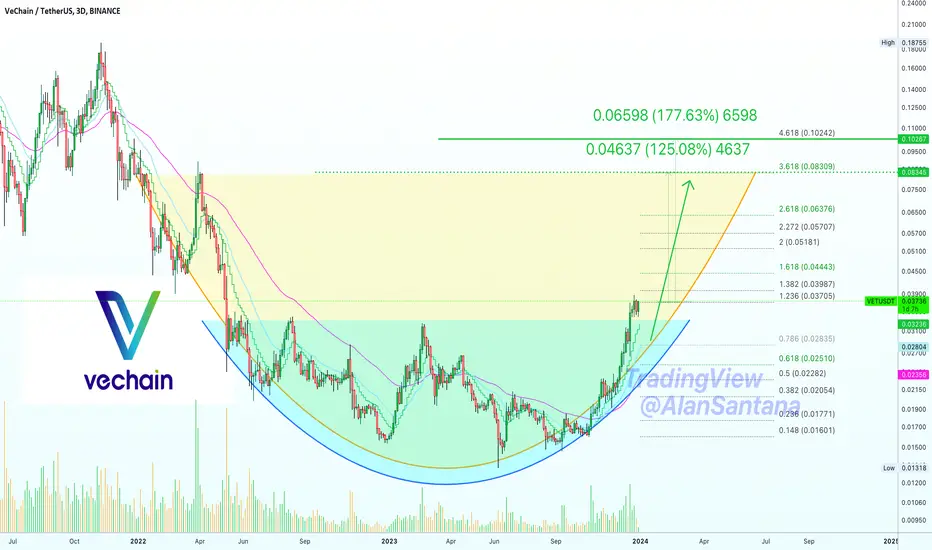
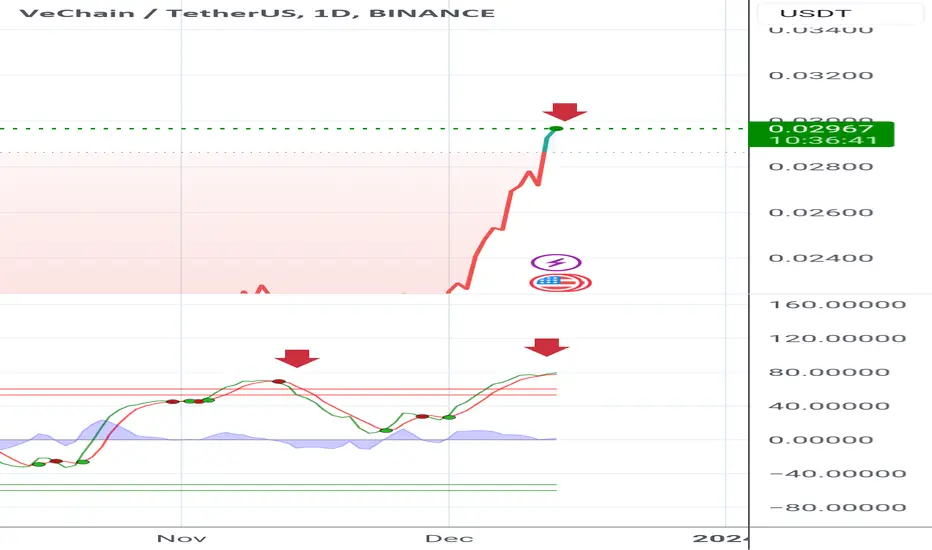
✴️ VeChain Double Cup (Fast 125%-175% Bullish Jump)I have to mention this because we have to look at both sides... The short-term bearish trade idea I shared recently for VETUSDT failed miserably... And that's good to be honest because we prefer to see prices going up rather than down.
Here we have a giant cup and another one even bigger.
VeChain is set for a massive explosion, a move that can develop within days and last only a few days to complete... That's my belief. It can happen really fast once it starts.
With that said, there is always room for retraces and corrections once the action is already on-going, allow for this in your planning.
✔️ Wishing you success.
✔️ Happy 2024.
Namaste.
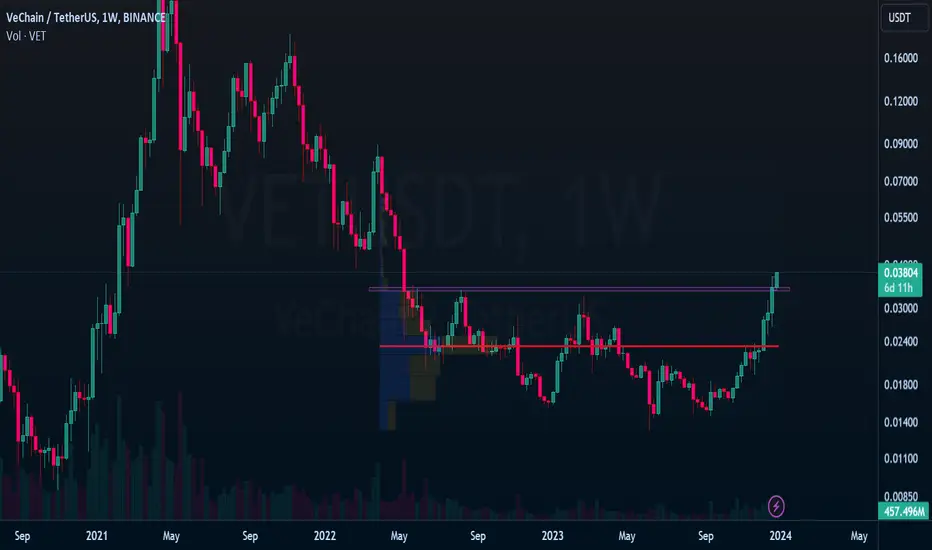
VET another breakoutVET breaks above 0.030-0.0338, which is new high since May 2022.
as long as price above 0.003. we are seeing more upside to next resistance 0.055
DYODD

Vetusdt Trading opportunityBased on the recent bullish trend in VET, the price has undergone a correction and is currently exhibiting a structure resembling a typical round bottom formation.
If this pattern materializes as expected, it could lead to the formation of a small cup before a potential breakout.
The chart indicates the presence of a buyback zone and an important external demand zone, both of which are acting as strong support levels. Additionally, there is an internal supply zone and established resistance targets.
Your insights and engagement through comments and likes are appreciated. Thank you.

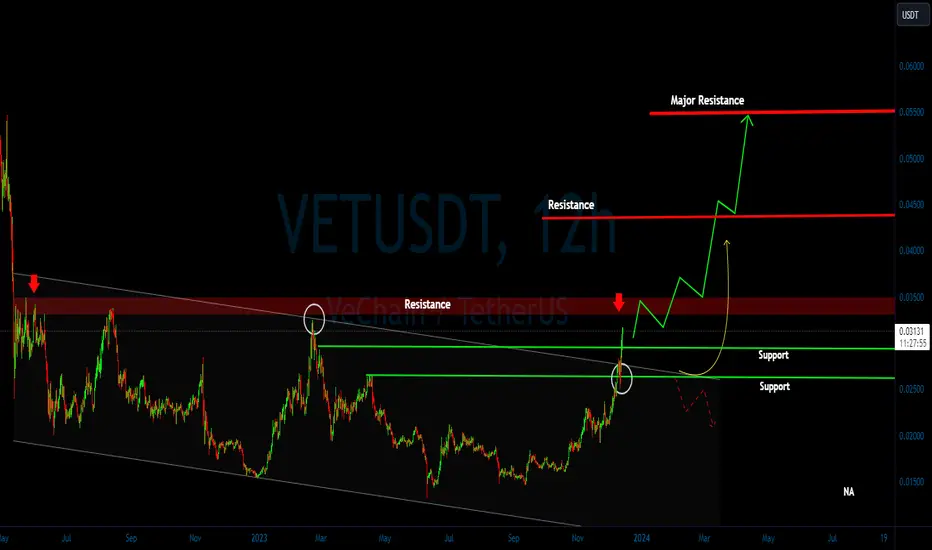
vet bullish on weekly !BINANCE:VETUSDT weekly reg broken. now it will pump very soon.
expecting a pullback.
you can buy and hold now or wait for a pullback
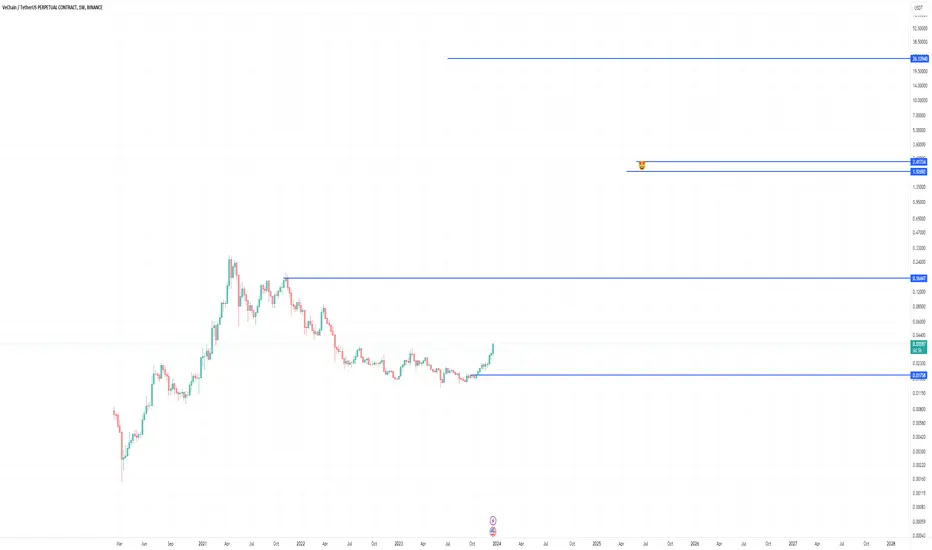
Vet long term chartVet long term chart, estimated to reach at least $1 around summer 2025 with max wicks up to 26. This is done using an experimental method. This is not financial advice
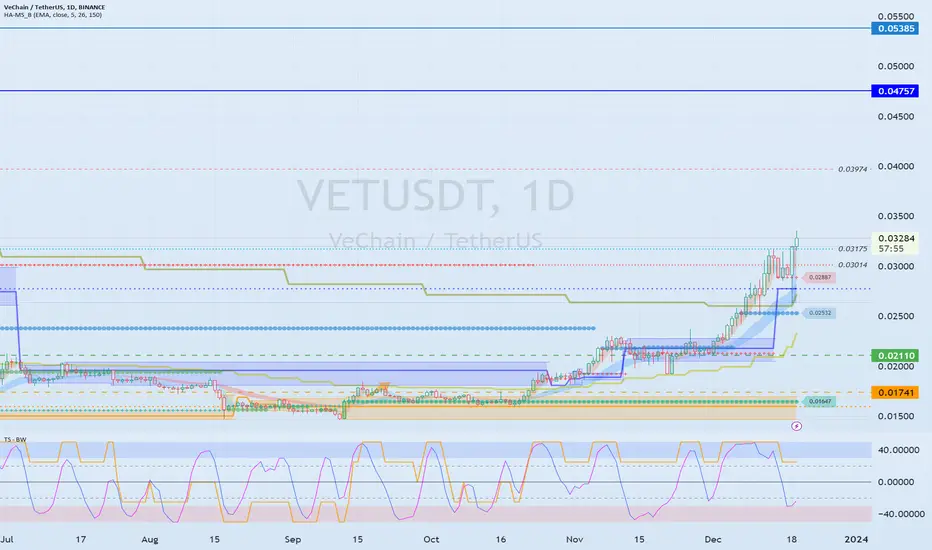
The key is whether the price can be maintained above 0.03175Hello traders!
If you "Follow" us, you can always get new information quickly.
Please also click “Boost”.
Have a good day.
-------------------------------------
(VETUSDT chart)
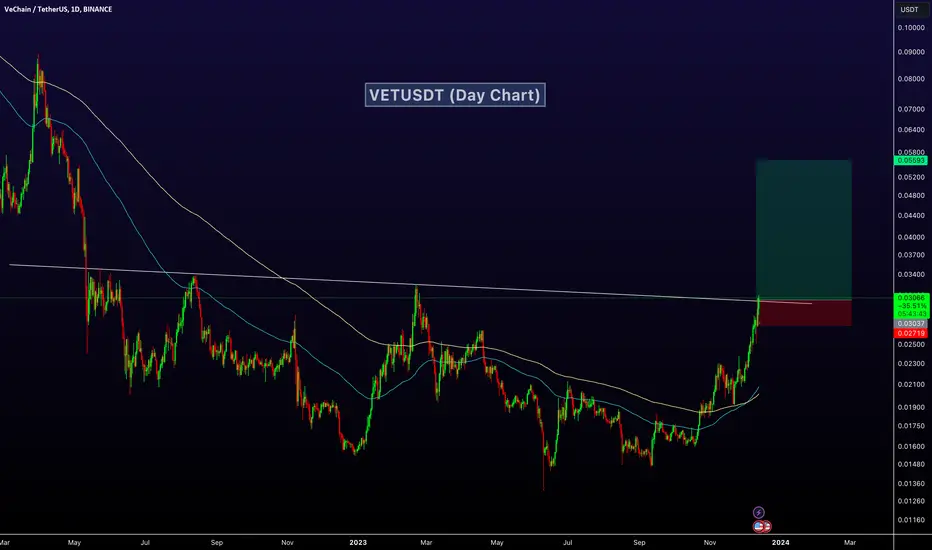
(1D chart)
As it rises above 0.02776, I think the possibility of a full-fledged upward trend has increased.
However, since the long-term moving average is still reversed, the key is whether the price can be maintained around 0.03175.
If that happens, it is expected to rise above 0.04757-0.05385 and escape the bottom range.
If it falls below 0.03014-0.03175,
1st: 0.02776
2nd: 0.02110
You need to check if you receive support near the first and second levels above.
--------------------------------------------------
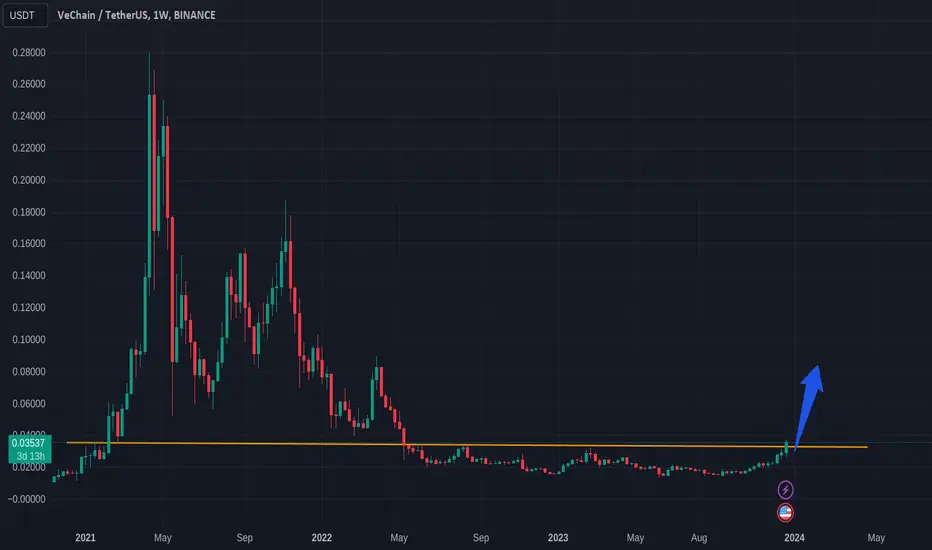
- The big picture
The full-fledged upward trend is expected to begin when the price rises above 29K.
This is the section expected to be touched in the next bull market, 81K-95K.
-------------------------------------------------- -------------------------------------------
** All explanations are for reference only and do not guarantee profit or loss in investment.
** Trading volume is displayed as a candle body based on 10EMA.
How to display (in order from darkest to darkest)
More than 3 times the trading volume of 10EMA > 2.5 times > 2.0 times > 1.25 times > Trading volume below 10EMA
** Even if you know other people’s know-how, it takes a considerable amount of time to make it your own.
** This chart was created using my know-how.
---------------------------------
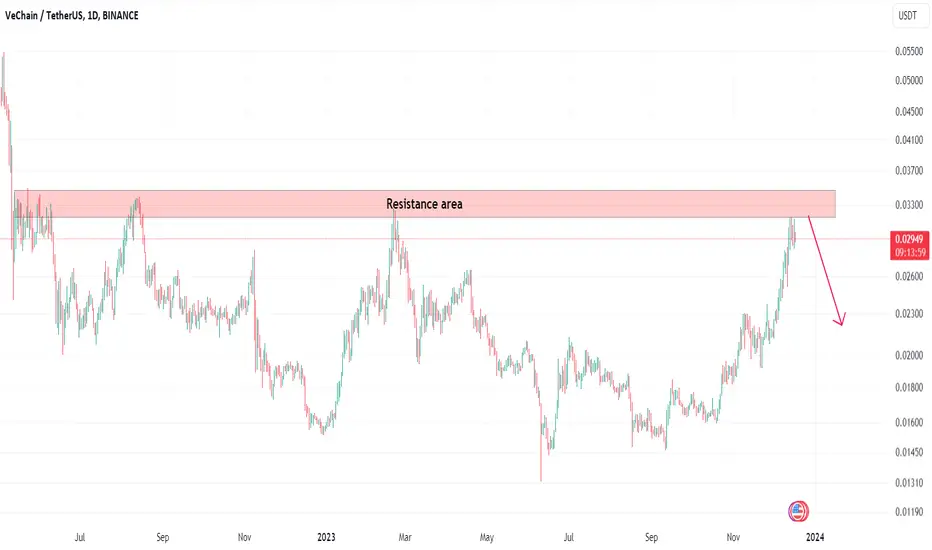
Vet look bearish #vet reach to resistance area and the area is very strong .
I think vet need some correction ..
Vet/usdt analysis by ict Considering the volume gap at the price of 0.133 and the shadows at the price of 0.144 that act as resistance, target 2 is guaranteed.

VETUSDT POSSIBLE LONG SET UP!Vetusdt pair broken stracture with force now retraced back to the point which broken the previous high.its helding very nicely,i might not get tapped on my entry ,my entry would be invalid if price breaks the previous buy before tapping on my entry

VET/USDT Bracing for Potential Breakthrough Resistance? 👀 🚀💎 Paradisers, focus on #VETUSDT as it showcases a promising development. The asset is approaching a crucial resistance level, with strong indications of an upward movement on breaching this barrier.
💎 Reflecting on #VeChain recent market behavior, it has consistently followed a descending channel pattern. Recently, it broke above this channel and is now gearing up to challenge the resistance at the $0.03793 zone. There’s a significant likelihood that NYSE:VET will embark on an upward journey, aiming to overcome this major resistance.
💎 #VET traders should remain versatile and ready for different outcomes. If it fails to sustain its upward trajectory and dips below the current demand level of $0.02741, the market's direction could shift. Traders may then need to pivot their focus towards a bullish recovery from a slightly lower demand level of $0.02653.
💎 Crucially, a fall below this lower demand level would be a signal to reassess the situation. Such a development could indicate challenges in maintaining the bullish trend, requiring a strategic reevaluation of the market approach. 🌴💰
VETUSDT Good Buy!VETUSDT Technical anlaysis Update
BINANCE:VETUSDT price is breaking through its major resistance line with high volume. We can expect a 50-100% upward move in the medium term.
Buy zone : Below $0.0307
Stop loss : $0.0272
Always Keep Stop Loss
Regards
Hexa
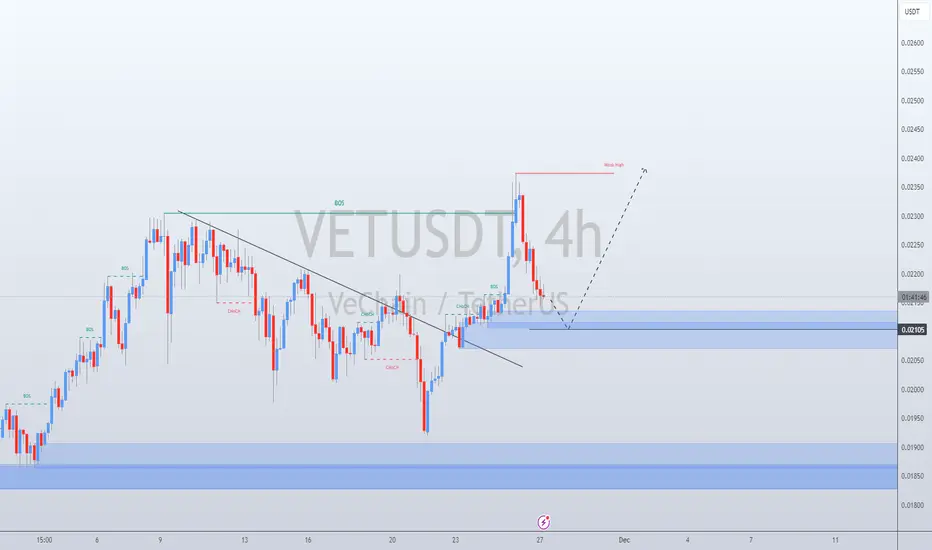
VET/USDT Bullish Outlook from Key Support Level? 👀 🚀VeChain💎 Paradisers, focus on #VETUSDT as it displays a promising pattern. The asset is currently maintaining a critical support level and is gearing up for a potential bullish movement.
💎#VeChain has shown a tendency to follow a descending trendline, breaking above it to initiate an upward trajectory. Presently, after retesting the trendline, it is demonstrating strong momentum at the key support level of $.02125. A break above the resistance at $.02188 could significantly increase the chances of a robust bullish movement. Should this upward momentum be sustained, NYSE:VET is set to target the resistance level at $.02262, with the possibility of extending to challenge further resistance at $.02372
💎 It’s also essential to be prepared for the scenario where #VET might fall below the support level of $.02123. In such an event, a bullish rebound from a lower support level of $.02071 could be expected. However, a descent below this level might raise questions about the sustainability of the bullish trend.
💎 In this dynamic trading environment, strategic insight and informed decision-making are crucial. Crafting a comprehensive trading strategy that encompasses effective money management and a thorough grasp of support and resistance levels is key to securing successful trading outcomes. 🌴💰

Clear exit liquidation ! #vetusdtBased on our ai analysis, it is about to visit 0.023 - 0.024 levels.
Long/short ratio also supports our idea !
Test the accuracy ! Use AI !
✴️ Vechain Bearish SignalsHere we have an inverted hammer on the 4H TF | Vechain (VETUSDT).
At the same time we can witness really high bearish volume and the pair has been growing for months.
The potential is high for retrace or a full correction.
It is still early and we will know for certain in 2-3 days or by next week.
Some pairs are peaking today while others are already looking weak.
On the other hand, some pairs are really strong but this can happen as the final jump before the market sentiment turns.
Namaste.

VETUSDT - Breakout from Ascending TriangleIn the long term it is likely going to want to be drawn towards the 0.03 round number.
In the short term, the crypto market as a whole is providing a bullish wave of support which might diminish leaving VET over-extended.
There is a confluence of many of the support and resistance levels which could create some volatility as the bull and bears argue, but a failure of which could precede a strong move.
As it is risky to fight the market general direction, a bull trade is indicated with a clear indication of where to go short if a bearish retracement occurs.

VeChain Daily Analysis After Complete Head Shoulder PatternVechain After Compelet Head And Shoulder PAttern
Base Supoet and Resistance
We hoppe Short Position if get we a good Trigger.

wetIf the first green box is broken, it will be a little difficult to reach the red lines. You can check again in the next boxes.