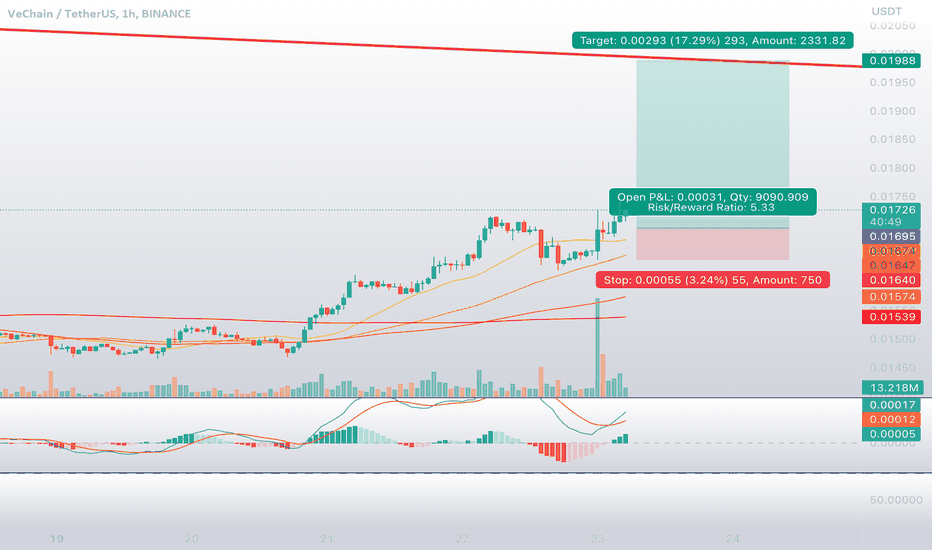
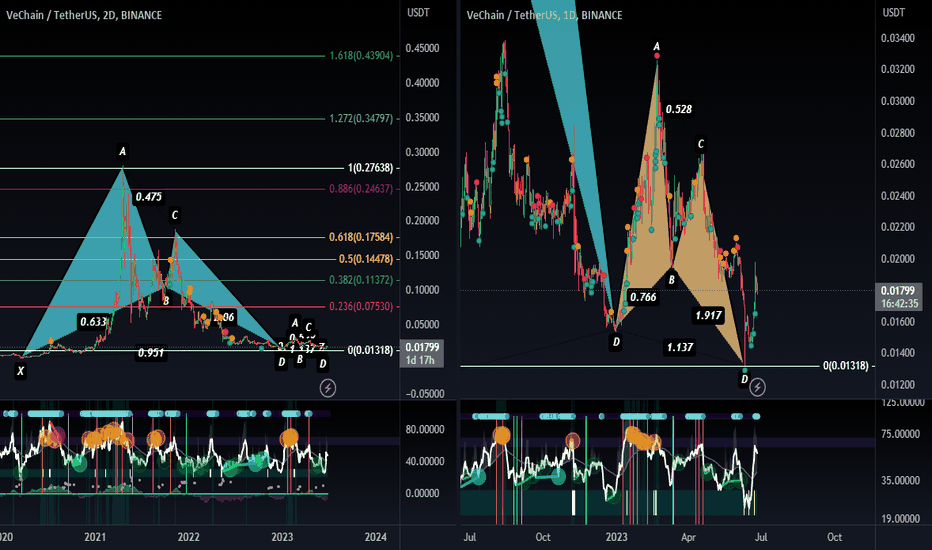
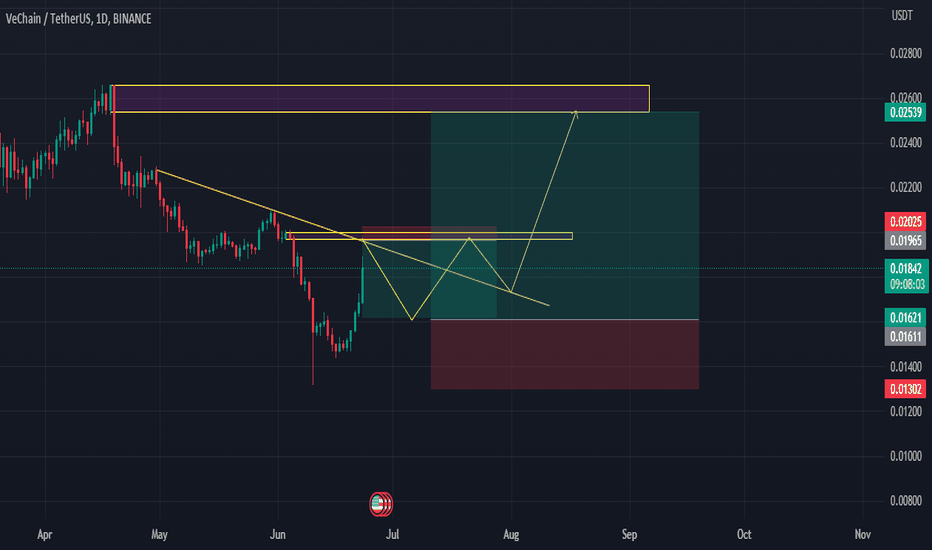
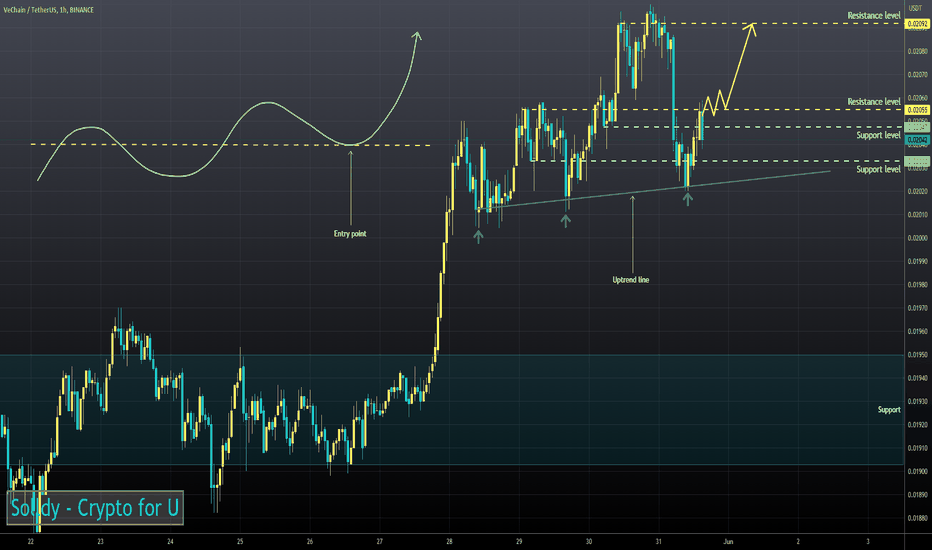
VET/USDTHi my supporters : if you saw my last chartting on VET/USDT now are in profit more than 11 % me personally closed my long just now be aware of that ......
please share my ideas through your dudes , Let them grow with us .
link of my previous prediction :https://tradingview.sweetlogin.com/chart/VETUSDT/vhZ7rRR9-Bullish-on-Vechain/
Thanks for your support
Good luck .be with us
VETUSDT.P trade ideas
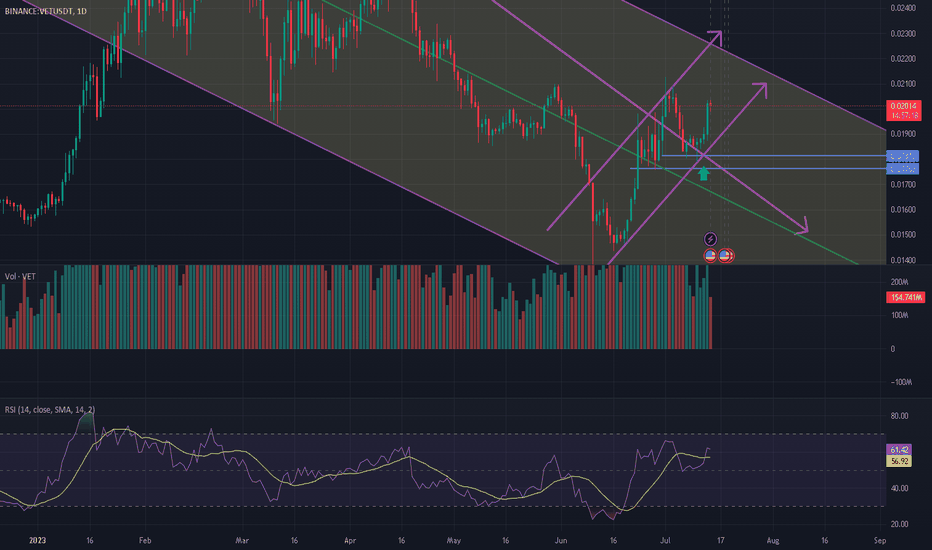
Vechain alittle bullish Hi , I am alittle bullish on VET/USDT
because you see big saturation in rsi and fake beakout on previous flush and it compensate all its falling path ....
take note it is risky trade ..... but worth it : my first target is 0.22
and last target is = top of channel 0.26
Good luck
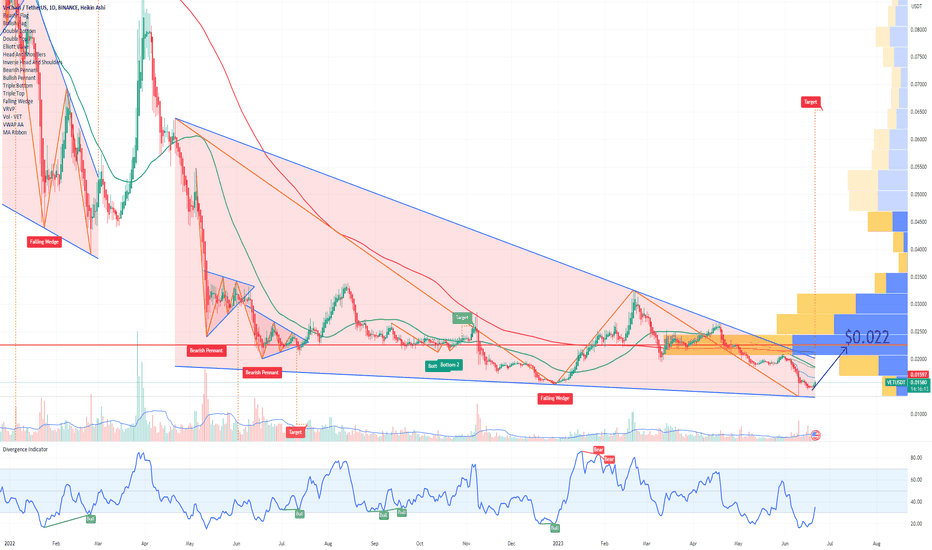
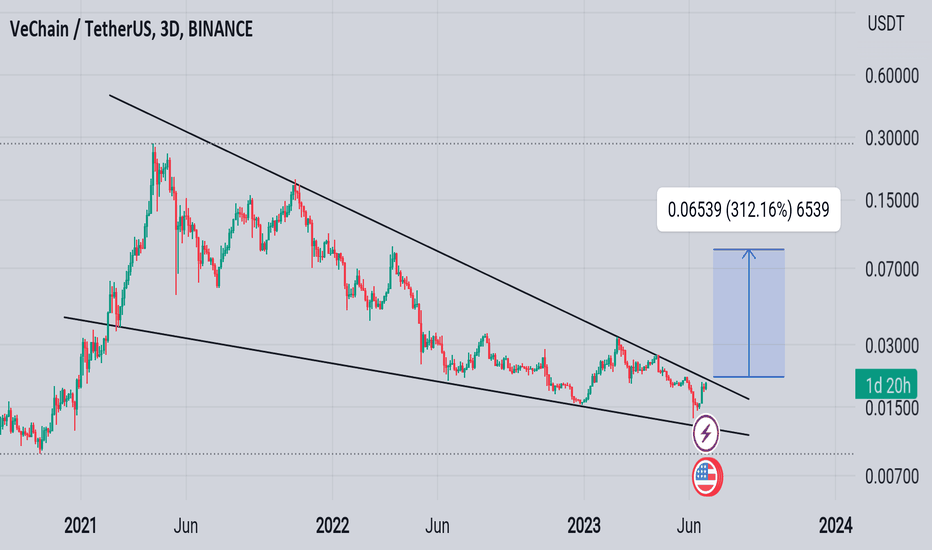
VET VeChain Falling Wedge Pattern Vechain (VET) currently finds itself at the end of a falling wedge pattern, which could potentially indicate a bullish reversal in the near future. This technical pattern suggests that selling pressure has been gradually decreasing, while buyers may start to regain control.
Considering this chart pattern, there is a possibility of a technical rebound for Vechain, with a potential target price of $0.022.
Looking forward to read your opinion about it!
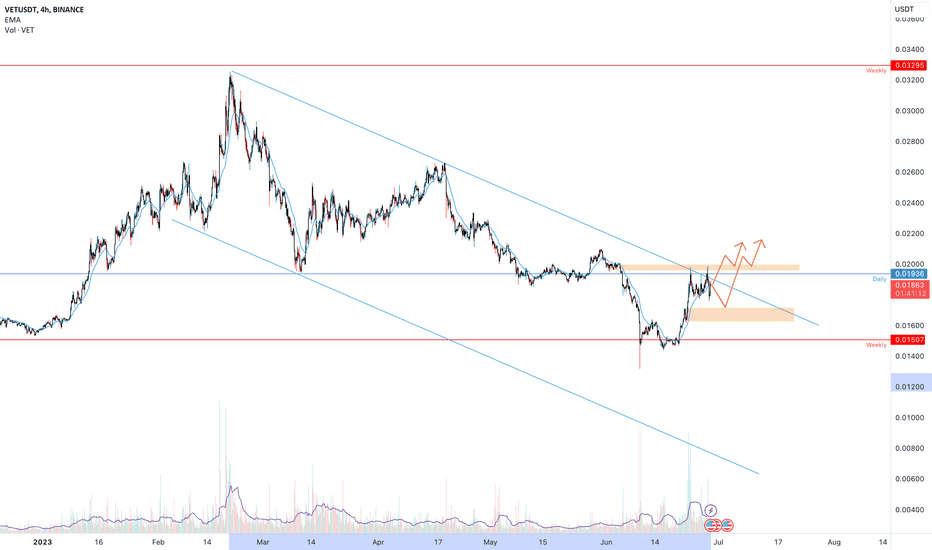
VETUSDT time to explode?VeChain is a blockchain platform designed for supply chain management and business processes.
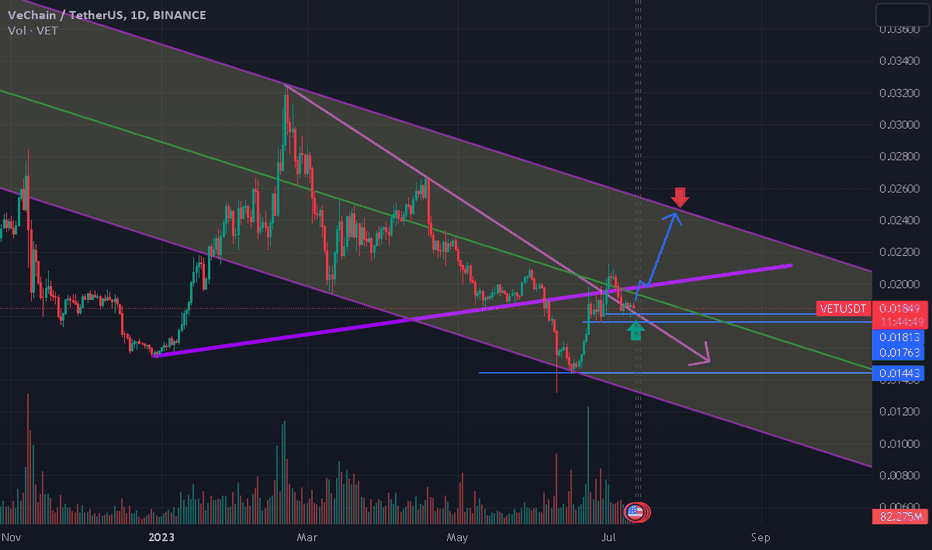
Since 20th February, the price of VETUSDT has been moving within a descending channel, indicating a downtrend. This pattern is characterized by a series of lower highs and lower lows, forming a channel sloping downwards on the price chart.
Currently, the market is reaching a critical point as it tests a key level and the dynamic support. This key level might be a significant horizontal price level that has historically acted as either support or resistance. On the other hand, dynamic support refers to a moving average or trendline that provides support to the price action as it moves downwards.
For a favorable trading opportunity, the price of VETUSDT needs to create a clear breakout. A breakout occurs when the price surpasses a key level or breaks out of a pattern, indicating a potential reversal or continuation of the trend. In this case, a clear breakout above the descending channel would suggest a possible trend reversal or a shift towards a more bullish sentiment.
Applying Plancton's rules, it seems that a new long position might be considered once the price confirms the breakout. However, it is crucial to evaluate other factors such as volume, momentum indicators, and market sentiment to strengthen the trading decision.
–––––
Follow the Shrimp 🦐
Keep in mind.
🟣 Purple structure -> Monthly structure.
🔴 Red structure -> Weekly structure.
🔵 Blue structure -> Daily structure.
🟡 Yellow structure -> 4h structure.
⚫️ Black structure -> <= 1h structure.
Follow the Shrimp 🦐
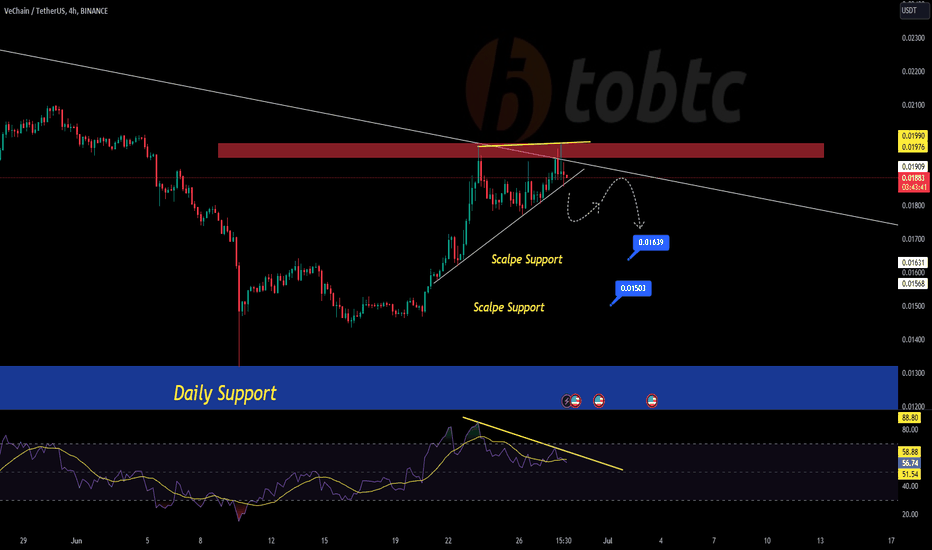
#VETUSDT #LQR #TOBTC #LaqiraProtocolDue to price divergence and third collision of long-term downtrends, if strong breakdown and corrective pullback, after confirmation you can open short positions up to specific support according to your personal strategy In certain support zones you can open long positions after confirmation. This position is not an offer to buy or sell
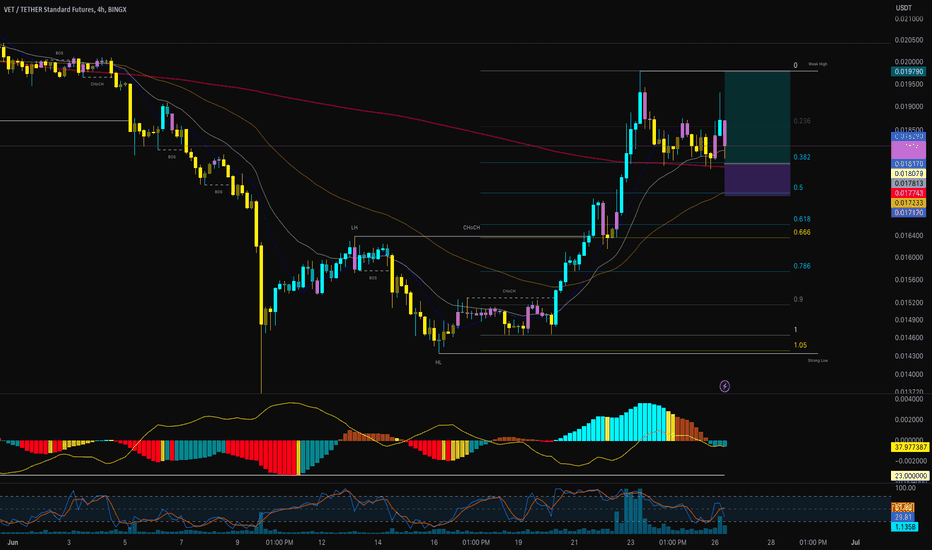
VET/USDT 4H Long
💡My Vision of a TRADE BingX IDEA💡
VET/USDT 4H LONG High Risk According to my analysis;
Entering at the 0.382 Fibonacci level, which coincides with the 200-period moving average on the 6H chart and the 20-period moving average on the daily chart. There is still some buying volume coming in (very little), perhaps enough to reach the previous high. This would give us a risk-to-reward ratio of 3.07:1, with a somewhat generous stop loss of 3.61%, allowing us to take a position with the risk of liquidation and a maximum leverage of ‼️21X AT MOST‼️, considering the size of the stop loss.
💡Mi Vision de una IDEA DE TRADE BingX💡
VET/USDT 4H LONG Alto Riesgo Según mi análisis;
Entrando por el 0.382 Fibo en esta ocasión coincide con la media de 200
en 6H coincide con la media de 20 el diario tiene aun volumen de compra entrando, ( muy poco) tal vez lo suficiente para llegar al máximo anterior, eso nos daría un RR de 3.07:1 con un Stop algo generoso de 3.61% dándonos la oportunidad de tomar una posición con riesgo de liquidación con un apalancamiento máximo de ‼️21X COMO MAXIMO‼️considerado por el tamaño del Stop
2 in 1 posiotion hello guys
look at this setup and tell me if i am wrong
good way to make some profit
The information provided on this Page does not constitute investment advice, financial advice, trading advice, or any other sort of advice and you should not treat any of the website's content as such. this page does not recommend that any cryptocurrency should be bought, sold, or held by you. Do conduct your own due diligence and consult your financial advisor before making any investment decisio
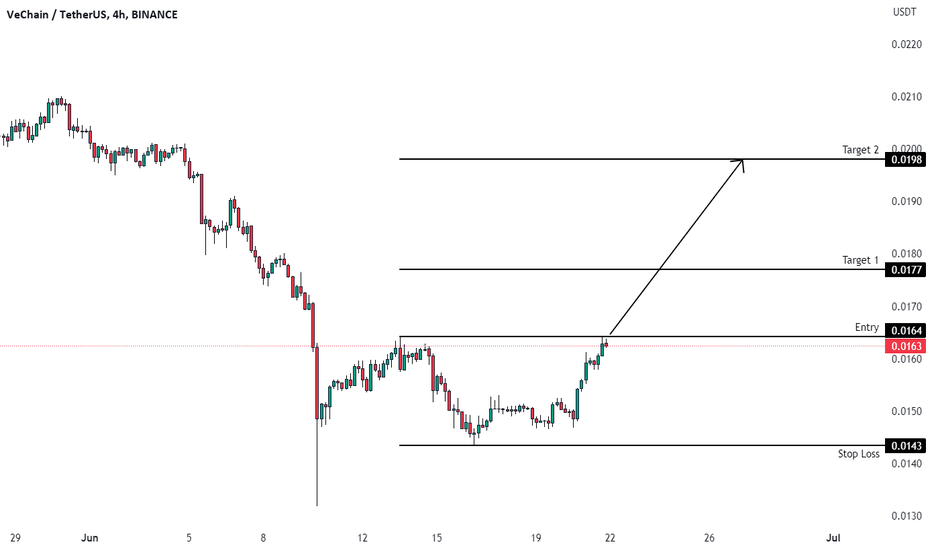
VETUSDT (4H) - Bullish reversalHi Traders
VETUSDT (4H Timeframe)
Waiting for the upward break of 0.0164 resistance level, which will complete a bullish trend reversal pattern to go LONG. Only the downward break of 0.0143 would cancel the bullish scenario.
Trade details
Entry: 0.0164
Stop loss: 0.0143
Take profit 1: 0.0177
Take profit 2: 0.0198
Score: 6
Strategy: Bullish reversal
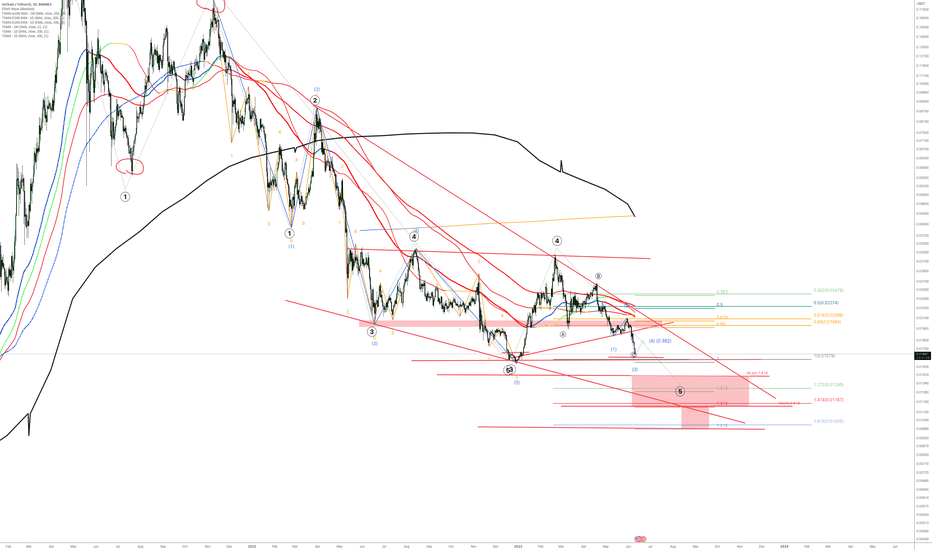
#VET (Y23.P1.Video1).Macro outlook and whyHi Traders,
Here are my thoughts on strong fib level supports combined with formations like macro descending wedge and wyckoff.
Please give me a like and share,
Regards,
S.SAri.
PS. this could also be an educational piece on how to plan and how to use fibonacci for measured moves.
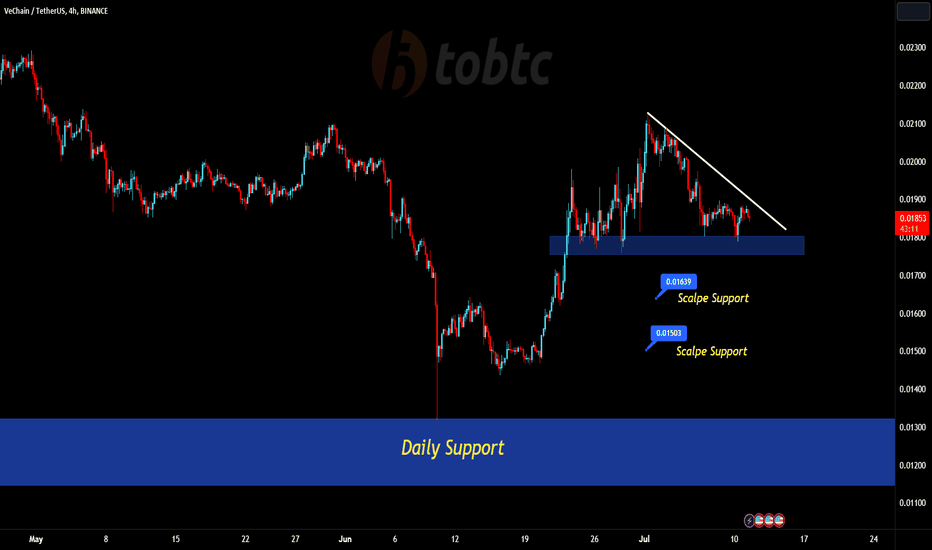
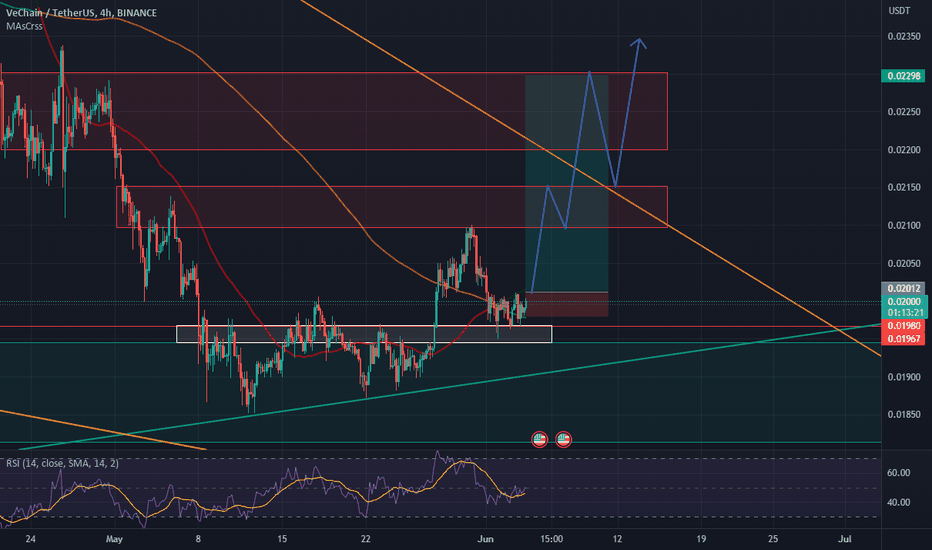
VET 4hVET has found support on the 4h chart (white zone). If it breaks out above the local candles on the 4h timeframe, I will enter. This small consolidation phase may also continue for some time, but support is clear.
I am patiently waiting for the right moment to make a move in line with the market .
Possible targets are seen (red zones) on the chart.
+ Small SL
+ Clear support
+ Bullish RSI 4h
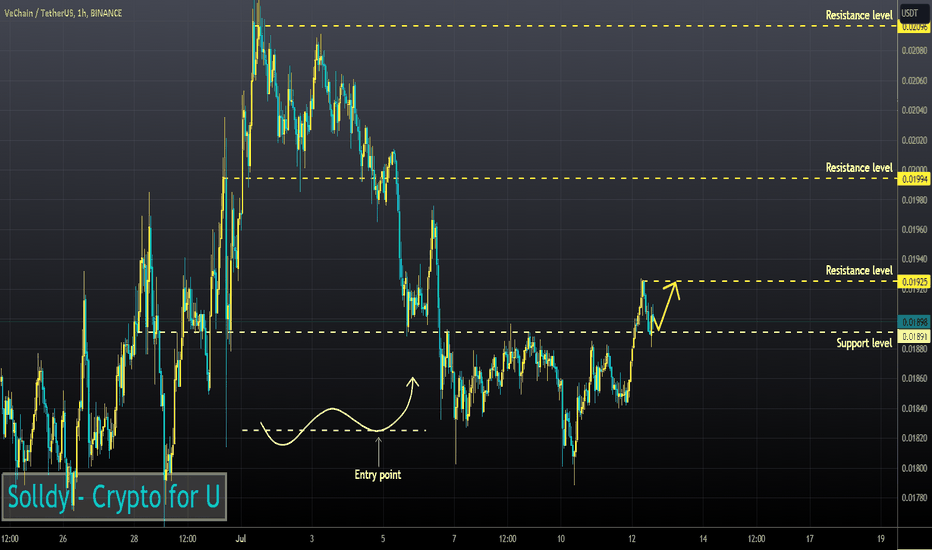
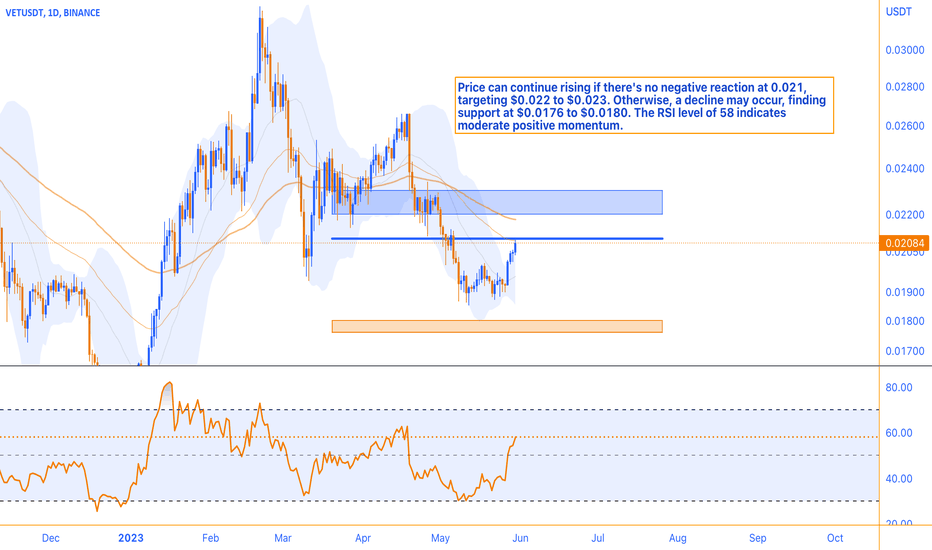
Potential Upside MomentumIn the absence of a detrimental reaction to the level of 0.021, the price surge has the potential to extend its upward trajectory, targeting the range of $0.022 to $0.023. Conversely, should an adverse response materialize, the price downturn could endure, finding support within the encompassing range of $0.0176 to $0.0180.
It is worth mentioning that the current Relative Strength Index (RSI) level stands at 58, indicating a moderately positive market momentum. This suggests that the asset in question is currently in a state of equilibrium, neither overbought nor oversold, thus presenting potential opportunities for further movement.
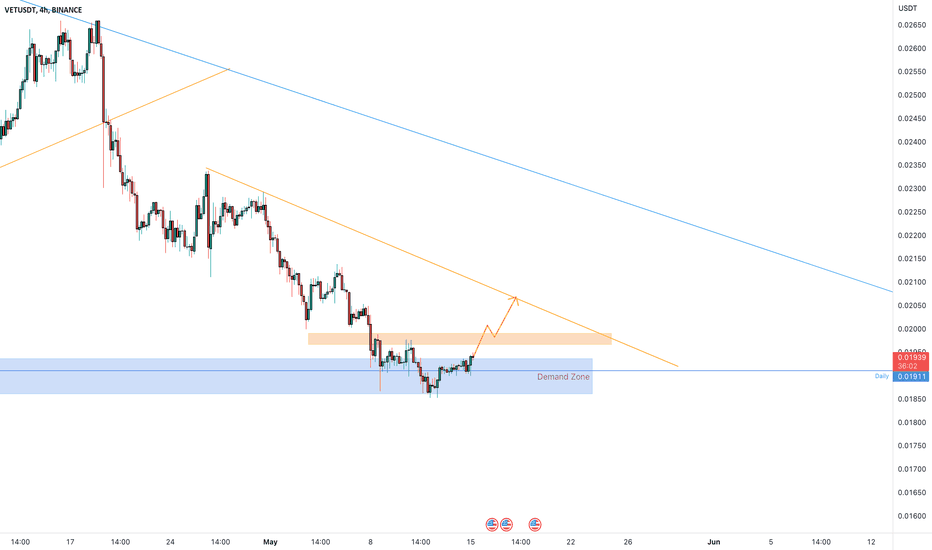
VETUSDT wants the pullback?VETUSDT is currently undergoing an interesting phase as the price tests the demand zone around the $0.019 area. This level represents a critical region of support where buyers have historically shown strong interest in purchasing VET at this price range.
The testing of the demand zone suggests that there is a significant amount of buying pressure at this level, as investors see the current price as an attractive opportunity to accumulate VET. This zone acts as a point of equilibrium between supply and demand, where sellers are less willing to sell their holdings, leading to a potential scarcity of VET available for purchase.
If the price manages to hold within the demand zone and starts to show signs of upward momentum, there is a possibility that new liquidity could be attracted to the market. Traders and investors who have been waiting on the sidelines may see the price stability and potential for an uptrend as a signal to enter the market, thereby adding new buying pressure.
According to Plancton's rules, which may refer to a specific trading strategy or approach, a breakout above the current price level could present a new long opportunity. A breakout occurs when the price moves decisively above a significant resistance level, indicating a shift in market sentiment and potentially leading to a sustained upward trend.
Traders following Plancton's rules might view the price testing the demand zone as a confirmation of its strength and expect a potential breakout to the upside. They may consider opening long positions, anticipating a continuation of the upward move, and aiming to capture profits as the price potentially climbs higher.
–––––
Follow the Shrimp 🦐
Keep in mind.
🟣 Purple structure -> Monthly structure.
🔴 Red structure -> Weekly structure.
🔵 Blue structure -> Daily structure.
🟡 Yellow structure -> 4h structure.
⚫️ Black structure -> <= 1h structure.
Follow the Shrimp 🦐
