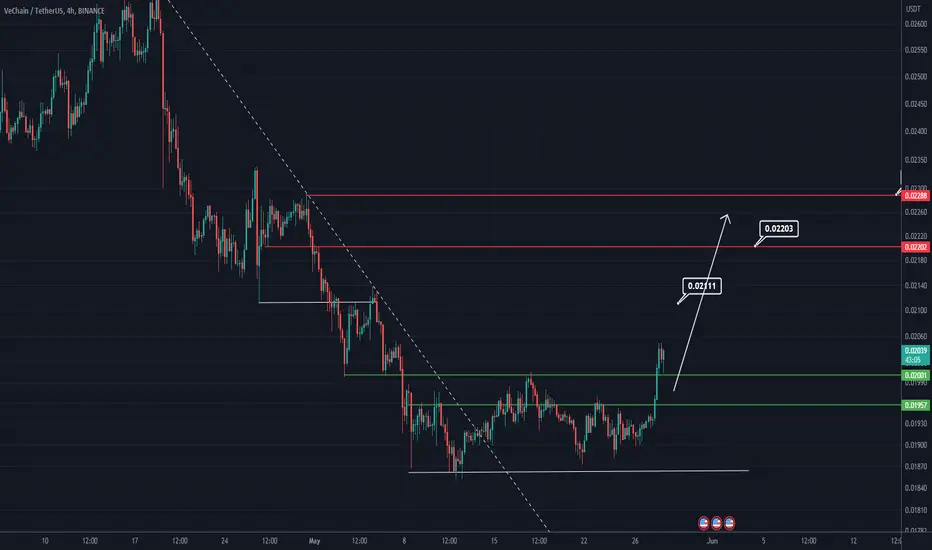
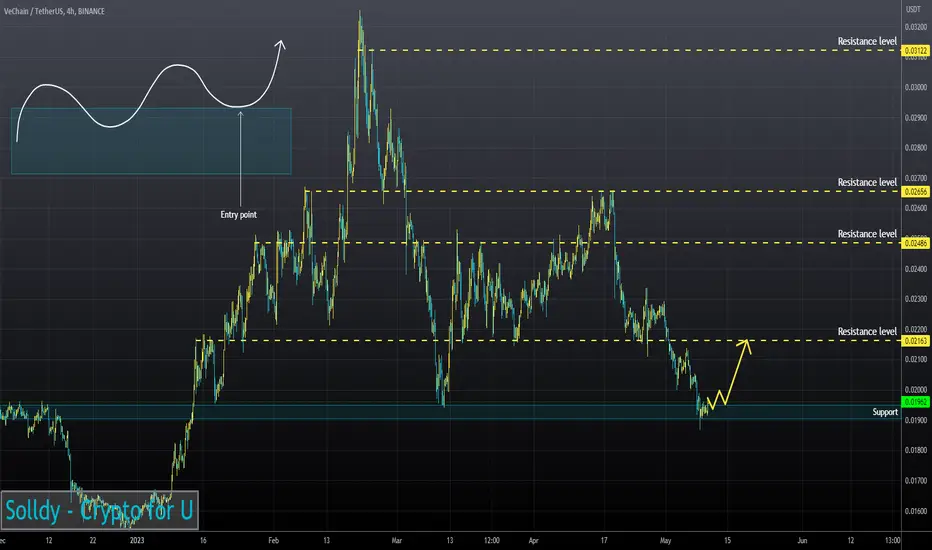
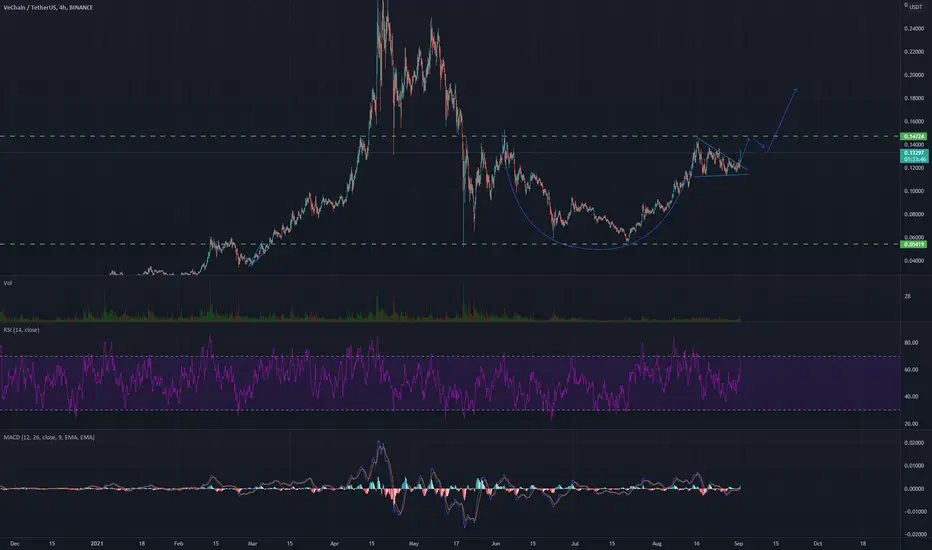
VET LOOKS BULLISH (4H)Hi, dear traders. how are you ? Today we have a viewpoint to BUY/LONG the VET symbol.
For risk management, please don't forget stop loss and capital management
When we reach the first target, save some profit and then change the stop to entry
Comment if you have any questions
Thank You
VETUSDT.P trade ideas
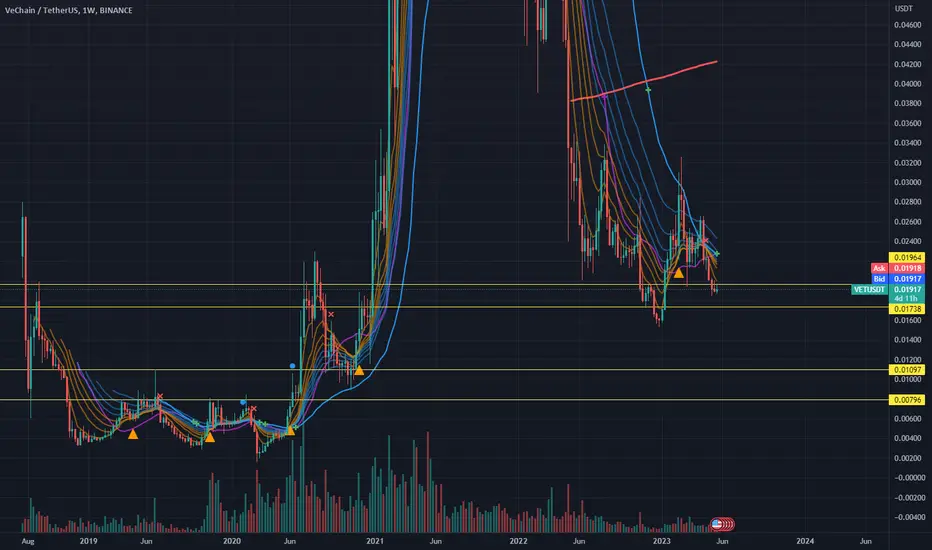
VET down next on weekly/daily.The chart has shown a clear rejection of the 0.01964's resistance and the only way looking left is falling to the next support, first 0.01738 and then between 0.008-0.011
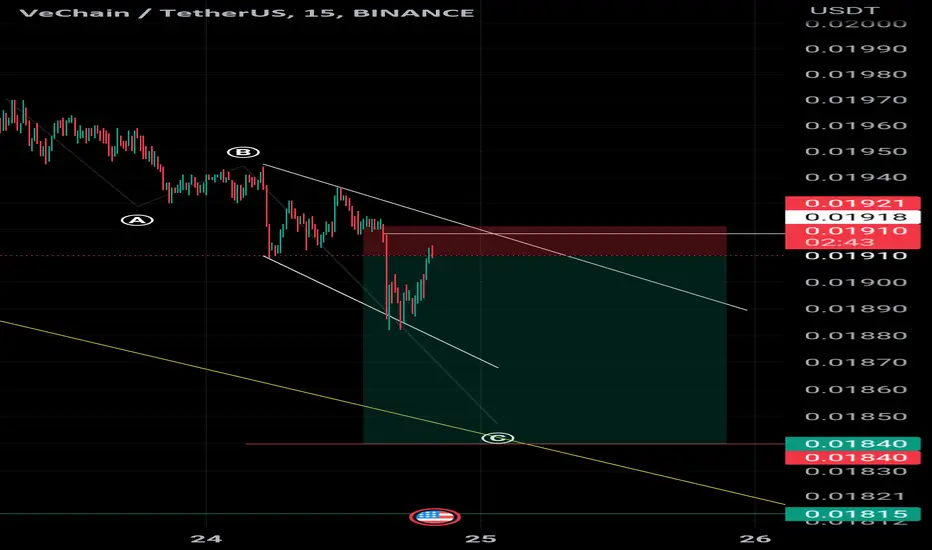
VETUSDT.P ON binance short to fill wave 5Short opportunity just printed out on VETUSDTP to accomplish wave 5 of a LD
U can leverage the position up to 10 X
Happy trading !!
VeChain (VET) Technical Analysis: A/D IndicatorIntroduction:
Greetings to all cryptocurrency enthusiasts and investors. Today, we bring our attention to VeChain (VET). As we delve into the latest technical indicators, our focus is on the Accumulation/Distribution (A/D) indicator. However, we are also keeping an eye on the TRIX indicator, which from our previous analysis, we are waiting to cross the zero line to potentially confirm a price pattern.
Accumulation/Distribution (A/D) Indicator:
The A/D indicator is a volume-based tool used by traders to identify divergences between the asset's price and volume flow. This helps to determine potential buying or selling pressure.
VeChain Analysis:
Our attention is drawn to VeChain’s A/D indicator which suggests an ongoing accumulation phase and a bullish divergence. This is a potentially positive sign, as accumulation often precedes upward price momentum. Despite VeChain's current sideways or choppy price trend, the A/D indicator shows us that a substantial number of coins are being accumulated in this range.
When we view this accumulation phase in the context of the prevailing choppy trend, it aligns perfectly with the A/D indicator’s signals. In such scenarios, the A/D line tends to increase when the security is being accumulated, even if the price movement remains relatively flat.
Conclusion:
In summary, the A/D indicator for VeChain suggests a period of accumulation which could signal an upcoming bullish phase. As we continue to monitor the TRIX indicator for a potential zero line crossing, this could provide further confirmation for our analysis.
However, it's crucial to remember that indicators should not be used in isolation, but in conjunction with other technical analysis tools and fundamental analysis. Always ensure your trading decisions align with your overall investment strategy.
Please note that this analysis does not constitute financial advice. Always conduct your own research before making any investment decisions.
If you found this analysis insightful, please like, share, and follow for more updates. Stay tuned for more technical analysis of various cryptocurrencies.
Best regards,
Karim Subhieh

VET/USDT undergoing the re-test Hey guys 👋
VET/USDT pair is next one on our watchlist which is looking for another drop it seems. After a nice breakdown we are going for a re-test which seems to be going out of juice (Support of buyers is getting weaker). We are waiting for additional confirmation here after what we want to see a nice downfall of at least 15%
If you like ideas provided by our team you can show us your support by liking and commenting.
Yours Sincerely,
Swallow Team
Disclamer:
We are not financial advisors. The content that we share on this website are for educational purposes and are our own personal opinions.

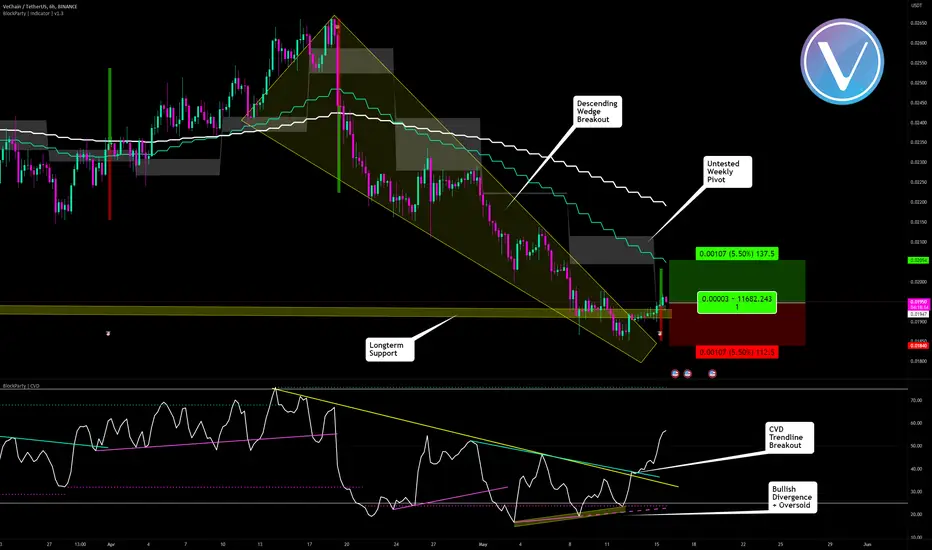
VET | VeChain breaking out of a descending wedgeVET | VeChain breaking out of a descending wedge
VET is showing all the signs of a strong bullish move up with a breakout of a descending wedge, along with a divergence whilst being oversold
| Descending Wedge Breakout
| Untested Weekly Pivot
| CVD Trendline Breakout
| Longterm Support
| Bullish Divergence + Oversold
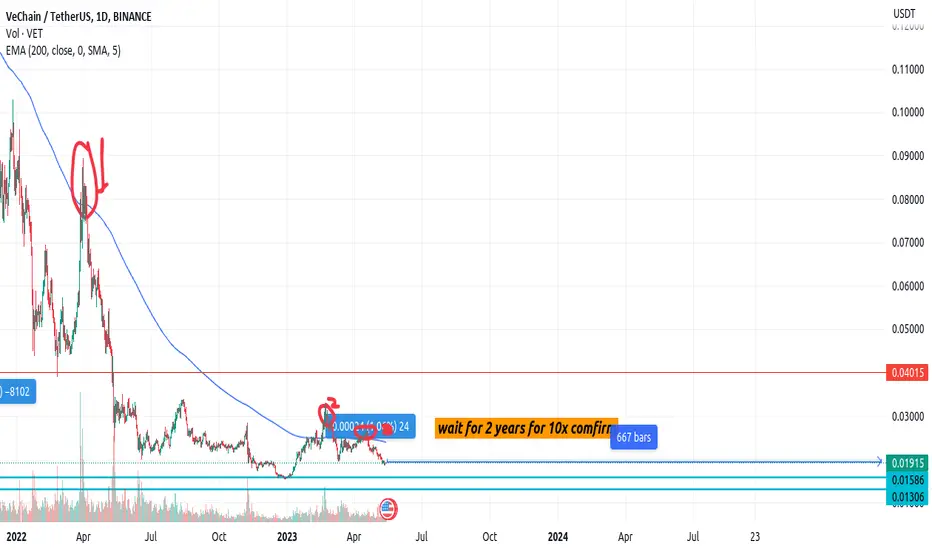
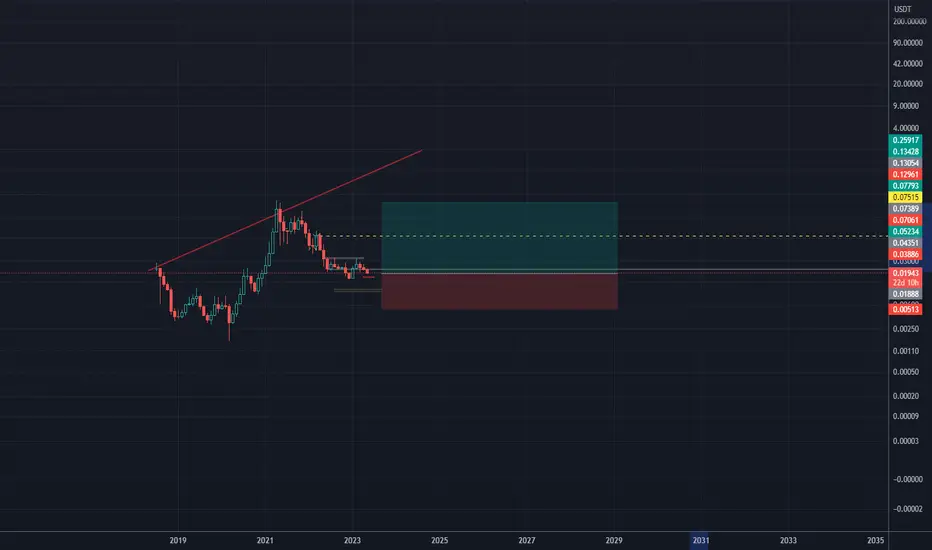
wait for 2 years for 10x profit buy in deep vet never come on this price in future i m going to buy more
your money your choices this is idea
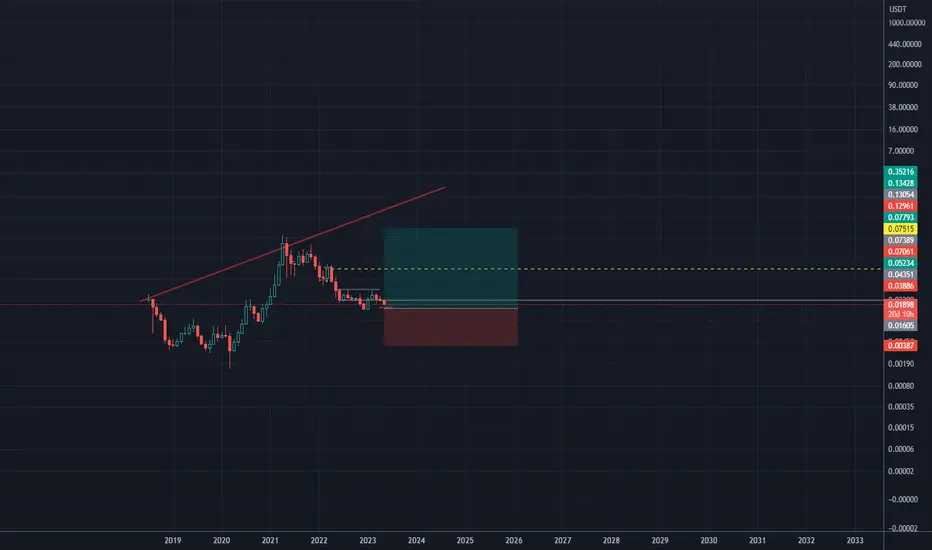
VET monthly chartStop looking shitty 1 day and 4 hs chart, look at the monthly open your eyes and see two from now on 0.30 area target, good luck and trades!

VETUSD ❕ support areaThe RSI chart, price movement and trading volume dynamics formed a bullish divergence on the 4H Timeframe.
VET broke up 50EMA on 1H Timeframe.
The RSI chart returned to the buyers' zone at 1H and 30H TFs.
The price will bounce off the support again.
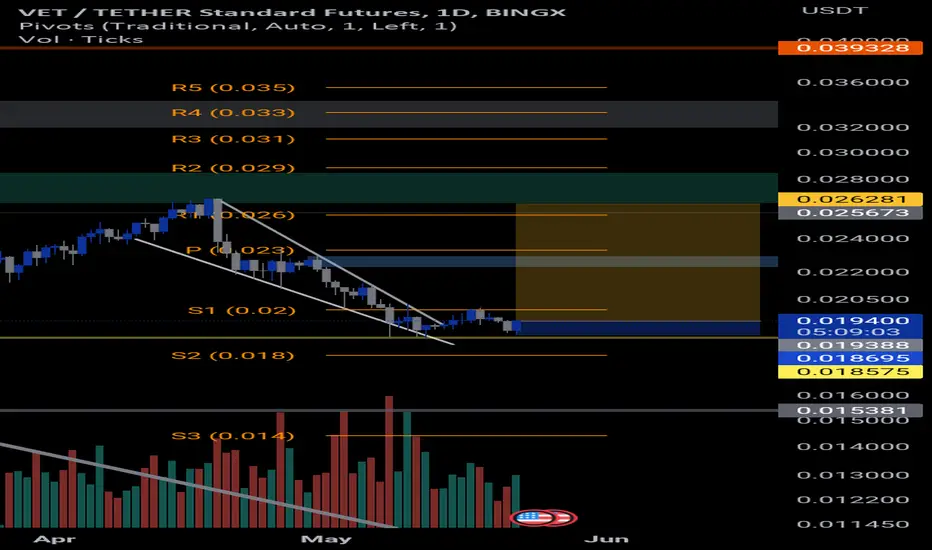
VeChain (VET) Cryptocurrency Short | Swing Trade | 20% DownsideThe Price has closed below the daily support on 8 May and has also retested the broken. support as new resistance.
A Short can be initiated at Current market price.
This is a SWING TRADE
Entry- 0.0194
Stop Loss- 0.0204
Although if daily candle closes back above the broken support, then exit the trade and no need to wait for stop loss to hit
Target- Final target is 0.0156 but keep booking profits in between and trail you stop losses
Let me know in the comments section if you want me to analyse any other financial instrument.
WARNING:-
ALWAYS FOLLOW RISK MANAGEMENT AND POSITION SIZING WHILE TAKING ANY TRADE.

Vetusdt 1HOUR TIMEFRAME 1 hour time frame projecting a sell setup...let's see how it goes with the news we would having today.

Potential sell points for vetusdtVetusdt is currently in selling spree looking to follow the trend 😌😌😌😌😌

VET Monthly chart Looking forward the bull run i think VET can get his ATH again. Time to buy and forget.
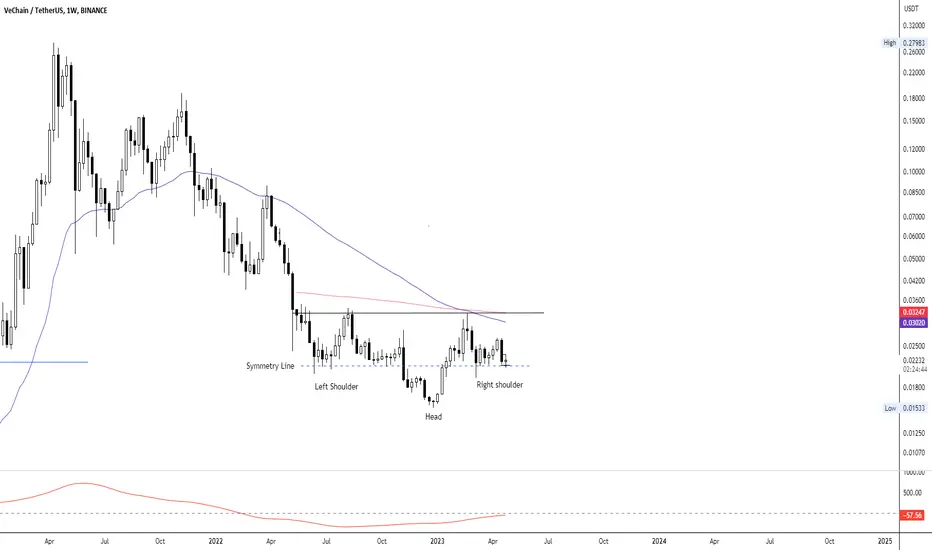
VET - Inverted head and shouldersHello, thank you for taking the time to read through my post. I would like to discuss here some technical ideas related to VeChain.
As you already know, VeChain is gradually forming a bottom. This floor is in the form of a Classic Price Pattern called "Inverted Head and Shoulders". This pattern is often found at important reversal points and is therefore a sign of a trend reversal. The upper black line is the resistance, but also the so-called "Neckline". To confirm an Inv H&S we would need a clearly defined breakout above this line. We cannot say when this time will be, but we can use technical indicators to uncover the story. I would like to discuss with you the TRIX indicator.
Short intro to TRIX:
The TRIX is a Triple Smoothed Average line, also known as the Triple Smoothing Exponential Moving Average or EMA. It can be used both as an oscillator fluctuating around its zero line, called Triple Exponential Smoothing Oscillator, and as a momentum indicator. In accordance with the nature of moving averages, the TRIX is a smoothed indicator that filters out false signals. The TRIX indicator achieves the best results in clearly trending markets.
So by definiton this indicator is a help to filter false signals. As you can see here, the TRIX is now very close to the 0 line and tries to break it from the bottom to the top, which could be a very good signal for an uptrend.
So my idea: If the TRIX pushes above the 0 line, that will drive the price to resistance line and when that happens, our classic price pattern will be confirmed.
So keep your eyes open and your ears stiff,
until next time my friends,
Kami
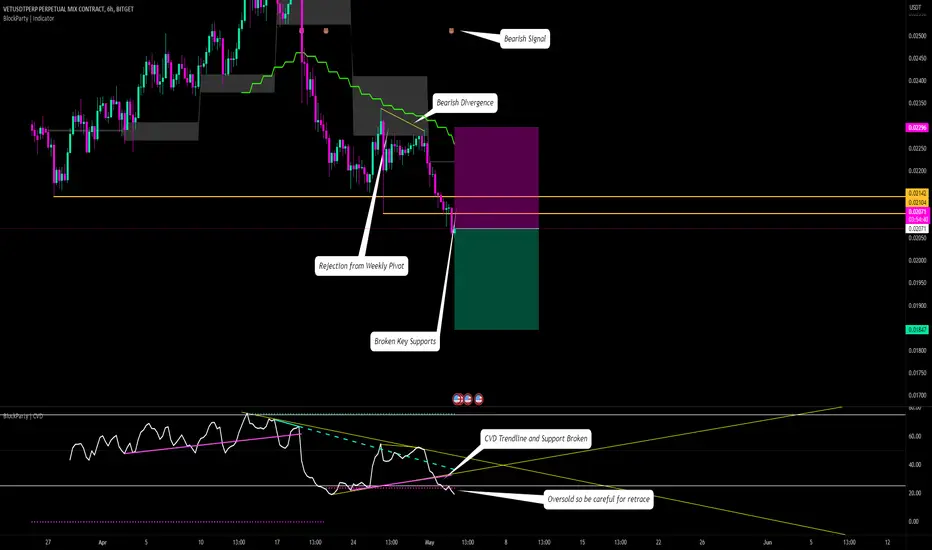
#VETUSDT | Short | Trade Set-Up#VETUSDT | Short | Trade Set-Up
Entry Conditions
| Bearish Signal
| Rejection from Weekly Pivot
| Broken Key Supports
| Bearish Divergence
| CVD Trendline and Support Broken
| Oversold so be careful for retrace
VeChainUsdt LongThis pair broke through the trendline and came back to touch it from above, I expect this pair to start reversing soon.

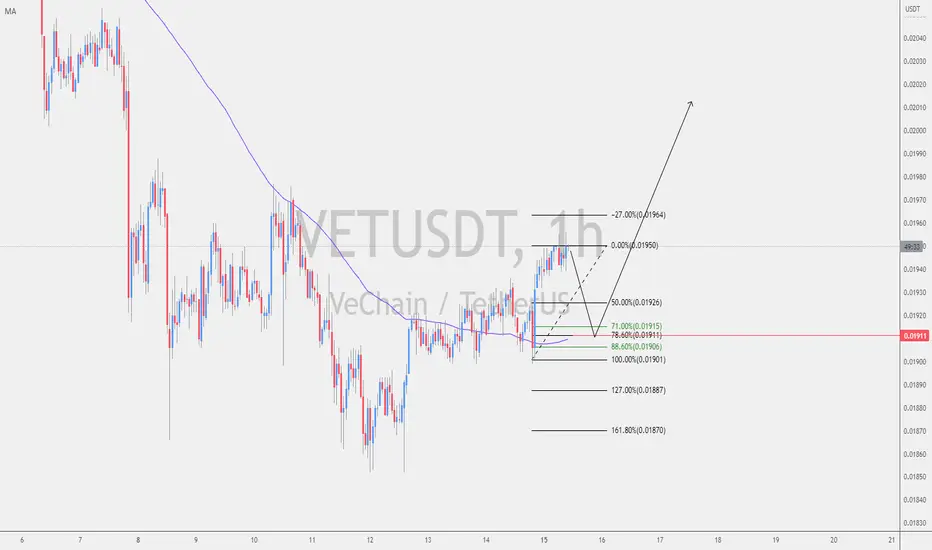
VET/USDTexpecting a breakout within 3 weeks, you can see the measured target and stop loss level, GL

VET Cup and Handle formationVET is on a nice cup and handle pattern. Needs to break out from the neckline.
Sell in May and Walk awayStarting to build a long term short position. Think we are approaching highs for the year on crypto at this point

Vetusdt Trading opportunityIn this market update, we will discuss the recent price action of VETUSDT, which has potentially completed the Right Shoulder of an Inverse Head and Shoulders (ISHS) pattern which could signal a bullish reversal if the neckline is broken.
Talking about Inverse Head and Shoulders Pattern, the pattern consists of three troughs, with the middle trough (the Head) being the lowest and the two outer troughs (the Shoulders) being shallower. A break above the neckline, which connects the highs of the two shoulders, would confirm the pattern.
The accumulation zone in the demand area presents a potential buying opportunity for investors looking to benefit from the potential uptrend.
Keep an eye on the neckline breakout and the target price of 0.06833 to gauge the future price action of VETUSDT.
This market update is for informational purposes only and should not be construed as financial advice. Cryptocurrency investments are highly volatile and carry significant risks. Do trade wisely.
