VET UPDATE (BULLISH)This symbol is one of the symbols that can continue to move upwards. I have included the targets
VETUSDT.P trade ideas
$VET This Looks Very Bullish to Me ! @vechain$VET It's time to Pump !
Huge Pump Coming in my Opinion !
VET short termHello Birdies,
We have successfully plotted another coin on new strategy we are using. Let's get to the point.
As usual Green to buy and Red to Short as per price action.
Line-A is highly unlikely to be breached as there is still alot of liquidity at LINE-B.
If an only if line-B is breached we can see 70%-80% otherwise settle down at 30%.

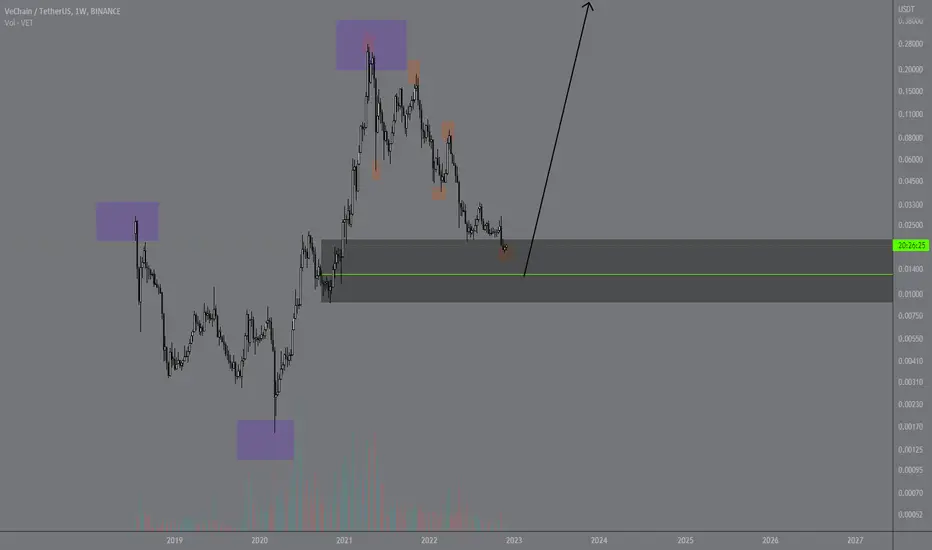
Vechain Buys soon (next 2 months)We can see overall we are bullish long term. Looking to buy vechain in the next month / 2 months. Mark my words. Structure is king.
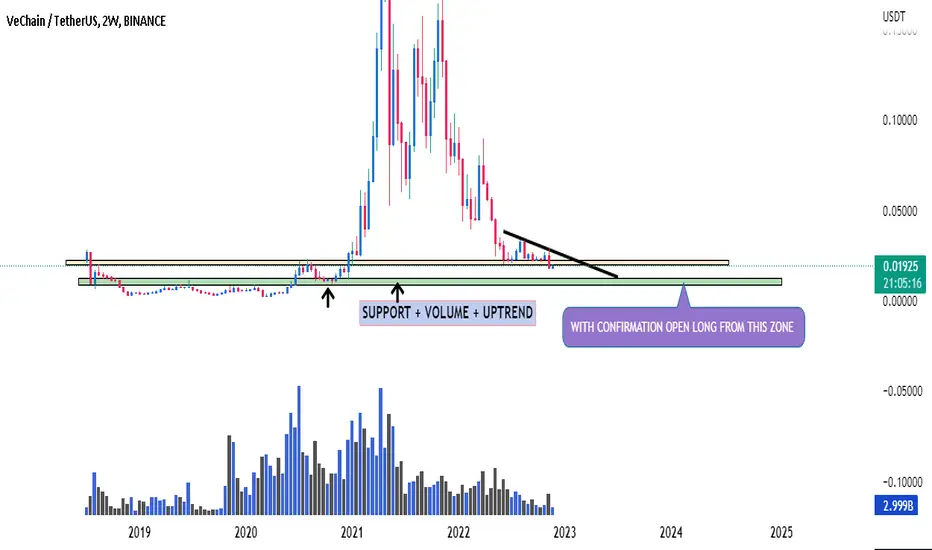
VET IDEA HELLO GUYS THIS MY IDEA 💡ABOUT VETUSDT is nice to see strong volume area....
Where is lot of contract accumulated..
I thing that the buyers from this area will be defend this LONG position..
and when the price come back to this area, strong buyers will be push up the market again..
UP TREND + Resistance from the past + Strong volume area is my mainly reason for this long trade..
IF you like my work please like and follow thanks
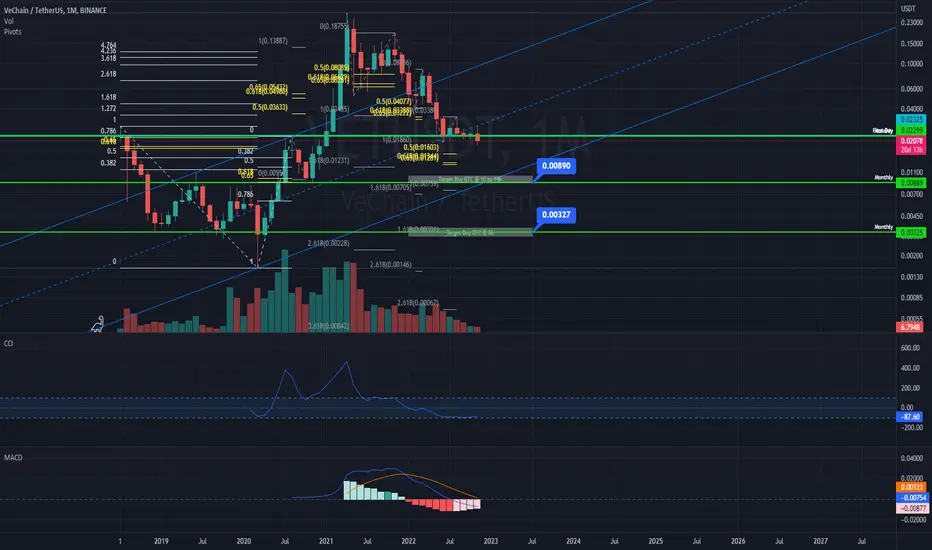
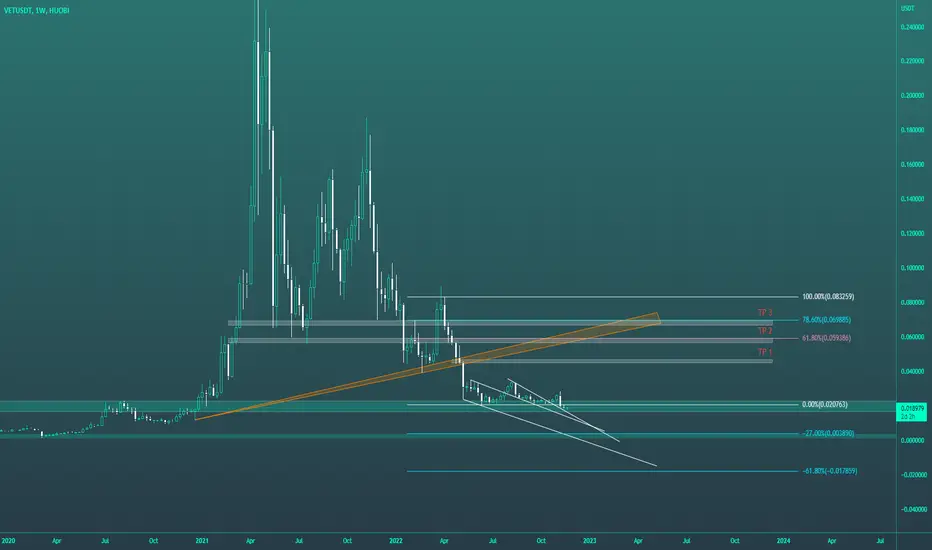
VeChain by Request (Easy Target 27% & More | 80%+)Here we have VeChain (VETUSDT) but this time a closer look compared to the previous analysis.
We have early signals of recovery as most of the cryptocurrency market is showing.
We have the 3 drops pattern or Inverse Head & Shoulders as well as a lower volume lower low, which all indicates the bears losing strength.
As the bears lose strength the bulls can enter the game.
The easy target is set around 25-28% in a range between the 0.618 Fib. and MA200.
Between 0.02400 - 0.02500.
Higher targets are possible depending how this upcoming bullish move develops.
I see 80%+ around 0.3531 reachable as well.
I hope that helps and thank you for your support, it is appreciated.
Namaste.

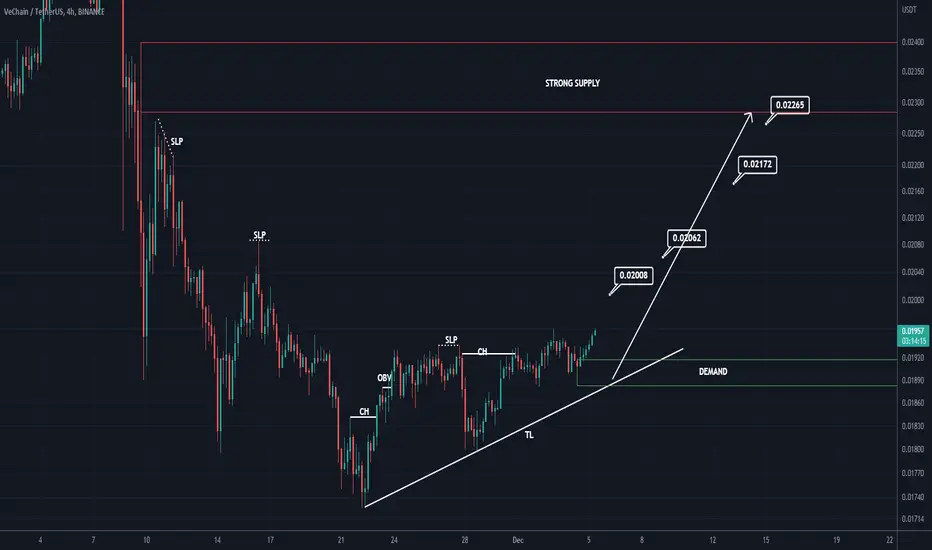
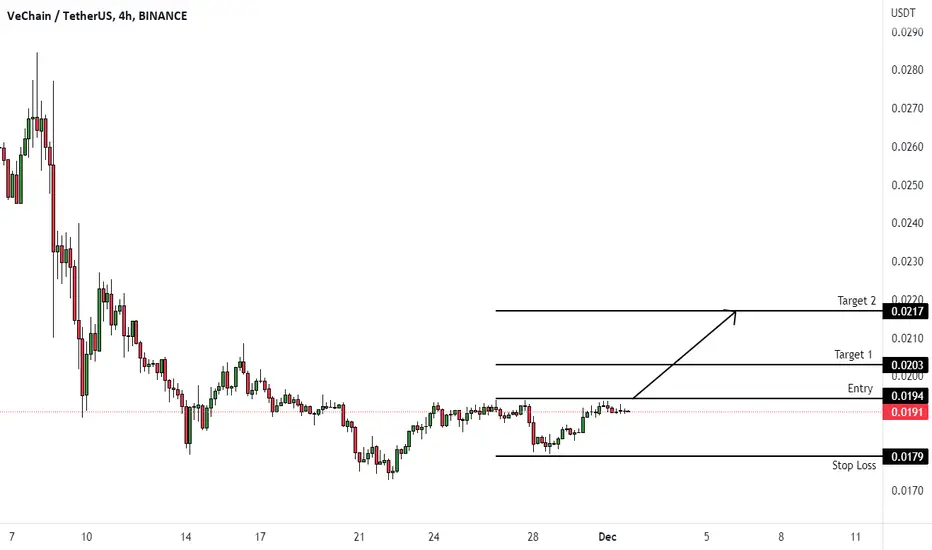
VETUSDT (4H) - Bullish reversalHi Traders
VETUSDT (4H Timeframe)
Waiting for the upward break of 0.0194 resistance level, which will complete a bullish trend reversal pattern to go LONG. Only the downward break of 0.0179 would cancel the bullish scenario.
Trade details
Entry: 0.0194
Stop loss: 0.0179
Take profit 1: 0.0203
Take profit 2: 0.0217
Score: 4
Strategy: Bullish reversal
VetUsdt on good supportVeChain on hard and old support
we know VET is good blockchain and for HODL is good
but remember you should research
GL
EntryPoint:
0.01783
Supports:
0.01570
0.01469
0.01336
0.01117
Resistance:
0.01970
0.02100
Targets:
0.02369
0.02612
0.02880
0.03310
0.03951
MidTime:
0.04950
0.05568
0.06591
HODL
0.09042
0.11327
0.15082
You can more targets for HODL
GL

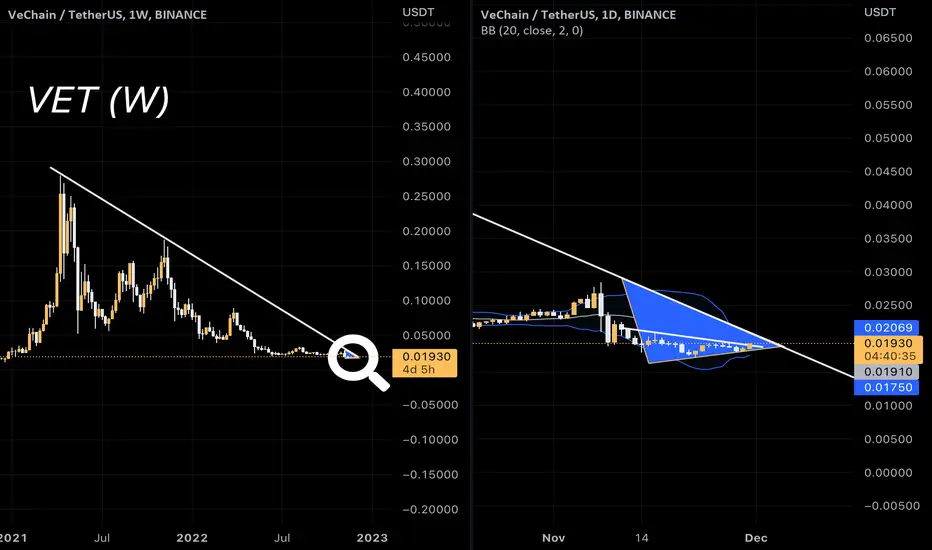
Are you ready VET? The market is probably ready for a pull back - but at the same time VET is (soon?) ready to break the long weekly downtrend. I think the risk reward "Long VET" right now is fantastic. See where the pull back take VET, set a stop loss and then ride. Hopefully you can use the trend line in the triangle as a support. Weekly close for VET could be a nice starting point for a long ride.
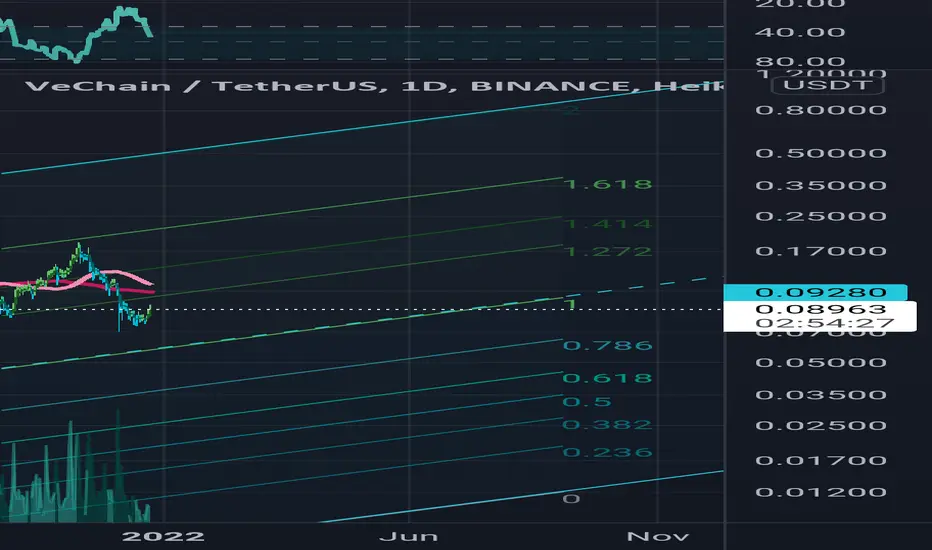
VET USD Log Ascending ChannelVeChain versus US Dollar, Ascending Log Channel analysis, fib channels for resistance and support watchdogs.
Not predicting, but preparing: VET/USDTNS 1.35.5.10
Shall I make this post public?
I ponder... well, dear {reader/trader/man/woman}, you will find out when you read these words, and the only one that ever may read them is me; if indeed, I do not publish them. So ponder that, and the dimensional illusions of the simulacram with which we control and surround ourselves. Indeed, ponder this for it is how we become the masters of domain and jurisdiction... in other words, if you are reading these words: Welcome fellow Wizard!
Here we have VET. The other day this chart for some reason came up as I was playing with Renko Bars, and put in a foolish(ly) leveraged trade which accordingly went bad, but fortunately with grit and patience, and through all the current, torrid, sky-is-falling bullshit, I saved it... a minimal loss. Of course, if my full wizard faculties would have been honed, I could've profited as I am writing these beautiful words of fate. As all better traders know, woulda-coulda-shmouda... be here now, project the future based on a past, which can be counted on to be dependable, occasionally.
Upon looking at the chart, I finally traveled timelines and expanded my cosmic view to larger horizons within the cube of 9.
I shall prepare my coordinates accordingly, and will be ready for blast-off. We shall see what occurs. Powerful wizards, the good ones, are ALWAYS prepared!
At this moment, as I gaze upon a sunny meadow, on a late autumn evening, in a quiet town of living men and women of the soil... I ponder... and I ponder... and I have pondered enough; so, since you are not only me reading these words anymore...
I shall bid adieu, and look forward to meeting you again. I bless you with peace, love, and abundance.

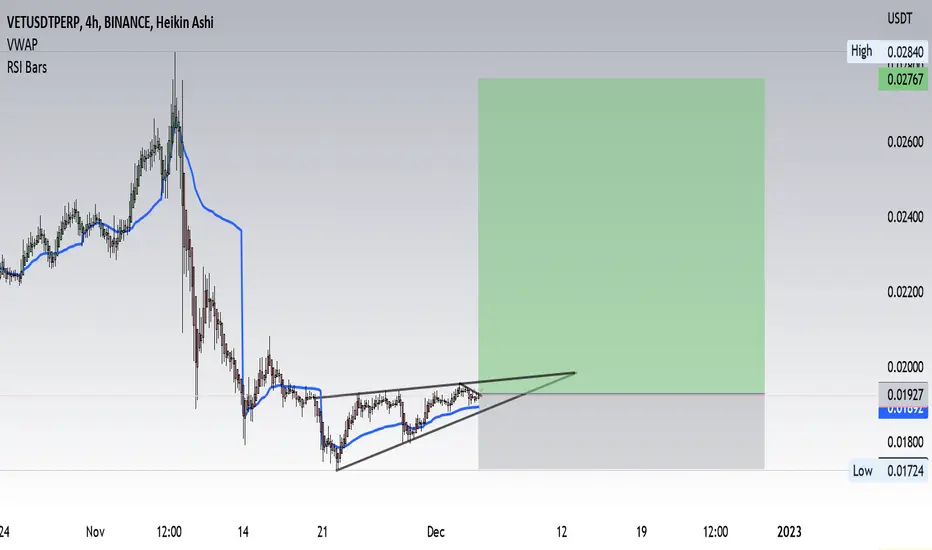
#VETUSDT 4H Chart
Price has left an area of equal highs where it got rejected from. MACD is showing bullish weakness, RSI is slightly bought and EMAs are neutral. I expect price to tap into our discounted 4h area of demand before potentially moving up again.

VET Short-Term Resistance & Support's>>Hello everyOne
I Have Tried My Best to Bring the best Possible outcome in this Chart.
>>>>>We We have wait to..
For a powerful bullish candlestick,
When price breakout happen,
We can setup a buy position in possible corrections.
In case of weak support this scenario could be failed.
(reviewed by TrendAnalyze/classic technical pattern's/PriceAction.)
It's just a scenario not a financial advise.
PLZ DYOR
With hopping success>>>>>>>>>>>

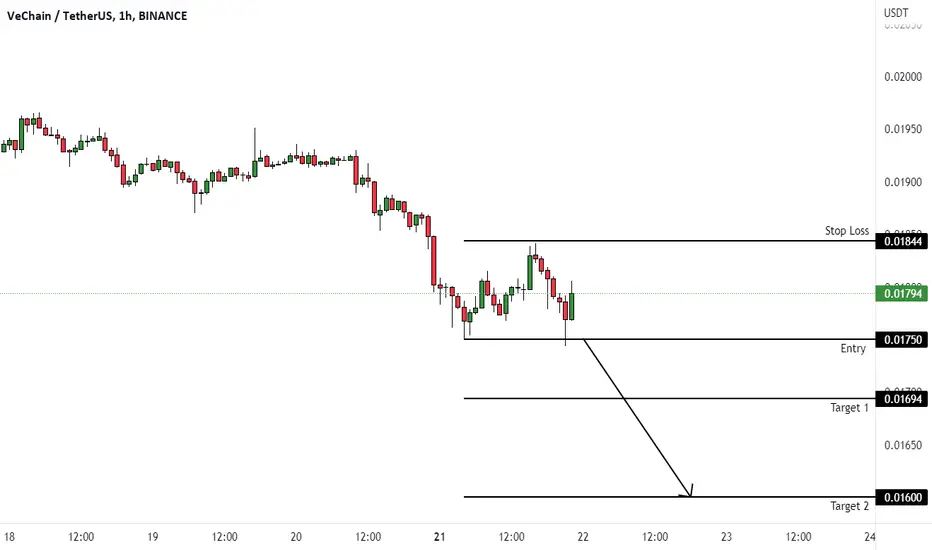
VETUSDT (1H) - Bearish breakoutHi Traders
VETUSDT (1H Timeframe)
The market is in a downtrend, and we are waiting for an entry signal to go SHORT below the 0.01750 support level. Only the upward break of 0.01844 would cancel the bearish scenario.
Trade details
Entry: 0.01750
Stop loss: 0.01844
Take profit 1: 0.01694
Take profit 2: 0.01600
Score: 8
Strategy: Bearish breakout
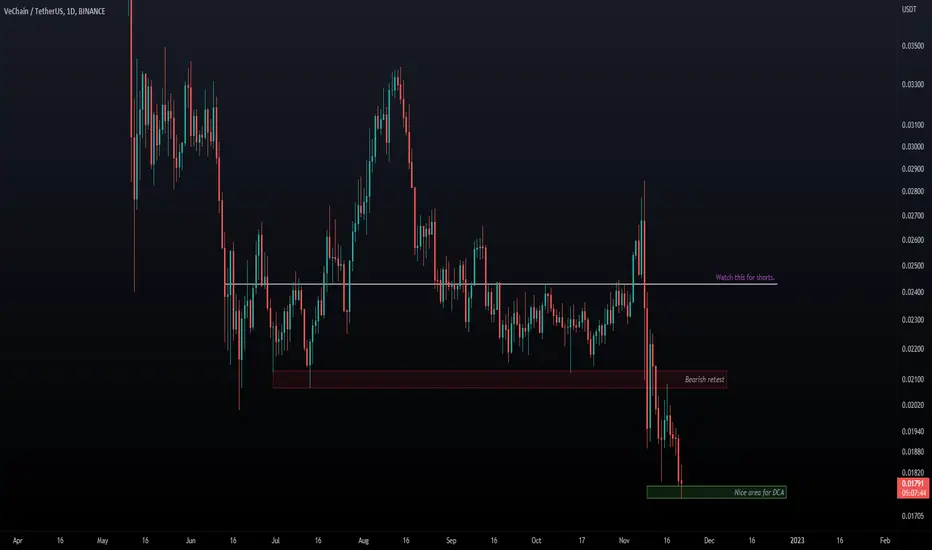
Request VETBroke and retested the previous crucial support.
Highly unlikely to return back above.
But, if that happens, look at the white for shorts.
The green is a nice area for DCA if you know how to do it effectively.
* My macro view is coming!
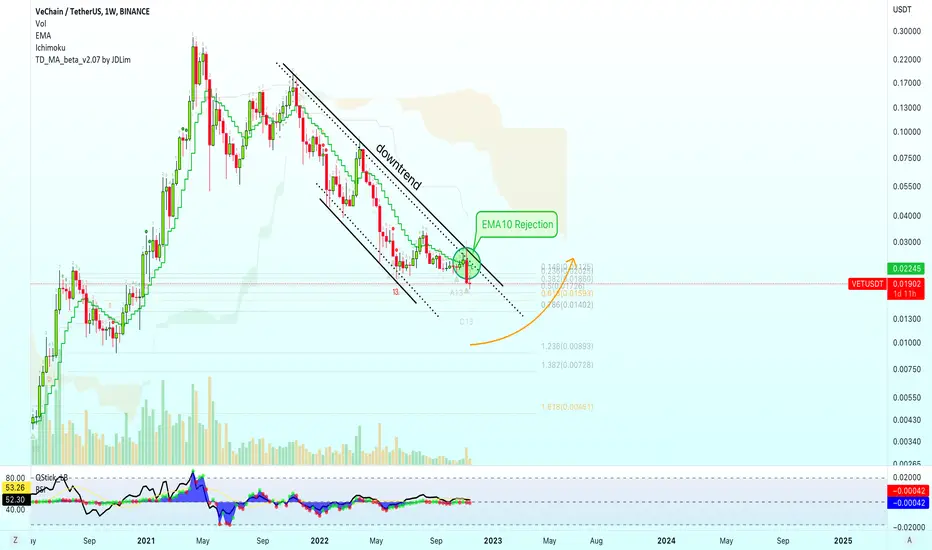
VeChain | Not Ready, Not Yet (Wait For Me)What you see here is a strong downtrend.
The chart looks just like Bitcoin.
We have a weekly rejection at EMA10.
The bias is bearish so VETUSDT is looking for a new support.
CHANGE
Only after prices move and close weekly above EMA10 can we consider the bullish bias, right now it aims lower.
Wait for my timing.
Wait for my signal.
We are waiting for the bottom to settle.
Once the bottom is settled marketwide, there will be countless opportunities, many good long-term bullish charts will develop.
I will share these charts with great numbers for you.
Patiend is key.
Thanks for your enthusiam and support.
Namaste.
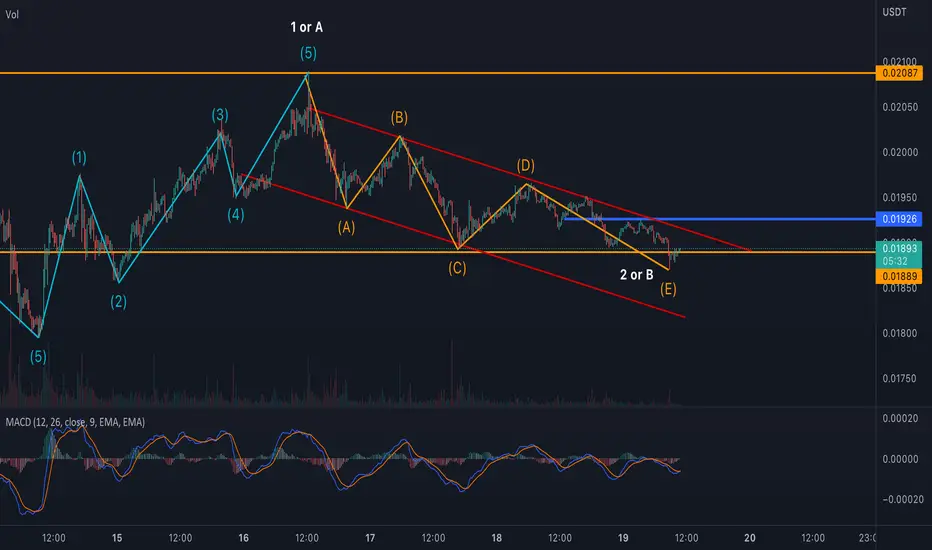
Vet/USDT Long By Eliot WavesHello Crypto Lovers
This is a 15Minutes-time frame analysis for Vet/USDT
In the current chart, you observe 2 or B correction waves that lead us to Up trend waves 3 or C
Warning: This is just a suggestion and I do not guarantee profits. I advise you to analyze the chart before opening any positions.
Wish you luck
$VETUSDT UPDATE!!!Hi Snipers,
Please refer to the recording for the next price levels and scenarios.
Thanks
MS

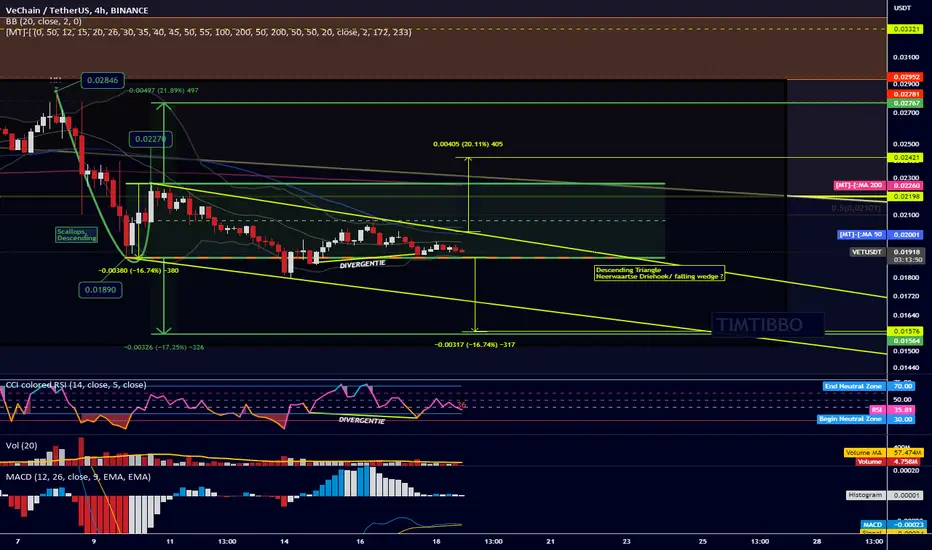
VETUSDT Scallop and Descending TriangleVechain in a scallop descending but also in a Descending triangle.
it quite looks bearish but the Bullish divergence hasnt played out yet.
be aware that the support allready had 2 fails but bulls brought it back in the formation.
take an eye on the Bollinger Band which fits perfectly in the triangle.
the MA50 covering the resistance line of the triangle as well.
the MA200 is at the resistance line of the scallop zone.
when the break out takes place it would be nice to see a re-test.
lets see where the market goes.
on the weekly the outbreak last week was false.. bears brought the bulls back and so they got rejected.
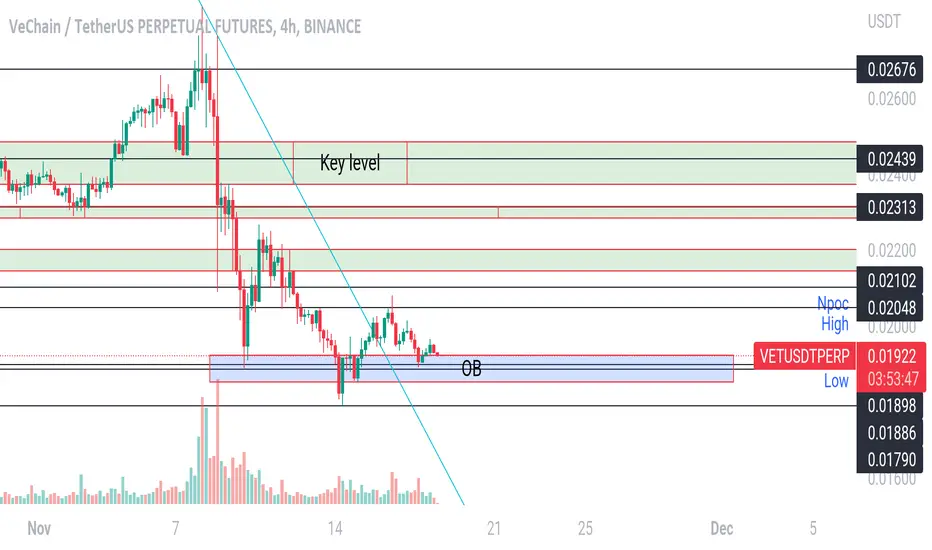
VetusdtVetusdt
Broken hourly channel resistance
Npoc marked if rejected will go back for retest if flipped can test key levels
Ob is order block possible area to retest and gain bullish momentum
Vechain Long term hopium prediction If bitcoin goes lower than 15k expect a 01 cent to be hit log scale looks decent not too accurate realistic wont see a double digits again till late 2023-2024 and new high probable 2025-27