VeChain VET price are holding up well, what are growth prospect?VeChain (VET) is a blockchain platform for logistics management.
The idea behind VeChain is to increase the efficiency, traceability, and transparency of supply chains while reducing costs and putting more control in the hands of individual users.
Maximally logistics optimization is very important in the current difficult times.
Launched in June 2016, VeChain is now one of the oldest specialized blockchain-based logistics platforms.
VET is a token used for transactions and other activities, while VTHO provides commission payment, similar to how Gas works for Ethereum (ETH) transactions.
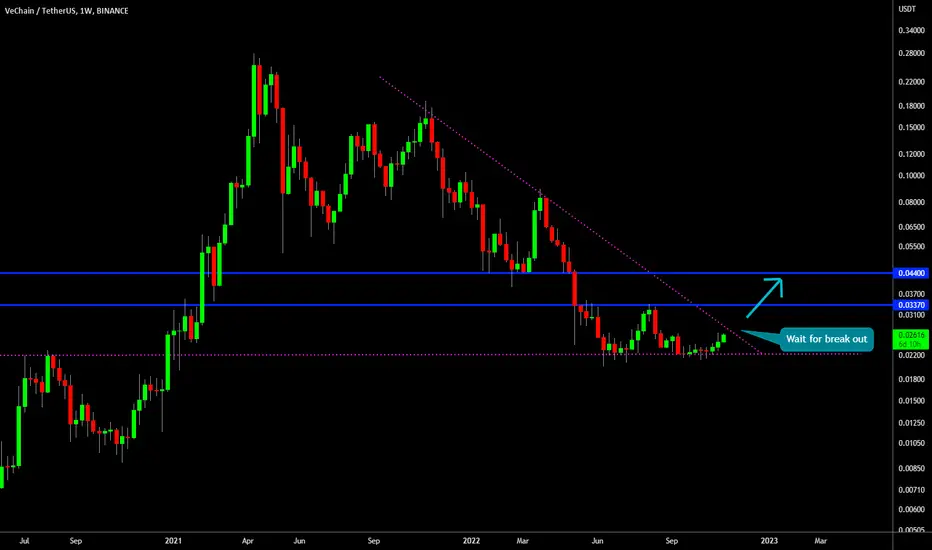
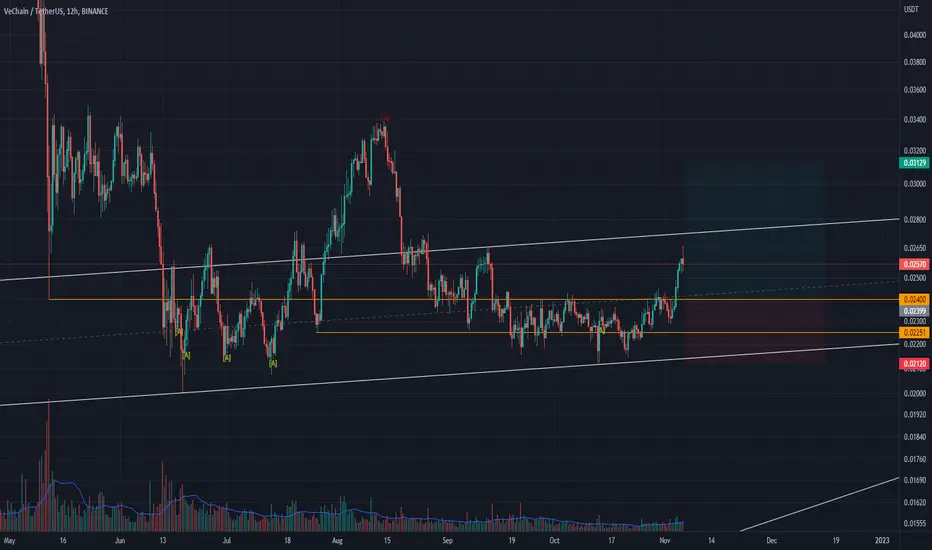
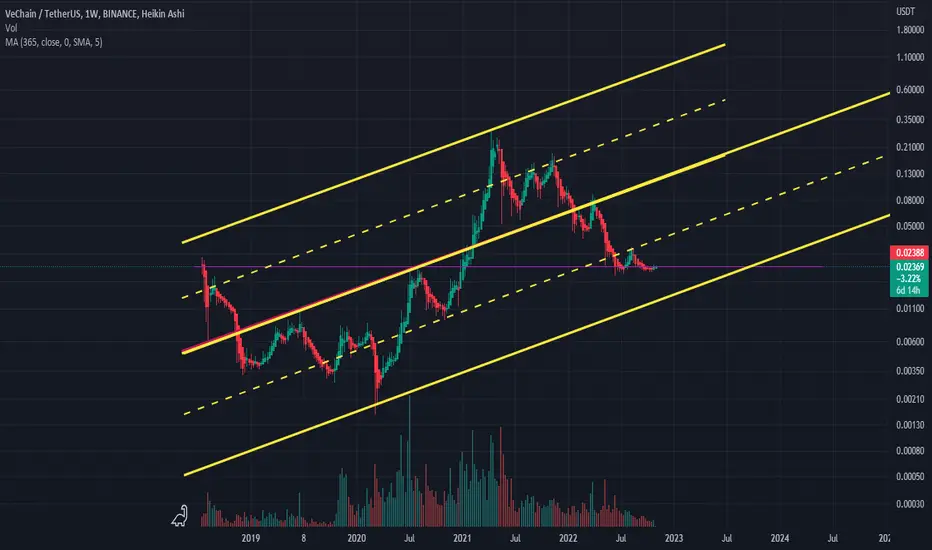
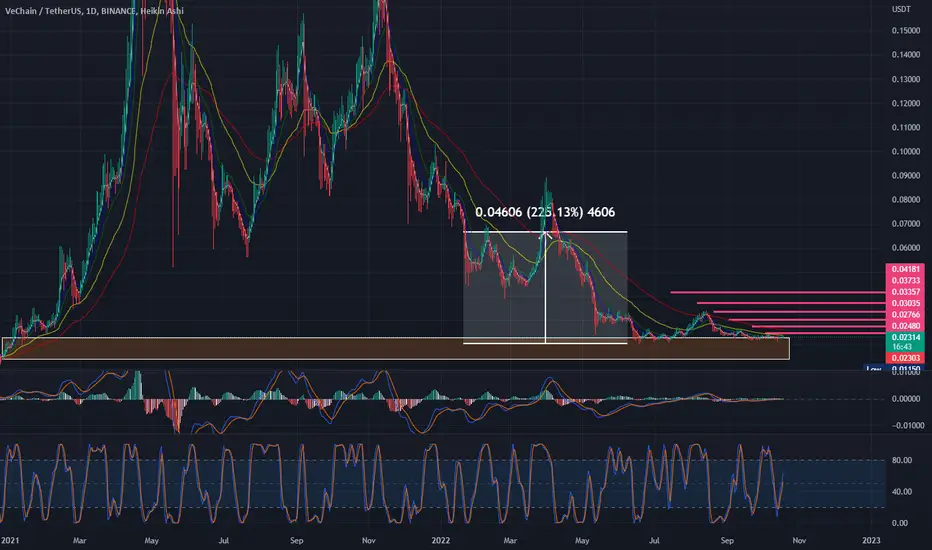
If we look at the chart with weekly candlesticks, we can see that for the last six months the price of VETUSDT has been trading above a strongly mirrored level.
The liquidity zone of $0.02-0.022 in 2018, 2020-2021 and now skillfully played the role of resistance and support alternately for a long period of time.
In case of a positive phase in the cryptocurrency market, $0.039 per VET should be an easy target in the coming weeks.
The medium-term target is $0.06 according to the blue scenario.
If the negative background and "wars" behind the scenes of the crypto market will continue (in particular, we described them in yesterday's FTTUSDT idea)
Then the development of the white scenario can also be considered positive)
The main thing is that buyers of VETUSD keep the price above the liquidity zone of $0.02-0.022 and then everything will be fine for VET in the medium and long term.
_____________________
Did you like our analysis? Leave a comment, like, and follow to get more
VETUSDT.P trade ideas

VETUSDTanalysis was shared yesterday and flying today even in bear market
hold it tightly until we hits our targets
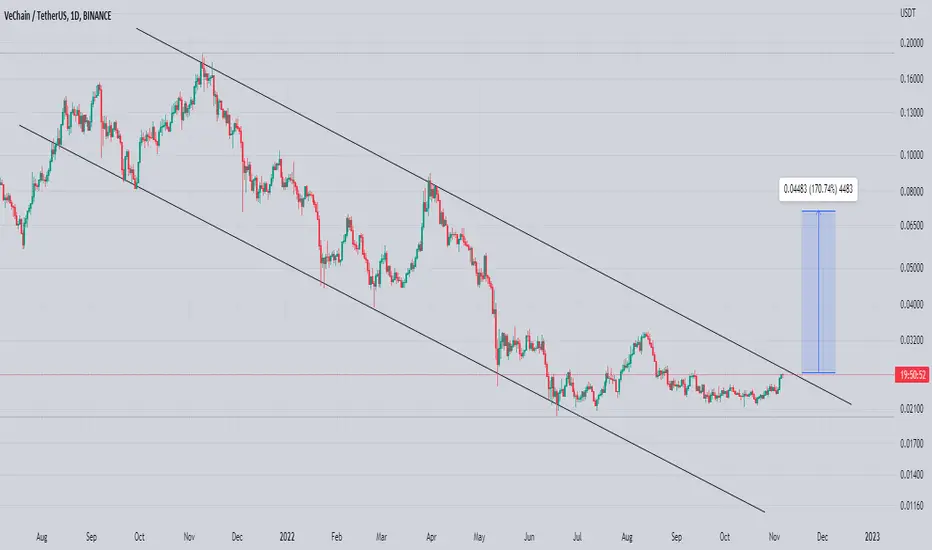
VET (extreme uptrend is possible)VET / USDT
One of my favorite coins which never disappointed me before
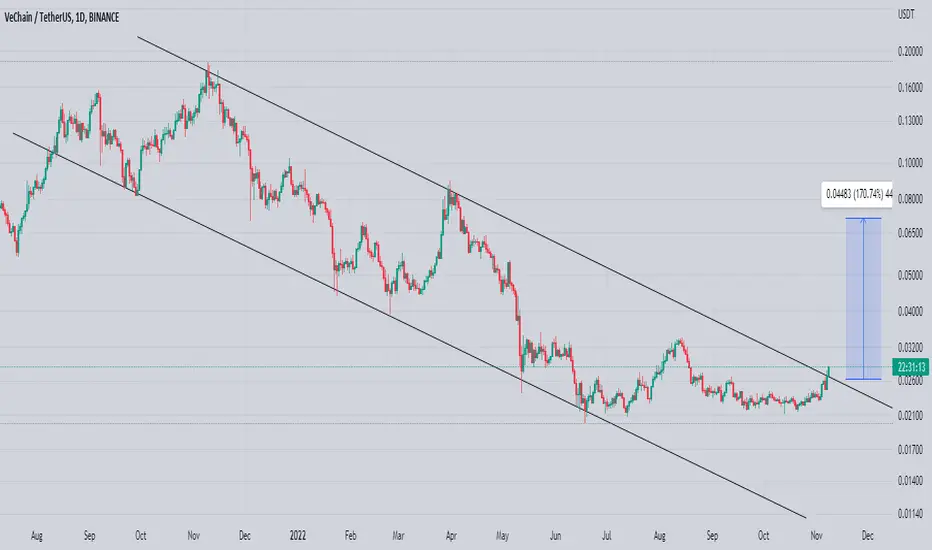
Price is breaking out the 1 year descending channel Which make this coin Looks promising in midterm
If BTC didn’t spoil the party .. extreme uptrend is possible
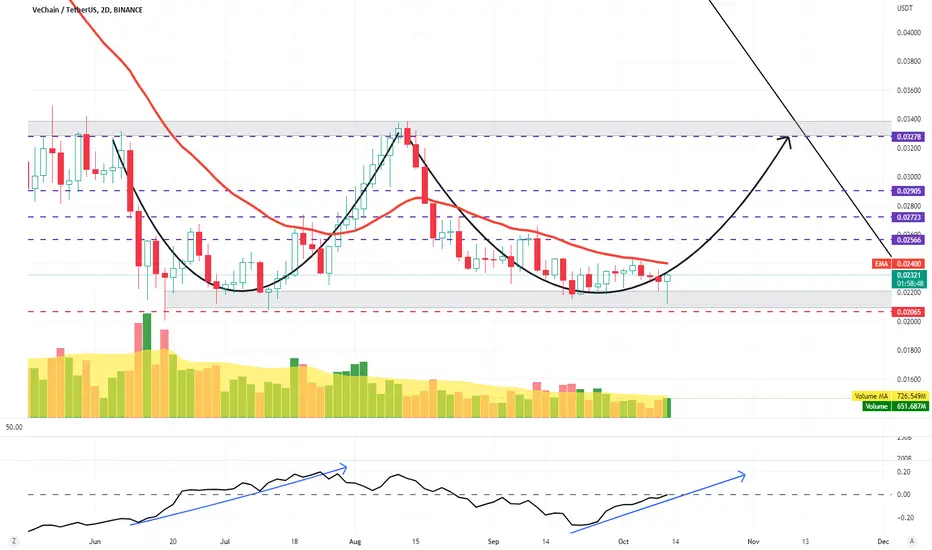
VET Bullish Long!VET is going to finish the cup on a bullish trend and then go on to inverse head and shoulders! I see this heading to the first black line drawn on the chart in early December and the head and shoulders inverse completed in early January. After the new all time highs will be established!
#VET is #bullish in every way in my opinion.
This is my opinion and not financial advice.
Happy #CryptoTrading!
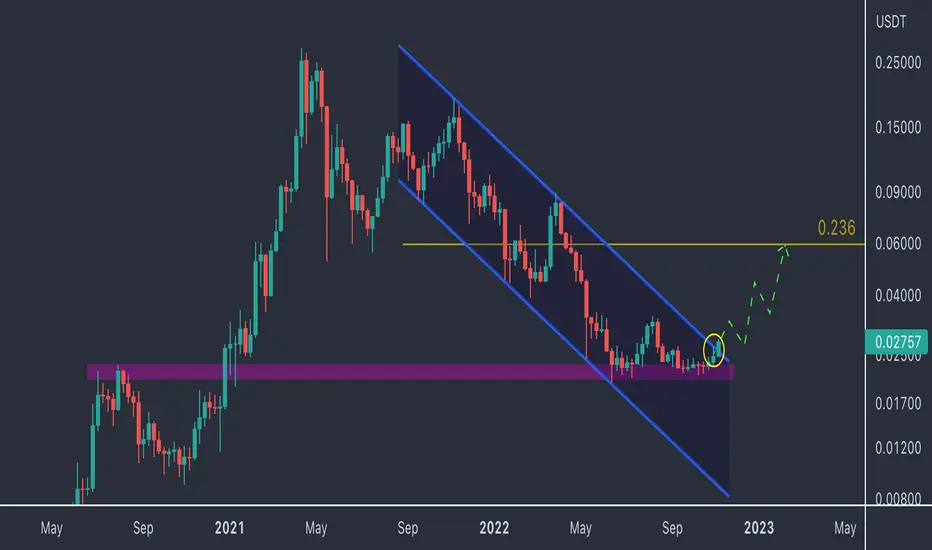
🔥 VET Can Soon Break Out: End Of Bear Market?VET has seen great performance during the most recent bull-market, but recently has been lacking by quite a bit.
However, there might be some light at the end of the tunnel. I'm waiting for the price to break through the top resistance of the triangle pattern. A successful break out might signal the start of a bullish move.
Targets in blue. Be patient!
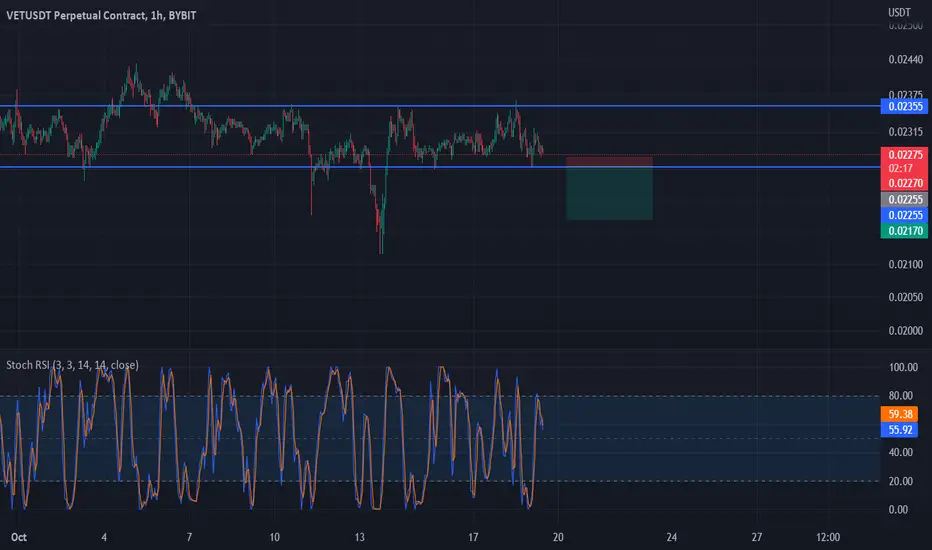
VET SWING TRADE (SPOT)VET broke out above 0.023 key level and it's now the same key level zone that should be retested.
Invalidation would be daily close below .02170
SPOT or LOW LEVERAGE only.
VETUSDTformed descending chsannel
expecting breakout soon
incase of breaking expecting some big moves to the upside
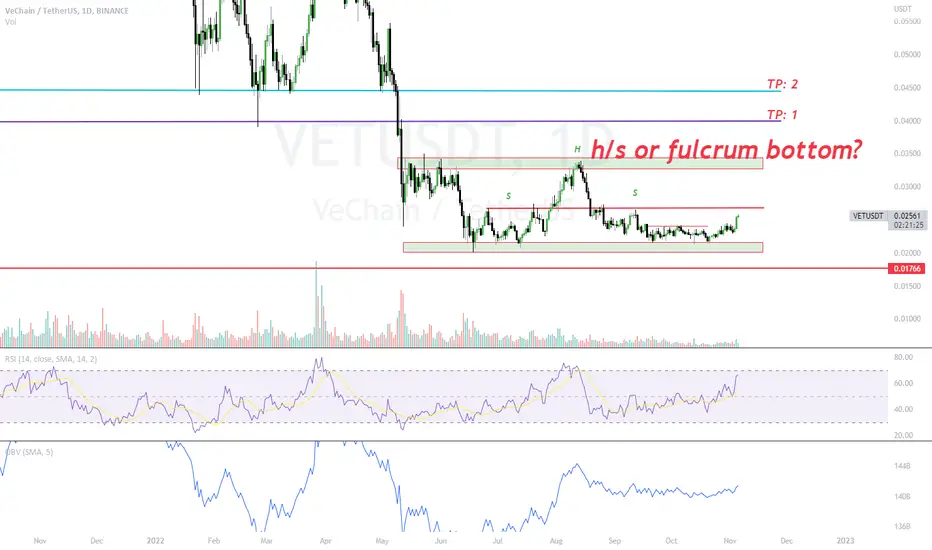
h & s or fulcrum bottom?Still neutral in this trade and watching cautiously. If upside i have my targets TP: 1, TP:2 where i get off the $vet a.k.a Vechain and wait for a bit and see what markets will provide.
Big question Head and shoulder or Fulcrum bottom? Stay cautiously.
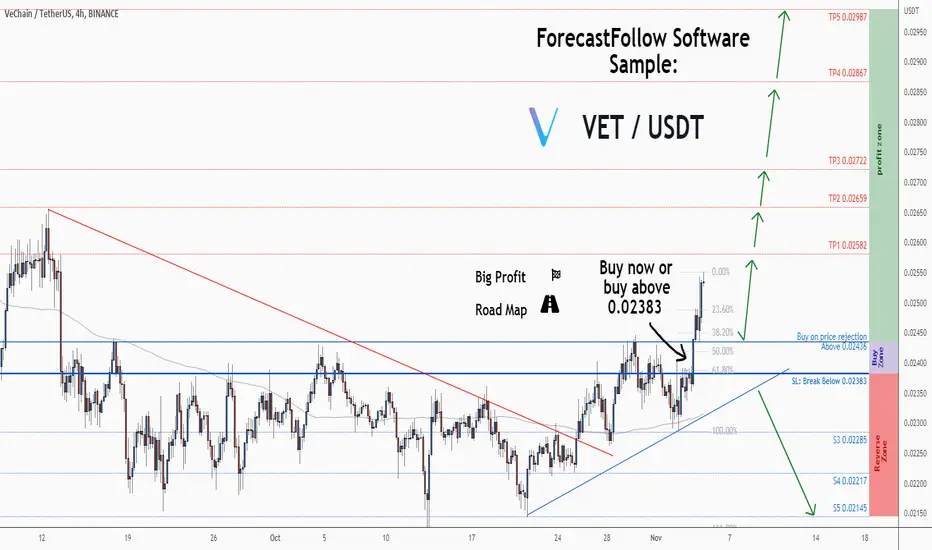
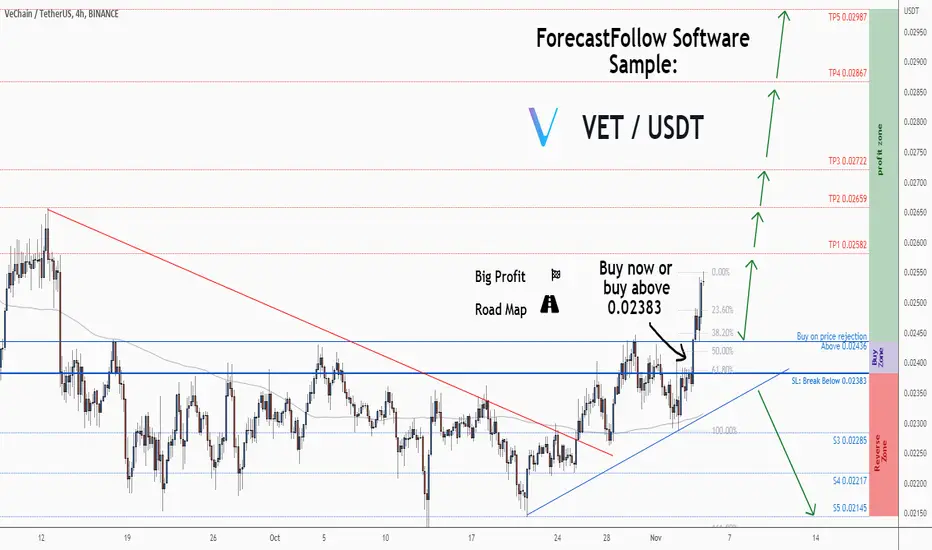
💡Don't miss the great buy opportunity in VETUSDTrading suggestion:
". There is a possibility of temporary retracement to the suggested support line (0.02436).
. if so, traders can set orders based on Price Action and expect to reach short-term targets."
Technical analysis:
. VETUSD is in an uptrend, and the continuation of the uptrend is expected.
. The price is above the 21-Day WEMA, which acts as a dynamic support.
Take Profits:
TP1= @ 0.02582
TP2= @ 0.02659
TP3= @ 0.02722
TP4= @ 0.02867
TP5= @ 0.02987
SL= Break below S2
❤️ If you find this helpful and want more FREE forecasts in TradingView
. . . . . Please show your support back,
. . . . . . . . Hit the 👍 LIKE button,
. . . . . . . . . . Drop some feedback below in the comment!
❤️ Your support is very much 🙏 appreciated!❤️
💎 Want us to help you become a better Forex / Crypto trader?
Now, It's your turn!
Be sure to leave a comment; let us know how you see this opportunity and forecast.
Trade well, ❤️
ForecastCity English Support Team ❤️
💡Don't miss the great buy opportunity in VETUSDTrading suggestion:
". There is a possibility of temporary retracement to the suggested support line (0.02436).
. if so, traders can set orders based on Price Action and expect to reach short-term targets."
Technical analysis:
. VETUSD is in an uptrend, and the continuation of the uptrend is expected.
. The price is above the 21-Day WEMA, which acts as a dynamic support.
Take Profits:
TP1= @ 0.02582
TP2= @ 0.02659
TP3= @ 0.02722
TP4= @ 0.02867
TP5= @ 0.02987
SL= Break below S2
❤️ If you find this helpful and want more FREE forecasts in TradingView
. . . . . Please show your support back,
. . . . . . . . Hit the 👍 LIKE button,
. . . . . . . . . . Drop some feedback below in the comment!
❤️ Your support is very much 🙏 appreciated! ❤️
💎 Want us to help you become a better Forex / Crypto trader ?
Now, It's your turn !
Be sure to leave a comment; let us know how you see this opportunity and forecast.
Trade well, ❤️
ForecastCity English Support Team ❤️
#VETUSDT 2H Chart
Price filled the imbalance around $0.025 and it is currently ranging inside the 5h supply zone. MACD is showing bullish weakness, RSI is overbought and EMAs are bullish. I am now waiting for lower timeframe confirmation before seeing price move all the way down towards the 4h demand at $0.022.

VETUSDT 2020's resistnace act as a good support.VETUSDT Technical analysis update
VETUSDT price reversing from its major support.
Buy zone: $0.0235 - $0.025
Stop loss: $0.020
TP 1: $0.0290
TP 2: $0.0335
TP 3: $0.0385
TP 4: $0.050
Always keep stop loss
Thanks
Hexa

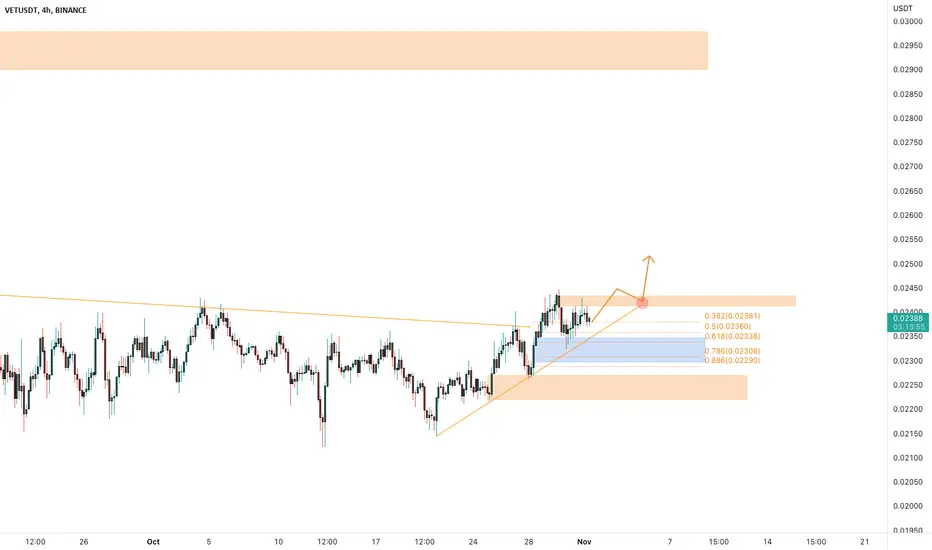
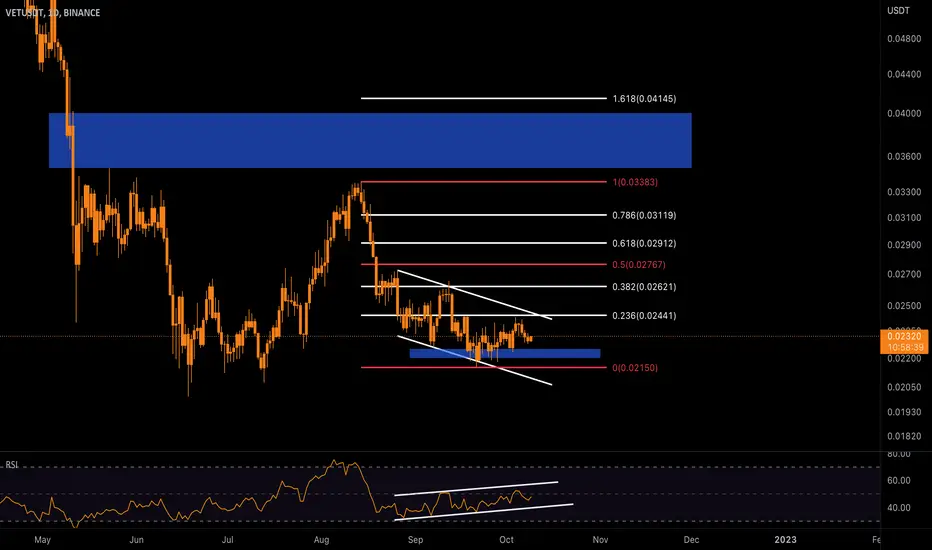
VETUSDT is ready for the breakout?the price is testing the 0.382 Fibonacci level after a clear breakout from the dynamic 4h resistance
How to approach it?
The price needs to flip the local resistance at 0.024$ area and retest it as new support, According to Plancton's strategy, we can set a nice order
–––––
Keep in mind.
🟣 Purple structure -> Monthly structure.
🔴 Red structure -> Weekly structure.
🔵 Blue structure -> Daily structure.
🟡 Yellow structure -> 4h structure.
⚫️ black structure -> <= 1h structure.
–––––
Follow the Shrimp 🦐
I Think We Are Near To End Of Correction...I Draw 2 Channel For You To Analyse And Decide Better....
VET at good buy position
VET prices is now close to the ATL and just touched the demand area.
CMF is increasing and about to cross zero from negative values. This means that buy pressure is coming back.
Fundamental news also supports the prices to go up: VeChain is expanding in Europe by recruiting more than 100 developers.
Let's be patient and wait for VET to take off.
VET ⚡️⚡️ #VET/USDT ⚡️⚡️ DETAYLAR TWEETTER KANALIMDA
Exchanges: Binance Futures
Signal Type: Regular (Long)
Leverage: Cross (20X)
Entry Zone:
1)
2)
3)
Take-Profit Targets:
1)
2)
3)
4)
5)
6)
6)
Stop Targets:
1)
Trailing Configuration:
Entry: Percentage (0.5%)
Take-Profit: Percentage (0.5%)
Stop: Moving Target -
Trigger: Target (1)

VET Channel breakHi Keeping an eye on Vet for a break of the channel. I am feeling more bearing but we will see.
VETUSDT#VETUSDT
i expect there will be uptrend move we are in very important and strenght support zone we are in over sold area that's give us a signals for long move the price try many once to break the support area in daily chart time buy and hold it to the next targets at the chart
MACD is showing bullish
EMAs showing a bullish move
RSI is bullish
targets set at the chart
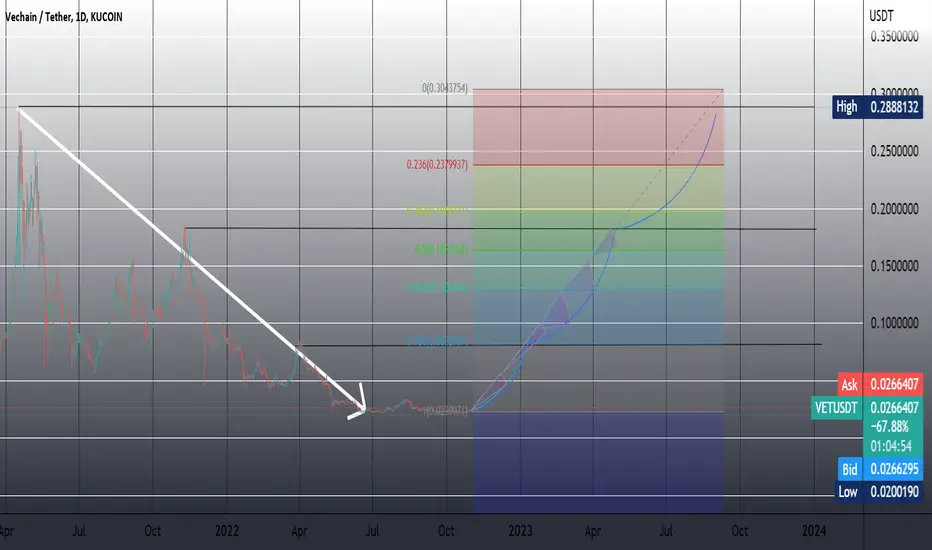
VET __ Ready to explosion ??? 15000%🚀🚀1__ VET is one of support and in footbal word cup in qatar 4 month later !!!!
2__ this chart in weekly is a very very nice flag that its end on 0.618 fibo
3__ its analysis is for buy ( spot )
This analys is very low risk and with grate R/R
GOOD LUCK GUYS ✌🏼🌱

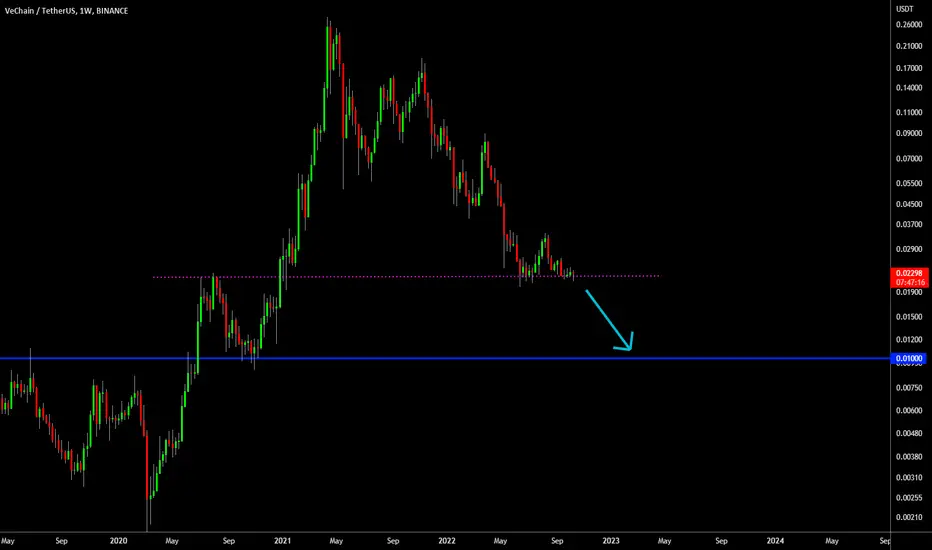
🔥 VET Looking Into The Deep: Likely More Downside AheadVET has been trading alongside the 2020 top for several months now, with the occasional wick below it.
Looking at the macro, it's likely that this support will give in at some point. Once we get a weekly close below this dotted support, I think we will see the next capitulation occur.
My bear-market low target is around $0.01, would be surprised if we will go much lower.
Short VET- RSI crossing down below 50, below 50MA also on the RSI
- Price below PoC
- Price rejecting off 21EMA
- CCI on the way down
Not financial advice, price could reverse without warning this is just a hunch for the short :)

VET - AnalysisOver the past week, VET has been expected to rise to the resistance range of $0.0235-$0.024 and reacted negatively after forming a double ceiling pattern in this area. We can still consider the price inside the descending channel. Because the resistance range indicated on the chart was fake broken. But as long as the support range of $0.022 to $0.0225 is maintained, we can expect the price to exit the descending channel.
But if the price hits this resistance area with a negative reaction this time, the price decline can continue to the monthly support area of $0.020. For the trend to rise in the 4-hour time frame, breaking this resistance range is necessary to continue the trend. On the RSI indicator, you can consider a narrow ascending channel. As long as the bottom of the channel is maintained, we can expect an upward movement.
VETUSDT Swing TradeVET/USDT is sideway in 4H timeframe. Now price at support and have signal to go up again. we can swing to take some profit .
