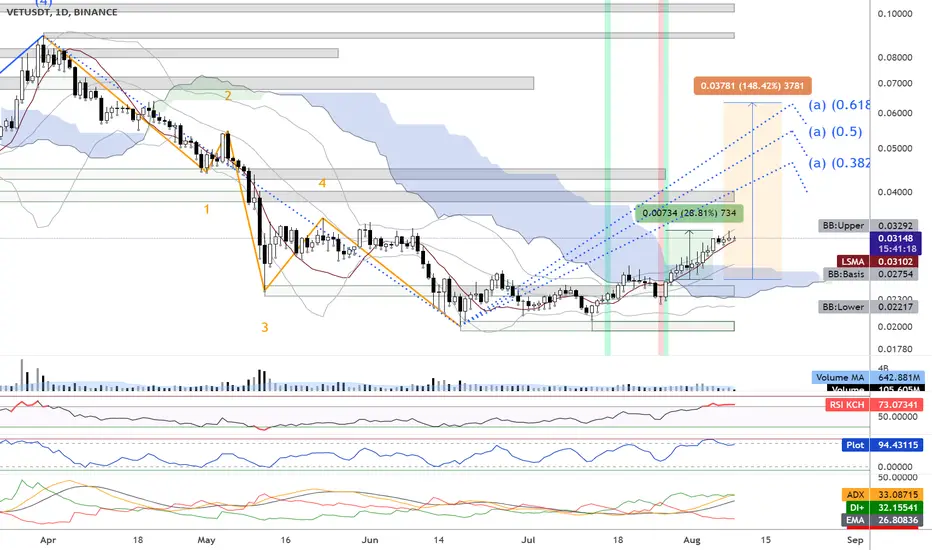
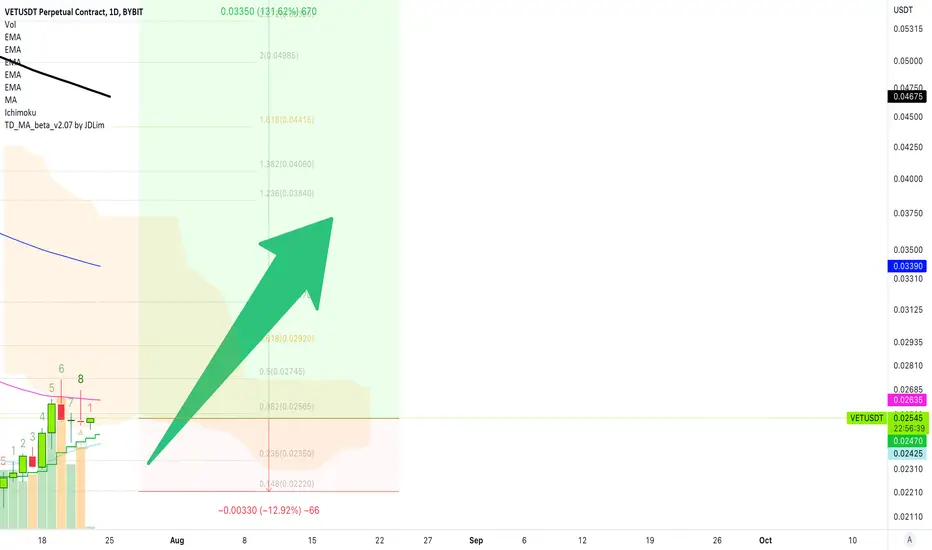
UPDATE: VET UP 29% after bullish signal - Ready for 148% 🚀🚀🚀VET pumped 29% (green price range) after the bull Supertrend Ninja - Clean signals (green vertical line on the background). VET is forming Leg A with a possible bull run to around to 0.063 USD (0.618) or 0.054 USD (0.5). Which is about 148% (orange price range) possible gain.
VET is breaking out of the Ichimoku Cloud , which is considered bullish. The RSI is starting to warm up for a bullrun at 73. RSI Brown at 96. If we take a look at the Average Directional Index ( ADX DI) its in the bullish zone, now starting to move sideways. Currently VET is above its Basis Bollinger Band, Band Basis 20 Period SMA . And above the LSMA as well.
I see more bullish than bearish elements. Since VET price and the RSI are still forming a higher low. Which is a bullish sign as well. Let the GAINS begin !!
Remember to always take profits and use proper risk management!
Thank you for reading.
Namasté 🙏
Disclaimer: Ideas are for entertainment purposes only. Not financial advice. Your own due diligence is highly advised before entering trades. Past performance is no guarantee of future returns.
What Indicators Do I Like To Use:
I am using the "Supertrend Ninja - Clean", which is a trend-following indicator (Green and red vertical lines on the background). When the background of the candlestick closes green (vertical line). It indicates a possible bullish (up)trend. And red for possible downtrends.
VETUSDT.P trade ideas
VETUSDT BAT Bat
The Bat Pattern is a 5-point retracement structure that was discovered by Scott Carney in 2001. It has specific Fibonacci measurements for each point within its structure and it is important to note that D is not a point, but rather a zone in which price is likely to reverse, called the Potential Reversal Zone (PRZ). The B point retracement of the primary XA leg must be less than a 0.618, preferably a 0.50 or 0.382 and the PRZ consists of 3 converging harmonic levels: 1) 0.886 retracement of the primary XA leg, 2) extended AB=CD pattern, usually 1.27 AB=CD and 3) minimum BC projection is 1.618.
The first target would be the 382 retracement of AD and the second target the 618 retracement of AD. A common stop level would be behind the X-point. Conservative traders may look for additional confirmation. Bat Patterns can be bearish and bullish. TradingView has a smart XABCD Pattern drawing tool that allows users to visually identify 5-point reversal structures on a chart.

VETUSDT DAILY ANALYSIS (longtermview)Hello my fellow Traders and Investors,
This is my daily outlook on this pair.
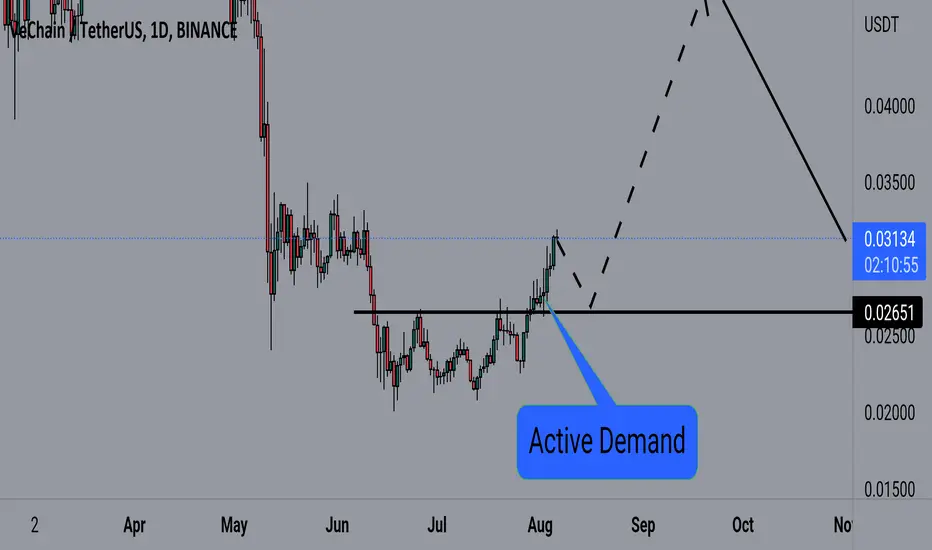
Price created a strong bullish impulse creating a new high and an active level of Demand.
I expect price to retest this active demand and continue in a bullish direction
However, this is a probable outcome, anything can happen.
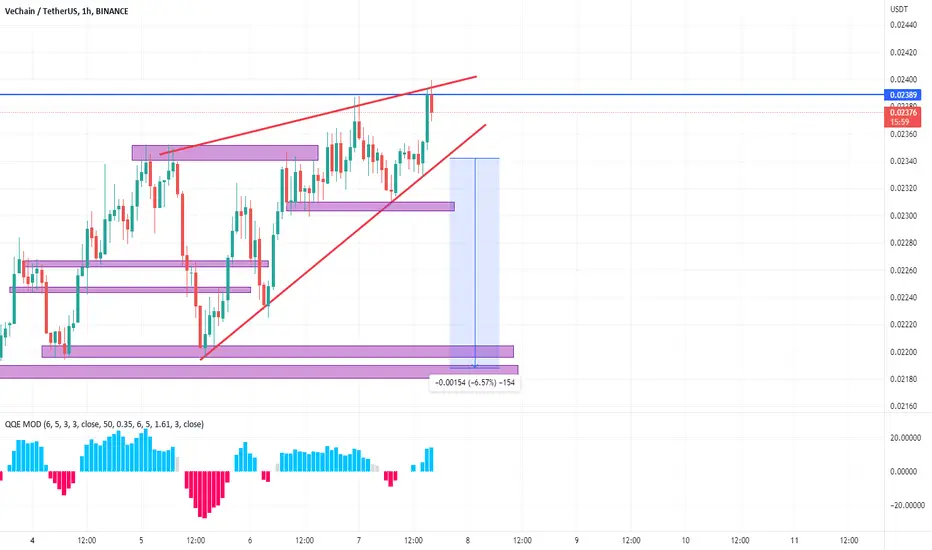
VETThe price rose to the upper limit of the rising wedge. Bearish divergences have formed, RSI has strong resistance. The price may fall to the lower border of the wedge
VETUSDT BAT FORMATIONBat
The Bat Pattern is a 5-point retracement structure that was discovered by Scott Carney in 2001. It has specific Fibonacci measurements for each point within its structure and it is important to note that D is not a point, but rather a zone in which price is likely to reverse, called the Potential Reversal Zone (PRZ). The B point retracement of the primary XA leg must be less than a 0.618, preferably a 0.50 or 0.382 and the PRZ consists of 3 converging harmonic levels: 1) 0.886 retracement of the primary XA leg, 2) extended AB=CD pattern, usually 1.27 AB=CD and 3) minimum BC projection is 1.618.
The first target would be the 382 retracement of AD and the second target the 618 retracement of AD. A common stop level would be behind the X-point. Conservative traders may look for additional confirmation. Bat Patterns can be bearish and bullish. TradingView has a smart XABCD Pattern drawing tool that allows users to visually identify 5-point reversal structures on a chart.

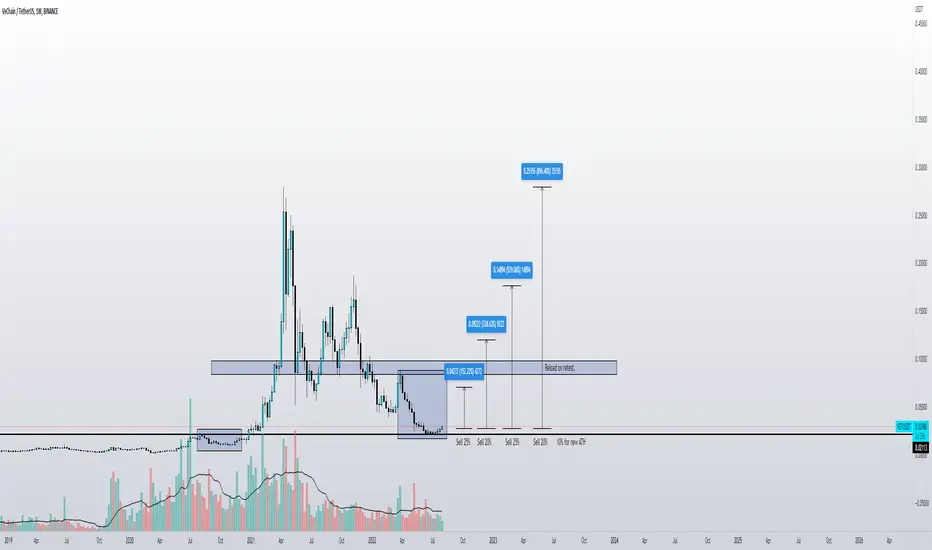
V chain sell chartMade this to remind myself to tkae profits on the way up this time with Vet. LFG!!!
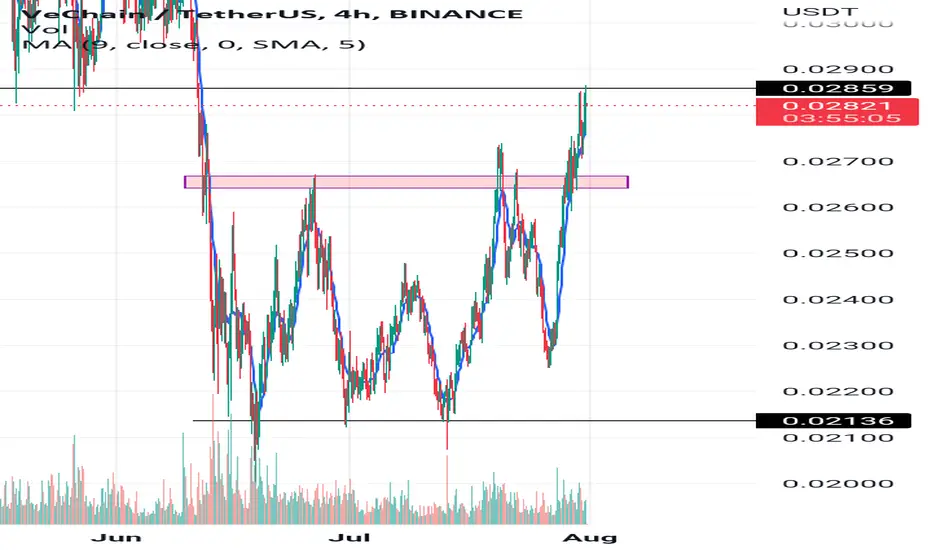
VeChain (VET) - August 4hello?
Welcome, traders.
By "following", you can always get new information quickly.
Please also click "Like".
Have a good day.
-------------------------------------
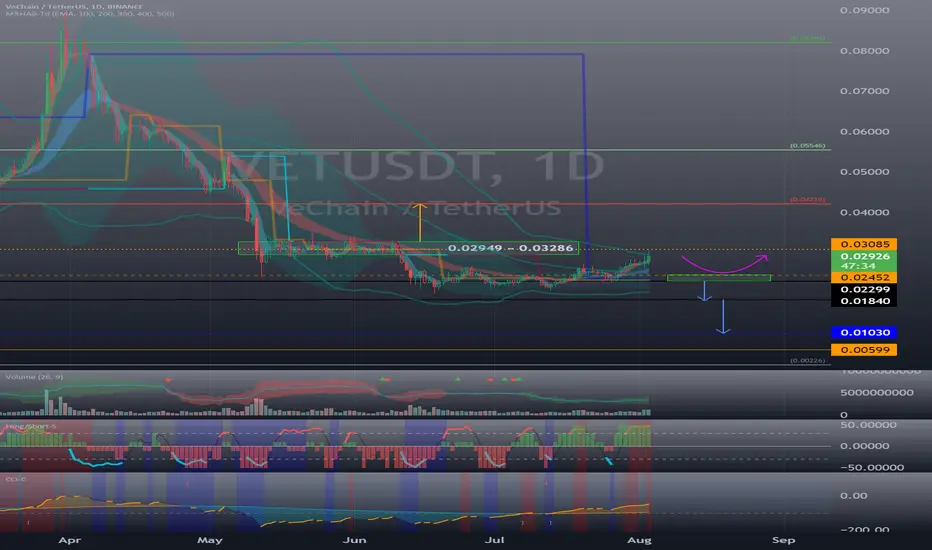
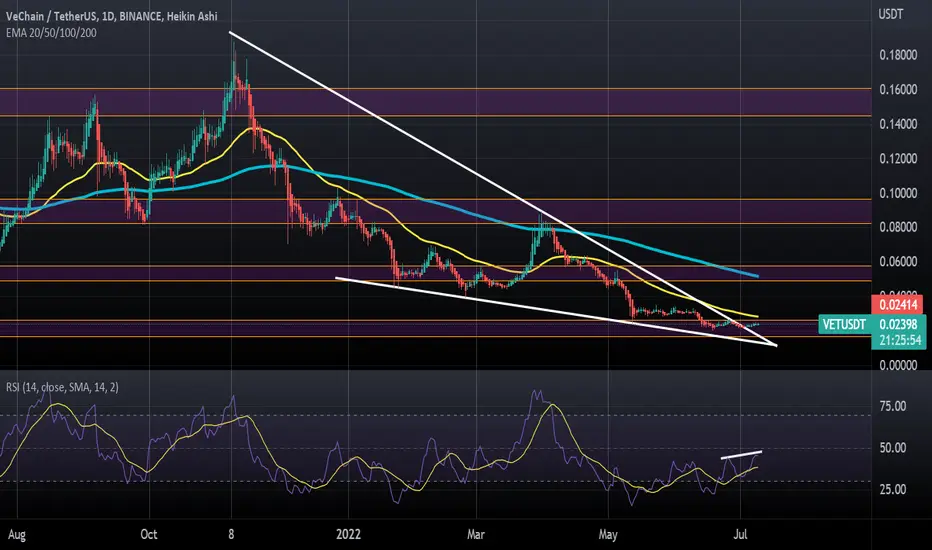
(VETUSDT 1D Chart)
Resistance: 0.04214-0.05546
1st support: 0.02299-0.02452
Secondary support: 0.01840
The 0.04216-0.05546 interval is the interval that determines the trend.
Therefore, the important key is whether it can be supported by rising to the 0.04216-0.05546 section.
To do this, we need to check if it can be supported by rising to the 0.02949-0.03286 section.
If it falls from 0.02299 and is resisted, it may lead to further declines, so a Stop Loss is needed to secure cash.
------------------------------------------------------------ -------------------------------------------
** All descriptions are for reference only and do not guarantee a profit or loss in investment.
** The MRHAB-T indicator, which is inactive on the chart, contains indicators that indicate support and resistance points.
** Background color of Long/Short-S indicator: RSI oversold and overbought sections
** Background color of CCI-C indicator: When the short-term CCI line is below -100 and above +100, oversold and overbought sections are displayed.
** The OBV indicator was re-created by applying a formula to the DepthHouse Trading indicator, an indicator disclosed by oh92. (Thanks for this.)
(Short-term Stop Loss can be said to be a point where profit and loss can be preserved or additional entry through split trading. It is a short-term investment perspective.)
---------------------------------
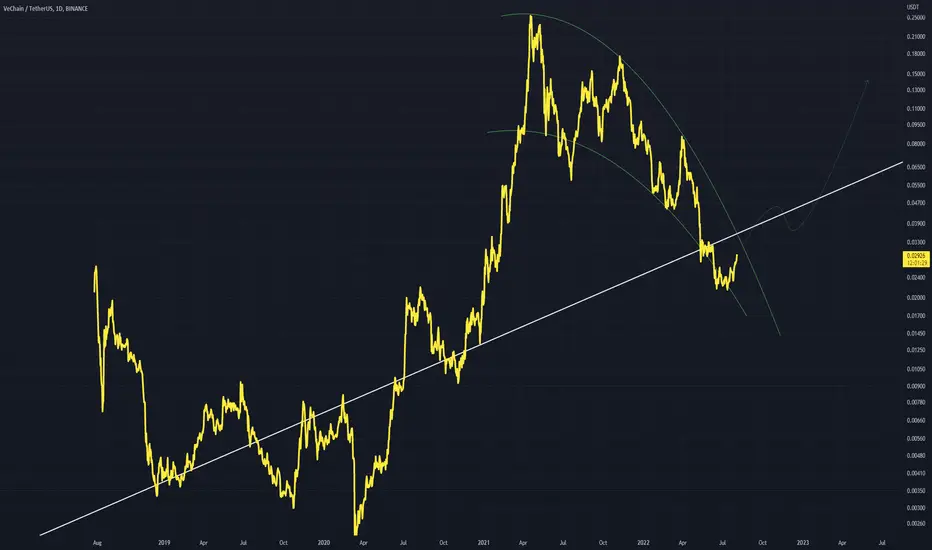
VETUSD Scythe PatternA scythe pattern which is a bullish continuation pattern along this white uptrend
Roadmap $vechainRemember to always, always place your stop loss at the appropriate levels immediately after you have put in your long/short position so as not to get stopped out at your trades.
>>>>> Always be prepared for either scenario of upwards movement, downwards movement, or sometimes even sideways movement (consolidation phase & sometimes even extended consolidation phases). <<<<<
Constructive and positive comments are welcome.
Consider leaving a like after viewing my post, and click on Follow to receive my latest and updated posts

$VET- updatebuy as close to the thick red line ( close below that is invalidation) , close above the yellow line or 50 ma would confirm smooth sailing till targets above.
not in this trade but looking good , possible lever and leave for a while trade .
VeChain (VET) Price Prediction 2022 VeChain (VET) Price Prediction 2022
VeChain holds the 37th position on CoinGecko right now. VET price prediction 2022 is explained below with a daily time frame.
The above chart of VET laid out the horizontal channel pattern, also known as the sideways trend. In general, the horizontal channel is formed during the price consolidation. In this pattern, the upper trendline, the line which connects the highs, and the lower trendline, line which connects the lows, run horizontally parallel and the price action is contained within it.
A horizontal channel is often regarded as one of the suitable patterns for timing the market as the buying and selling points are in consolidation.
Currently, VET is in the range of $0.02545. If the pattern continues, the price of VET might reach the resistance level of $0.03322. If the trend reverses, then the price of VET may fall to $0.02361, and $0.02071.
VeChain (VET) Support and Resistance Levels
From the above daily time frame, we can interpret the following as the resistance and support levels of VET.
Resistance Level 1 $0.02667
Resistance Level 2 $0.03366
Resistance Level 3 $0.04358
Resistance Level 4 $0.06823
Support Level 1 $0.02025
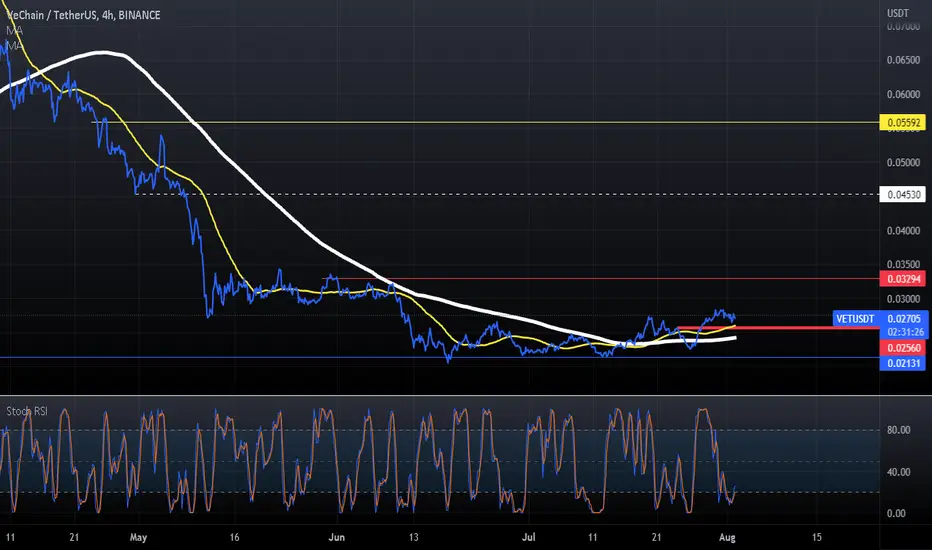
VET Resistance & Support Level

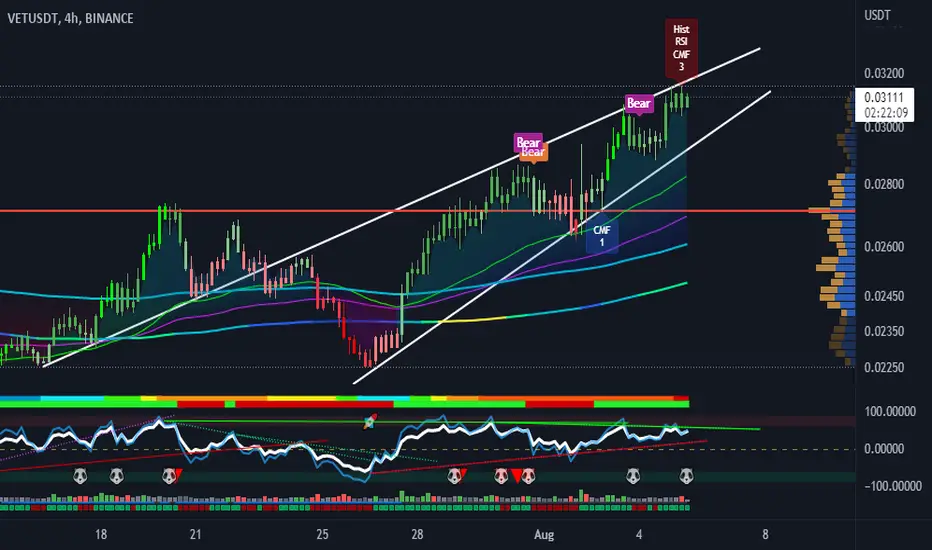
VetUsdt 4h is about on resistance, Vet Usdt on 4H TF testing is strong resistance , imo will break out, as vet on Weekly TF breakout trend already...

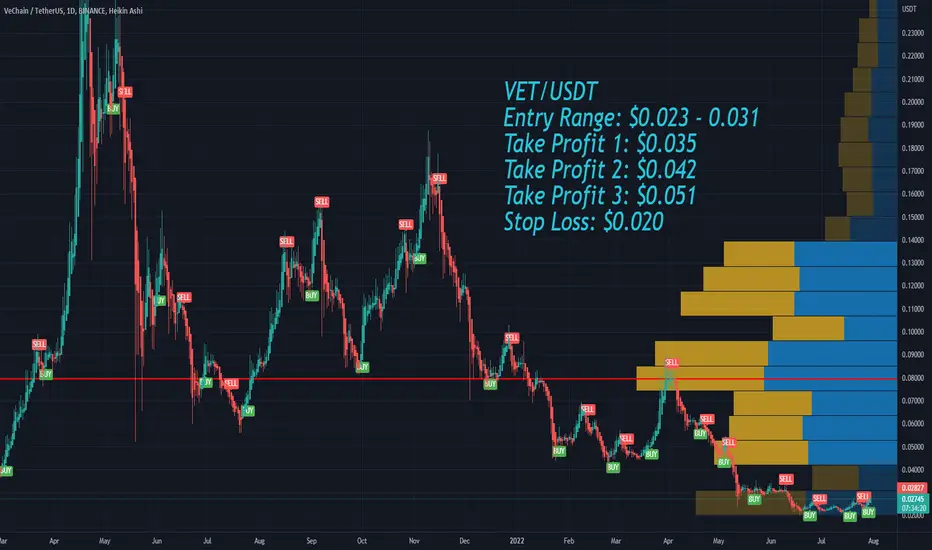
VeChain VET long Entry Range, Take Profit and Stop LossVET/USDT
Entry Range: $0.023 - 0.031
Take Profit 1: $0.035
Take Profit 2: $0.042
Take Profit 3: $0.051
Stop Loss: $0.020
previews short
Cautious VETHello , as you can see on the chart we reached the top of the trend line now we will have cross path either we go to the bottom of the trend line , or we breakthrough the trend line and we will have strong move on chart 0.33$ , you should see btc chart more than your alt coin , this time your stop losses will not be on VET this time will be on the condition of btc , if btc losses 22,5k it will be very bearish on alts , is very healthy on long term but no the short term , thank you and I’m happy to receive your thoughts ;)
#VETUSDT 4H Chart
Price recently did a change of character and it turned bearish. MACD is bearish, RSI is sold and EMAs are neutral. I expect price to tap into the 4h supply at $0.026 and move down from there. We would be looking to short from that area.

VeChain Trade Signal (130% Potential Profits)ENTRY: $0.02300 - $0.02620
TP1: $0.03160
TP2: $0.03800
TP3: $0.04410
TP4: $0.04980
TP5: $0.05900
STOP: Close daily below $0.02200
---
Very low risk with nice potential for rewards.
This is not financial advice.
Do your own research before trading.
I am wishing you lots of growth, health, wealth and success.
Now & always.
Namaste.
VETUSDT wants the breakout?The price is testing the weekly key level at 0.021$ where the price got new liquidity.
Now the market is testing the 4h resistance on 0.225 below the daily dynamic resistance
How to approach it?
IF the price is going to have a breakout from it and retest the 4h resistance as new support, According to Plancton's strategy , we can set a nice order
–––––
Keep in mind.
🟣 Purple structure -> Monthly structure.
🔴 Red structure -> Weekly structure.
🔵 Blue structure -> Daily structure.
🟡 Yellow structure -> 4h structure.
–––––
Follow the Shrimp 🦐

#VET is ready to pump to 0.02750#VET retested the crucial support and continue moving to upward
See the chart
VET.Usdt (Y23.P1.Vidoe1). How to trade this coin.#VET #VECHAIN
We review the current levels to trade and MACRO OUTLOOK, levels of interest..
All the best.
S.SAri

VETUSDT 1D chartTrading on a demand zone
RSI in average level and can see a divergence and can expect downward continuation
VWMA shows a downtrend
Major resistance 50EMA, 200 EMA and supply zone at 0.048
EMA shows full bearish market condition
Should wait till breakout in demand zone to short
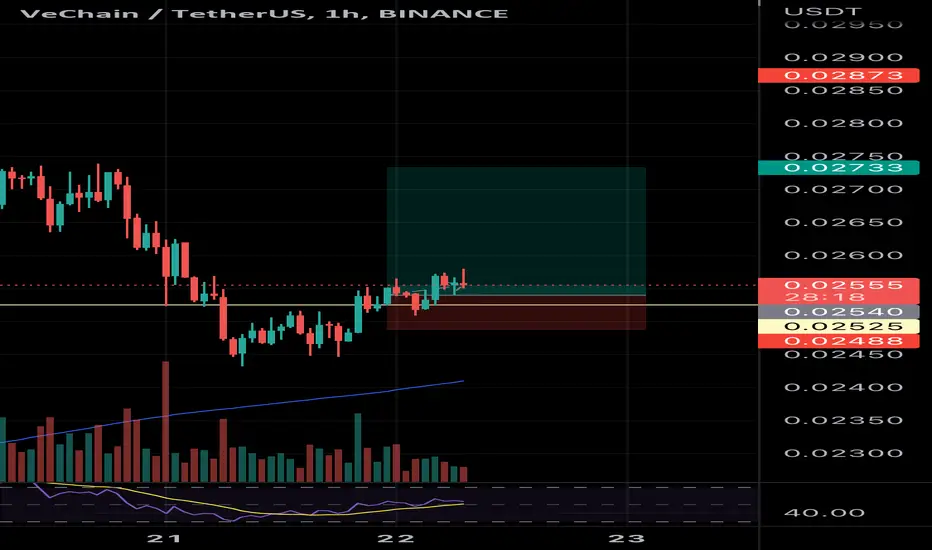
VETUSDT - $0.03185 - $0.02980 by the end of JulyHi,
This is iJustCoin, the one lucky trader who puts his money where his mouth is!
Looks like VeChain is in accumulation phase. Buying volume is turning up on the short-term group of timeframes. This may reverse the market in tact with the accumulation schematic.
The momentum is also on the bullish side.
I expect the price action to go up to the $0.03185 - $0.02980 price range. This price range might get hit by 14 July - 22 July.
======
Click like and make sure you are following me on TradingView!
Feel free to ask me any questions related to the idea in the comment section - i'll be glad to reply.
Good Luck, Bye-bye!
And remember this market doesn't respect doubters!
======
***
Chart Code:
Pastel Green Vertical Line - Long Signal (PAI Reader Strategy)
Pastel Red Vertical Line - Short Signal (PAI Reader Strategy)
Red Dashed Lines - Downward Reversal Momentum
Green Dashed Lines - Upward Reversal Momentum
Green Rectangle - Buying Area
Red Rectangle - Selling Area
Red Line - Stop Loss
Bold Aqua Dotted Line - Estimate Price Direction
Yellow Dotted Lines - Estimate Timerange of the price target might be getting hit
Orange Dotted Line - Profit taking Point
***

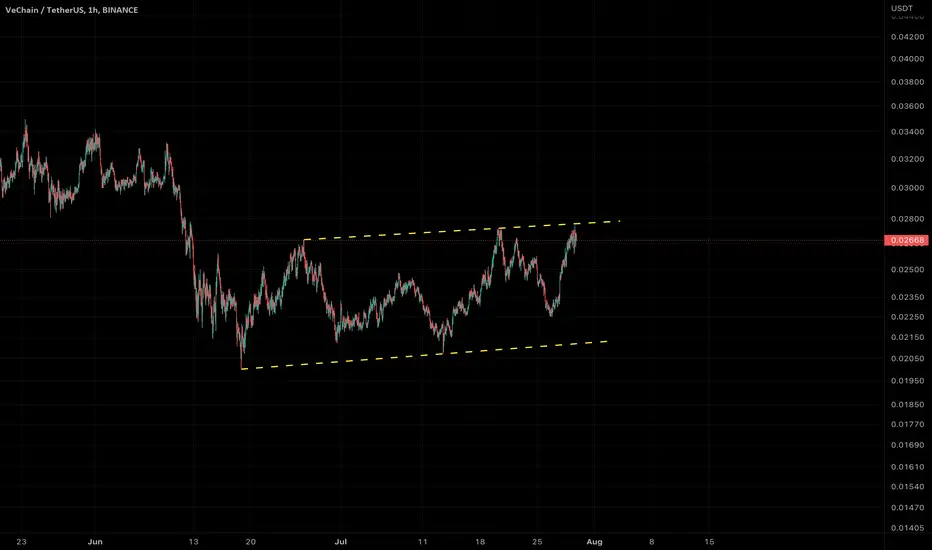
Rising Wedge Pattern on the VET Chart. Big Rising Wedge Pattern forming on the VET Chart. Something to keep an eye for.