#VETUSDT_DAccording to the specified movement , I Expect the formation of a Triangle pattern in the corrective wave (WXY) .
VETUSDT.P trade ideas

VeChain (VET): Incoming Drop, Be Careful As We Might Fall Hard!VeChain has shown great dominance of sellers since last time we looked at the coin (month ago).
Ever since sellers took control over the resistance zone and re-tested it multiple times, we are now expecting to see a further movement to lower zones.
We are waiting for the price to bounce in between the resistance zone and that smaller bullish trend where the price is sitting currently, and at one moment we expect the sellers to break it, which would lead to the movement to lower zones then!
Swallow Team

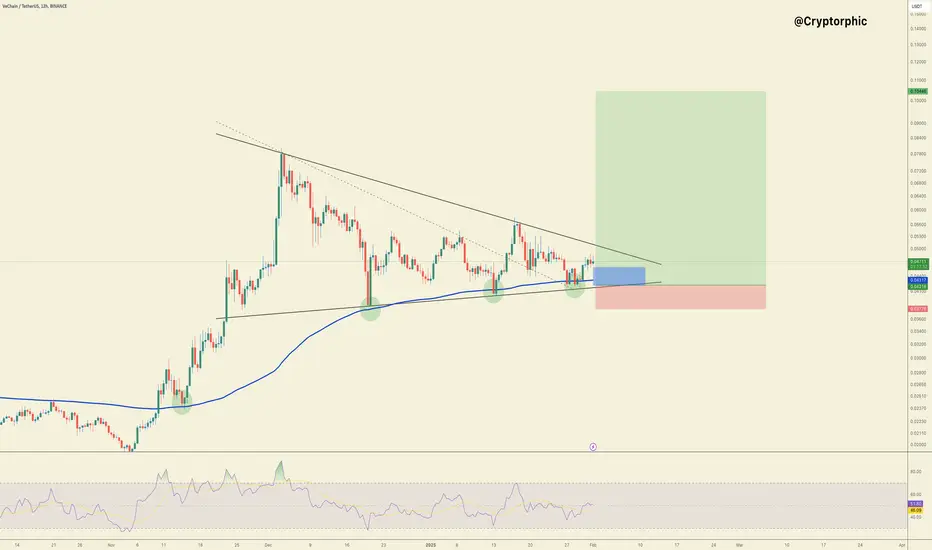
$VET Ready to Breakout?NYSE:VET
VET is forming a symmetrical triangle pattern, with price consolidating near key support and the blue MA.
A breakout above the resistance trendline could trigger a strong move, while a breakdown may lead to invalidation.
Accumulation Zone: 0.04317 - 0.04412
SL/Invalidation: 0.03778
DYO, NFA.
VET Trading RangeVET has some rectangle range maybe reaccumulation or redistribution zone
buy some at 42-44 is good option and jackpot if this is wyckoff accumulation

VETUSDT analysis and prediction 2025 #VeChain #VET #Crypto #Bloc**VeChain (VET) Fundamental Analysis for 2025**
#VeChain #VET #Crypto #Blockchain #VETUSDT #CryptoAnalysis #CryptoPrediction #Altcoins #Cryptocurrency #DeFi #NFT #SupplyChain #VeChainThor #VTHO #CryptoInvesting #TechnicalAnalysis #FundamentalAnalysis #Bullish #Bearish #CryptoMarket
#### **1. Project Overview**
VeChain is a blockchain platform focused on supply chain management and business processes. It provides real-world utility by helping companies track and verify products through decentralized technology. Major partnerships include Walmart China, BMW, PwC, and DNV GL.
#### **2. Market Position & Use Cases**
- **Supply Chain Management:** Used in industries like food safety, luxury goods, and healthcare.
- **NFTs & DeFi:** Expanding beyond logistics into decentralized applications.
- **Corporate Adoption:** Strong enterprise partnerships enhance its real-world demand.
#### **3. Tokenomics**
- **VET (Main Token):** Used for transactions and value transfers.
- **VTHO (Gas Token):** Used for transaction fees, generated by holding VET.
- **Staking Mechanism:** Investors earn passive income through staking rewards.
#### **4. Strengths & Opportunities**
✅ **Strong Enterprise Adoption:** Companies actively use VeChain for real-world applications.
✅ **Low Fees & Scalability:** Efficient transaction processing with minimal costs.
✅ **Government & Regulatory Support:** Recognized for compliance and sustainable blockchain solutions.
✅ **Growing Ecosystem:** Expansion into DeFi, NFTs, and carbon tracking.
#### **5. Risks & Challenges**
❌ **Dependence on Partnerships:** Success relies on corporate adoption.
❌ **Competition:** Rivals like IBM Blockchain and Chainlink pose threats.
❌ **Market Volatility:** Crypto downturns impact VET's price significantly.
#### **6. 2025 Prediction Summary**
- If adoption continues, **VET could reach $0.07–$0.10**.
- A bull market could push it higher, but a bearish trend may see **VET around $0.035–$0.05**.
- Long-term potential depends on continued enterprise adoption and blockchain growth.

VeChain: Rise from Channel Bottom to Top or a Big Breakout?💠 Technical Analysis:
VeChain has been consolidating within a price channel and recently found support at the channel bottom. It has also broken its downtrend line and a key static resistance level, now pulling back to this zone.
📊 Buy Signal:
🎯 Targets:
🔹 First Target: Channel top
🔹 Second Target: If the channel breaks, a move equal to its width
📢 What’s your opinion on this analysis? Drop a comment! 🚀🔥
Does history repeat itself?hello guys
We came with the analysis of this coin.
According to the past of the chart and the price correction and the period of time the price has been suffering, we can give the probability that the history will repeat itself.
we will see...
*Trade safely with us*

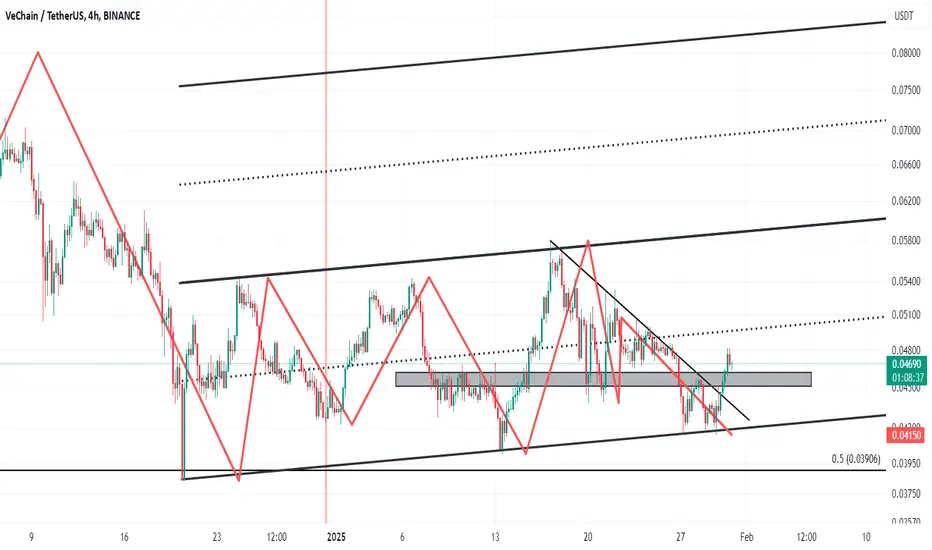
#VET/USDT lONG Ready to go higher#VET
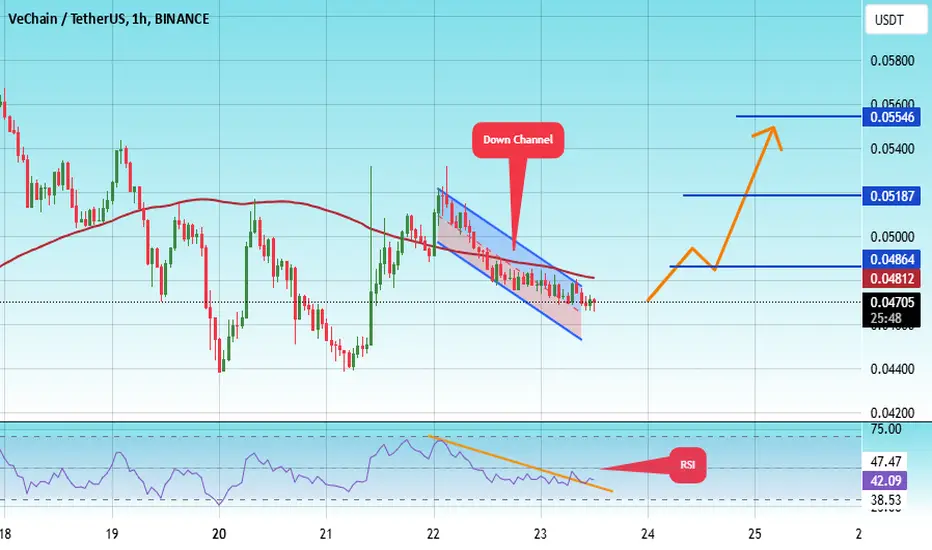
The price is moving in a descending channel on the 1-hour frame and sticking to it well
We have a bounce from the lower limit of the descending channel, this support is at 0.04570
We have a downtrend on the RSI indicator that is about to break, which supports the rise
We have a trend to stabilize above the moving average 100
Entry price 0.04670
First target 0.04860
Second target 0.05180
Third target 0.05546
#VET/USDT #VET
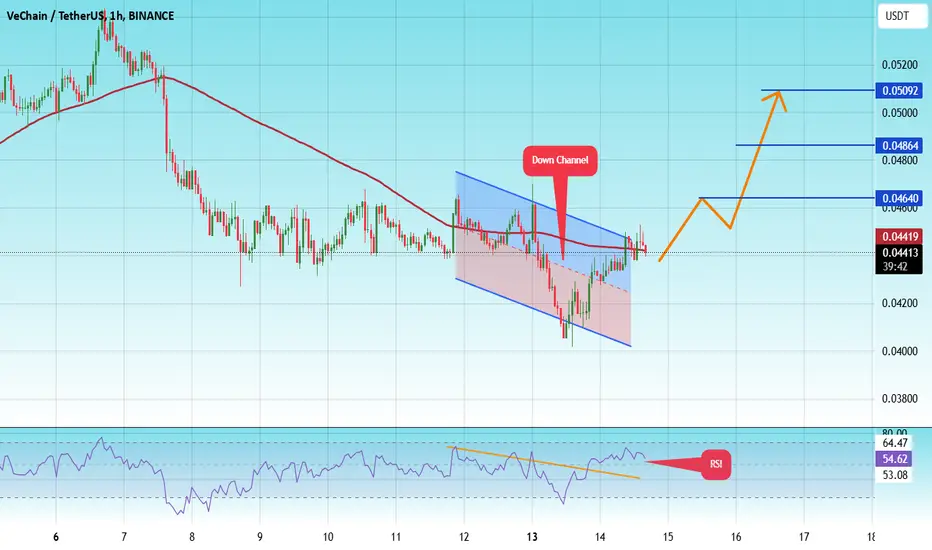
The price is moving in a descending channel on the 1-hour frame and is expected to continue upwards
We have a trend to stabilize above the moving average 100 again
We have a descending trend on the RSI indicator that supports the rise by breaking it upwards
We have a support area at the lower limit of the channel at a price of 0.04111
Entry price 0.04407
First target 0.04640
Second target 0.04860
Third target 0.05090
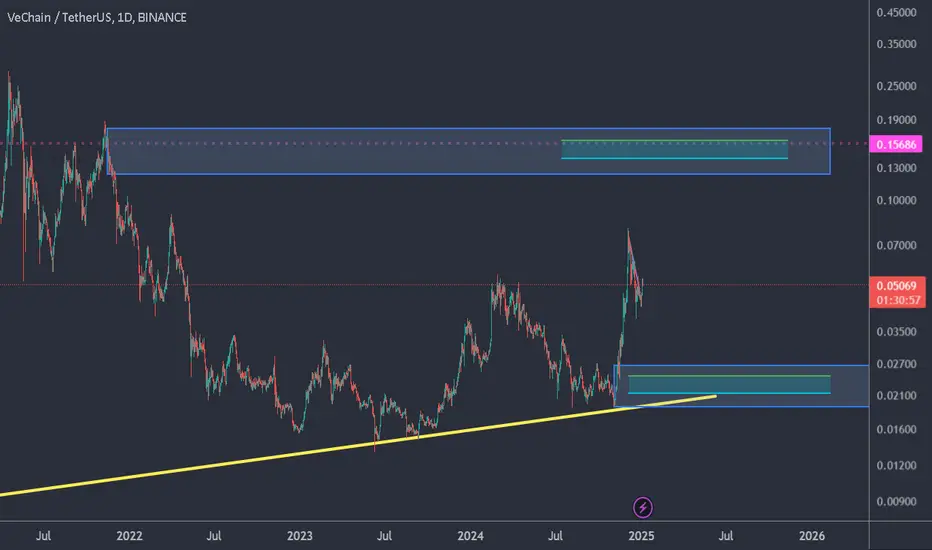
VET waiting my targetsBINANCE:VETUSDT
Possible Targets and explanation idea
➡️Vet weekly timeframe still waiting signal close short on weekly and buy based on TradeON
➡️I think we will see drop to 0.27 zone again sweep liquidity and close monthly gaps
➡️0.009-0.007 more likely will be a bottom for Vechain
➡️Positive bounce its a 0.039 monthly gap around 0 lvl
➡️Even after this bounce I think we will see continuation to low targets
Hope you enjoyed the content I created, You can support with your likes and comments this idea so more people can watch!
✅Disclaimer: Please be aware of the risks involved in trading. This idea was made for educational purposes only not for financial Investment Purposes.
---
• Look at my ideas about interesting altcoins in the related section down below ↓
• For more ideas please hit "Like" and "Follow"!

VET is wet ...1 h time frame setup for VET usdt pair
previous setup on nobody candle hit the target as well
and now here we go for second setup
what will be happen do you think?

VETUSDT Wave AnalysisHello Friendes. According the chart of VETUSDT I expected to this movement and 0.105$ . This Way possible by cottrction but see that price.
VET potential risk of -60%I am curious if more people are noticing similar patterns by multiple crypto's whereby the prices are moving probably in a corrective Elliot abc phase. Whereby in this case VET has a risk of a potential decline of -60%.
BTC is not looking good either (see my BTC chart for further context).
And see my charts for ETH, ADA and SOL. They are all showing the same patterns.

VeChain Breaks Free from Range; Ready to Soar!🔍 Analysis:
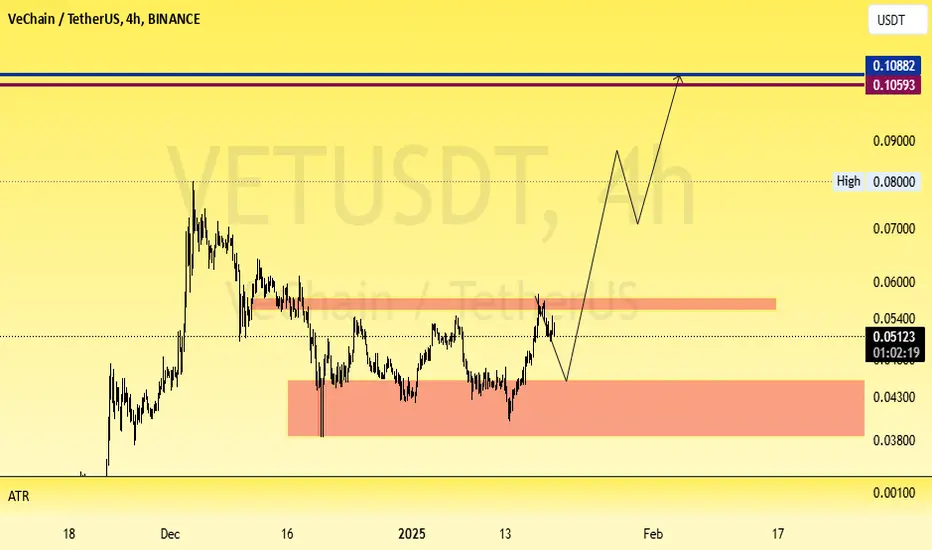
VeChain (VET) has finally escaped the consolidation range of $0.04 to $0.055, breaking out with a strong bullish candle. This signals the potential start of a powerful uptrend.
💡 Signal Details:
- Entry Point: $0.056
- Stop Loss: $0.038
- Take Profit: $0.110
- Risk to Reward Ratio: 3
- Potential Profit: 96%

$VET/USDT Analysis The price is at a key resistance zone in red.
🎯 Targets if breakout occurs:
1️⃣ First Target: Green line
2️⃣ Second Target: Blue line

TradeCityPro | VET: Decoding Trends & Revealing Hidden Potential👋 Welcome to TradeCity Pro! In this analysis, I will review the VET coin for you. This coin belongs to the VeChain project, one of the well-known crypto projects.
📅 Daily Timeframe: Entering the Golden Zone
In the daily timeframe, we are witnessing an upward leg that, after reaching the resistance at $0.07756, has entered a correction phase and is currently moving into the Fibonacci golden zone between 0.5 and 0.618.
🔍 Previously, it seemed that price bottoming at the area of $0.04361, which coincides with the 0.5 Fibonacci level, would occur, but in today's candle, the price is moving towards the 0.618 area and has broken the 0.5 level.
✨ Additionally, the 99-day SMA is reaching the candles, and this area is also an important support zone, so the price might create an Accumulation Zone within this box. If so, the health of the upward trend is preserved, and the price can more easily prepare itself for the next leg.
🔽 If further correction occurs and this PRZ breaks, the next price support area is $0.03294, which nearly aligns with the 0.786 Fibonacci and will be the next support area for the price. Given the break of 41.96 in the RSI, if this oscillator stabilizes below this area, the likelihood of this scenario occurring increases.
🧩 The main trigger currently for a long position is the break of $0.05284, which you can enter upon in both spot and futures as you open your position on this coin. The next trigger is $0.07756, a significant resistance and supply area, and the subsequent resistance will be at $0.09855.
📉For short positions, the best trigger currently in this timeframe is the break of the Fibonacci zone. However, by moving to lower timeframes, you can find more triggers.
📝 Final Thoughts
This analysis reflects our opinions and is not financial advice.
Share your thoughts in the comments, and don’t forget to share this analysis with your friends! ❤️
Do you need to go to the VET?I guess not because youre a human, unless youre a doge to see this. Stances marked and initial buys goes from the red box, upto you to short or wait for it to buy

Bullish/Bearish Sentiment We saw #BTC last hit it's double top 209 days after making an ATH 64k in April and topping out in Nov.
VeChain also took around 200 days to revisit higher lows.
[BULLS}
Elliot Wave Theory:
It appears that we are in the next 2-3 wave
Regardless of the narrative, the trend is showing bearish in the short term. I have HODL positions but short until we hit our buy zones keeping a close eye on what #BTC and #ETH do.
CRYPTOCAP:ETH is in a channel and appears to be falling out.
If we dig deeper watch 3k as a psychological area of support, CRYPTOCAP:BTC will be around 95k. For NYSE:VET we see $0.04 being a key level of support in our first buy zone, secondary we are looking for around $0.033.
Once these levels hold I will flip my sentiment and continue to long into this year with our bullish commander and chief stepping into office.
#Donaldtrump
If November repeats itself with this day we could be hopeful for another 300% but remain reserved with our PT's on the way up because.
"You never go broke taking a profit."
HNY #vechain fam.
Don't over-leverage, set your SL before bed.
@VEREKTION

VET: Bullish Momentum with Upside Potential🔥 Potential Price Targets for Next Month:
🩸 Near-term Goal: $0.049
🩸 Long-term Goal: $0.036
🔥 FinCaesar's Strategy:
🩸 Long: Above $0.049, targeting $0.058 and $0.065. Bullish MACD momentum and EMA support suggest continued upward movement.
🩸 Short: Below $0.036, targeting $0.030 and $0.025. A breakdown below this level would weaken bullish momentum.
🔥 FinCaesar's Commands:
🩸 Resistance: $0.058 — A critical level for the bulls to break.
🩸 Support: $0.036 — A breakdown below this could signal a shift to bearish momentum.
VeChain shows strong bullish momentum, and the indicators support further upside. A breakout above $0.049 could push the price to $0.058 and higher.
👑 "Success belongs to those who act swiftly and decisively—don’t wait for the perfect moment." — FinCaesar

VET Poised for a Symmetrical Triangle Breakout!
#VET is consolidating within a symmetrical triangle on the 4-day chart 💁♂️
The pattern suggests momentum is building for a potential bounce from the ascending support 🤔
If successful, price could rise towards targets at $0.06844, $0.08068, and $0.09291 🎯

VeChain (VET)🔍 Technical Analysis of VET/USDT
📌 Introduction to the VeChain Project:
VeChain is an advanced blockchain platform designed to enhance supply chain management and business processes. By leveraging blockchain technology 🌐 and IoT 📡, VeChain enables companies to boost transparency and efficiency in their supply chains. Its primary goals include reducing costs, improving product quality, and increasing trust in business operations.
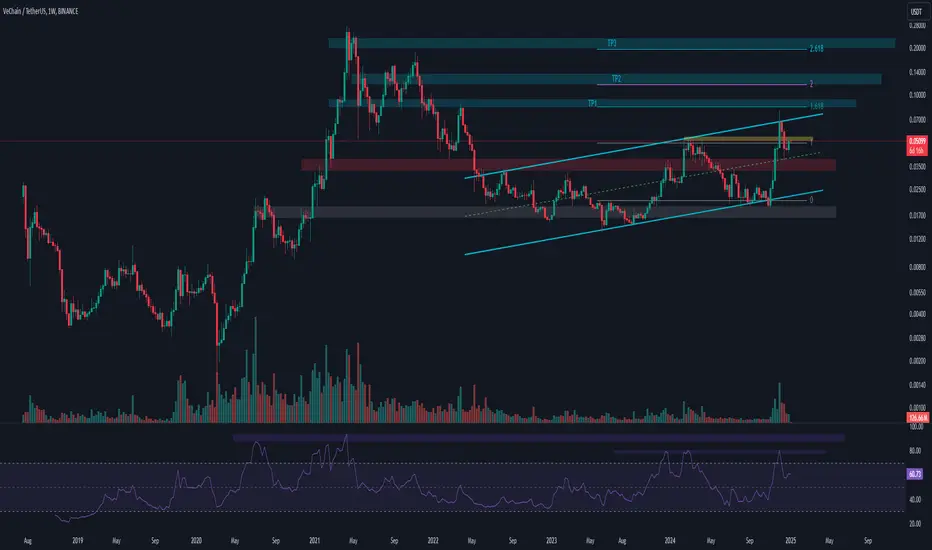
📌 General Overview:
The VET coin, a leading project in the blockchain space, is currently trading within an ascending channel on the weekly timeframe. This movement suggests a potential continuation of the bullish trend; however, key levels require close attention.
📊 Recent Price Movements:
The price recently hit the top of the ascending channel and underwent a short correction.
It is now approaching the red support zone (0.03238 - 0.03948) and the midline of the channel.
✅ Potential Scenarios:
Bullish Scenario 📈:
If the price rebounds from the red support zone, it could rally toward the channel's upper boundary.
A breakout above the ascending channel's resistance may pave the way for Fibonacci targets.
Bearish Scenario 📉:
If the red support zone breaks, the price could drop toward the channel's bottom or the gray support zone (0.01638 - 0.01966).
📍 Key Zones:
Daily Resistance (Yellow):
Range: 0.05038 - 0.05504
A breakout above this resistance on the daily timeframe opens the path toward the channel's top and higher targets.
Fibonacci Targets After Breaking the Channel's Top:
1.618 Fibonacci Level: 0.08251 - 0.09507
2 Fibonacci Level: 0.11594 - 0.13874
2.618 Fibonacci Level: 0.19679 - 0.23327
Critical Supports:
Channel's Bottom: The first significant support level.
Gray Support Zone (0.01638 - 0.01966): Acts as the final line of defense.
🛠️ Entry Strategy & Risk Management ⚠️:
Safe Entry:
Enter after the price breaks above the ascending channel and consolidates above the yellow zone.
Stop Loss:
Initially, place below the red support zone.
After breaking the channel’s top, adjust below the yellow zone.
Risk Management:
Adjust trade size based on confirmations.
Risk only 1-2% of your total capital on this trade.
📈 Confirmation Factors for the Move:
Trading Volume:
A noticeable increase in volume during the breakout of resistance or support signals a strong move.
RSI Indicator:
RSI above 60 indicates a bullish continuation.
Entry into the Overbought zone could lead to a sharp rally toward higher targets.
🚀 Conclusion 🏆:
This analysis highlights that VET is at a critical and sensitive juncture. With proper risk management and confirmation of technical signals, this coin could present exciting investment opportunities.
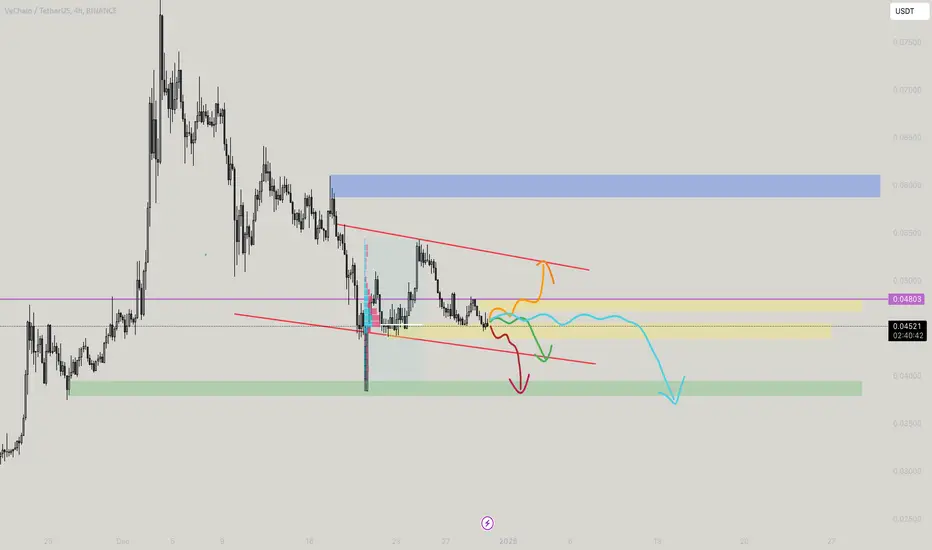
VETUSDT - Only Veterans Trade Please!VETUSDT - SO there are four possible scenarios of VET as there are tight squeeze of the yellow boxes. For TL;DR - Wait for the green box in action for clear path, For daredevils, Orange marked the scalps end to the path of the channel marked, The red marked (horizontal line) is fib pockets and would play a good role here. The cyan line marked shows if tight buyers and sellers in action, expect strong attraction to 0.4534. and eventually bleed, Green shows normal fall till the red line to retest if following channels, and my most loved green box is what i wait because DOM is stacked for the orders to filled. The blue box is a point if green line gets bonked aim for the targets on it.