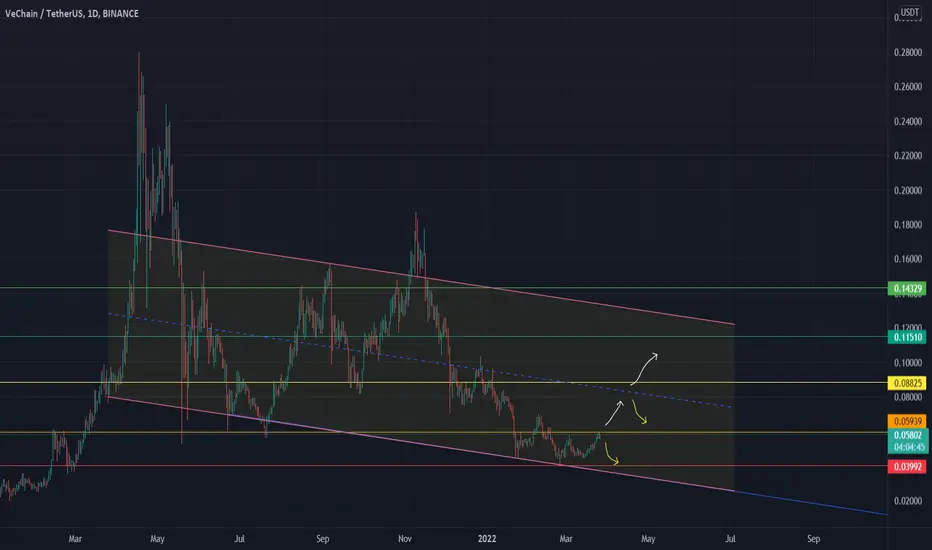
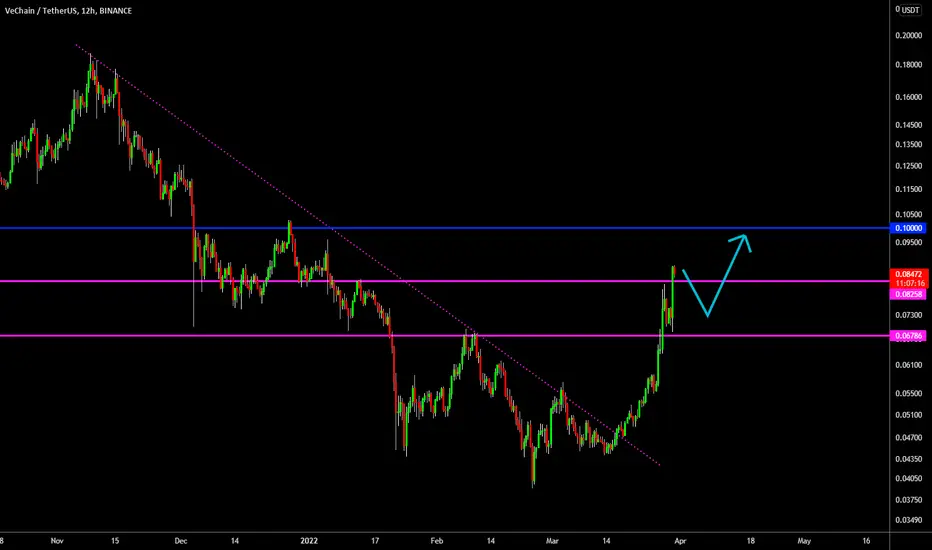
VET Sign of Strength RallyThe VET price had been observed in a horizontal re-accumulation trading range from Jan 22, 2022 to Mar 27, 2022. The VET price exited this re-accumulation trading range with the SOS rally.
I will make a long entry at the BU/LPS event (around $0.07) and take profit around the next resistance cluster around $0.10. The upper and lower boundaries of the re-accumulation trading range are given by the horizontal black lines.
Blue arrows mark volume spikes.
Wyckoff abbreviations: automatic rally (AR), change of character (CHoCH), sign of weakness (SOW), failed upthrust (FUT), selling climax (SC), sign of strength (SOS), back up (BU), last point of supply (LPS).
This is not financial advice. I am not your financial advisor. This is my opinion.
VETUSDT.P trade ideas

VETUSDT Update ✅If the price breaks the downward trend, i can excpect a bullish run and open the door for higher price ✅
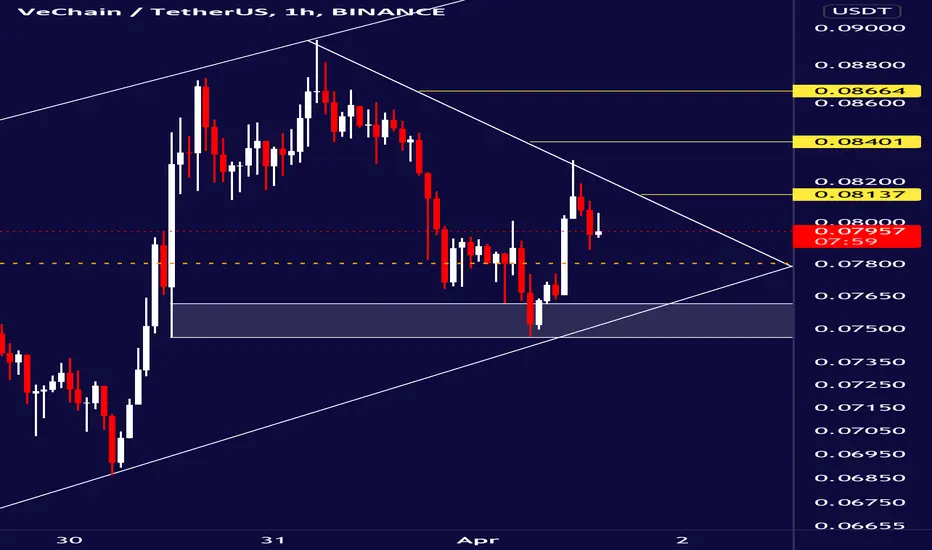
Expanding Triangle?From what I am seeing here so far it is an EXPANDING TRIANGLE. What do you guys think?
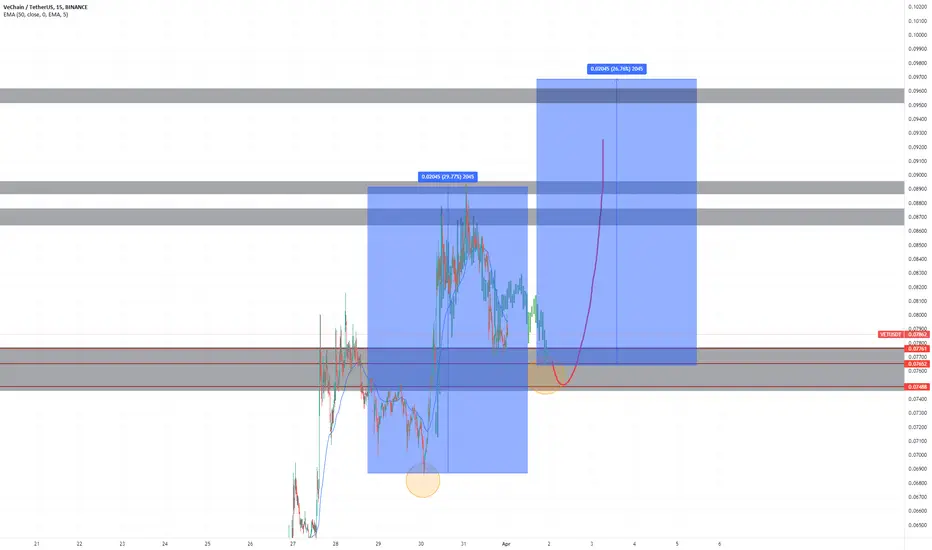
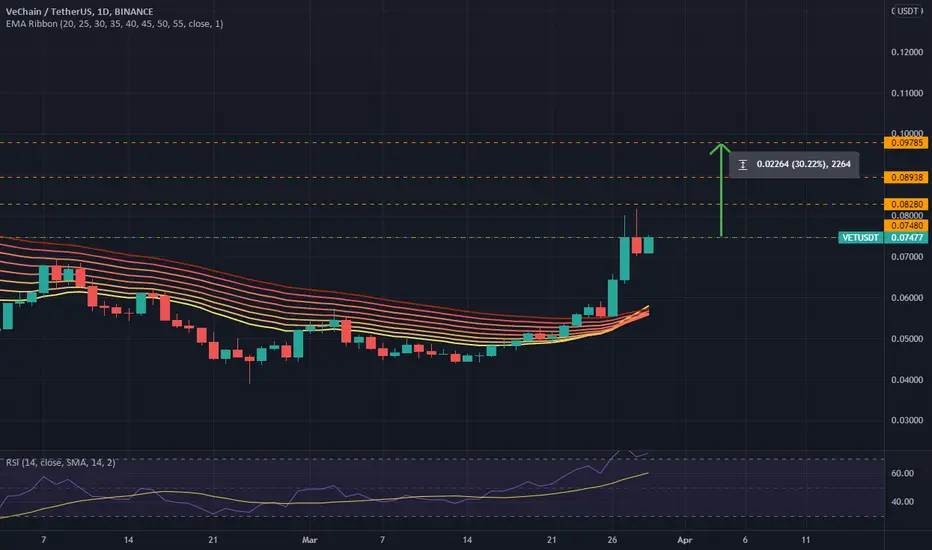
VECHAIN LONGHello everyone,
Just wanted to share this idea for a ~30%+ long opportunity on VET.
Vechain has had some good momentum.
I believe we will drop down to the area below. Catch support around 0.07488.
I will be longing with HEAVY leverage. Risk it for the biscuit.
Adios.
Aiming for 0.095
Good luck.
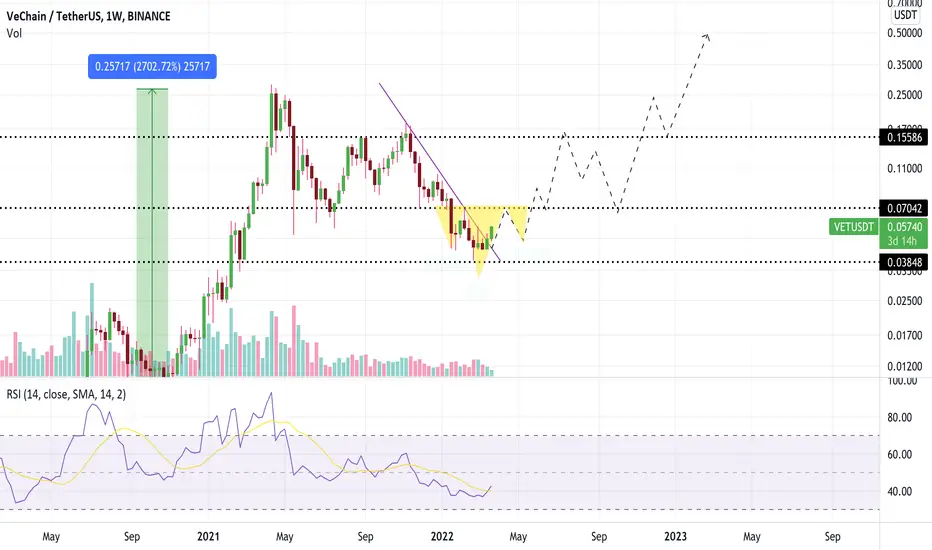
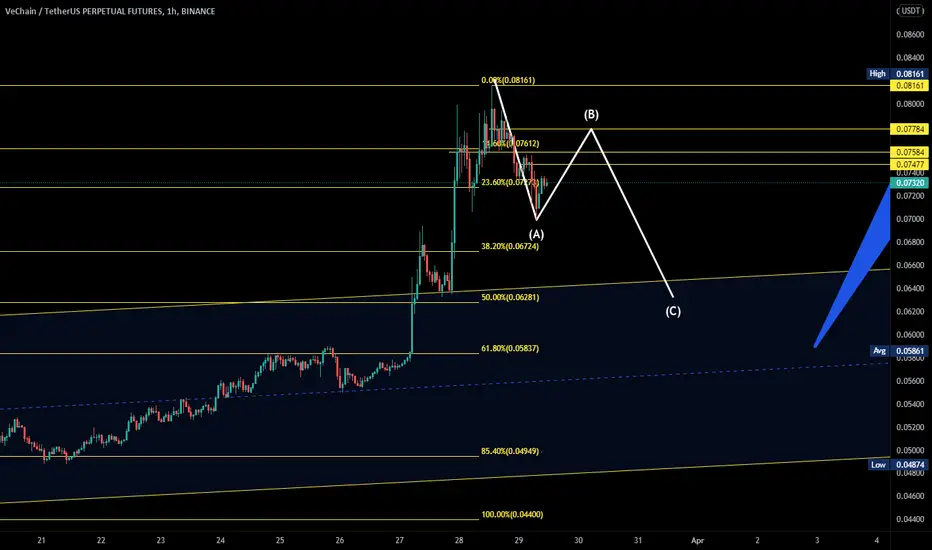
VET Price PredictionWe will see how it plays out.
Normally, 99% patterns are not being carried out.
So take this chart as a pin of salts.
It depends a lot on how Bitcoin behaves.
VETUSDT graph analysis need thoughts VET graph analysis, im a new trader and only recently started graph analysis and i am wondering if anyone could or may correct any mistakes i have done when drawing or if i am correct with the channel, support and resistance lines.
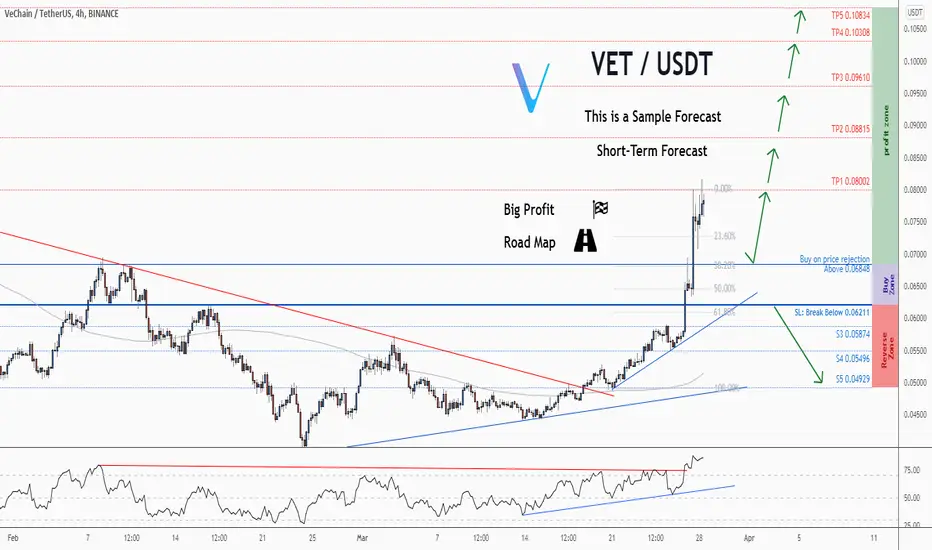
💡Don't miss the great buy opportunity inVETUSD @vechainofficialTrading suggestion:
". There is a possibility of temporary retracement to the suggested support line (0.06848).
. if so, traders can set orders based on Price Action and expect to reach short-term targets."
Technical analysis:
. VETUSDT is in an uptrend, and the continuation of the uptrend is expected.
. The price is above the 21-Day WEMA, which acts as a dynamic support.
. The RSI is at 85.
Take Profits:
TP1= @ 0.08002
TP2= @ 0.08815
TP3= @ 0.09610
TP4= @ 0.10308
TP5= @ 0.10834
SL= Break below S2
❤️ If you find this helpful and want more FREE forecasts in TradingView
. . . . . Please show your support back,
. . . . . . . . Hit the 👍 LIKE button,
. . . . . . . . . . Drop some feedback below in the comment!
❤️ Your support is very much 🙏 appreciated!❤️
💎 Want us to help you become a better Forex / Crypto trader?
Now, It's your turn!
Be sure to leave a comment; let us know how you see this opportunity and forecast.
Trade well, ❤️
ForecastCity English Support Team ❤️
💡Don't miss the great buy opportunity inVETUSD @vechainofficialTrading suggestion:
". There is a possibility of temporary retracement to the suggested support line (0.06848).
. if so, traders can set orders based on Price Action and expect to reach short-term targets."
Technical analysis:
. VETUSDT is in an uptrend, and the continuation of the uptrend is expected.
. The price is above the 21-Day WEMA, which acts as a dynamic support.
. The RSI is at 85.
Take Profits:
TP1= @ 0.08002
TP2= @ 0.08815
TP3= @ 0.09610
TP4= @ 0.10308
TP5= @ 0.10834
SL= Break below S2
❤️ If you find this helpful and want more FREE forecasts in TradingView
. . . . . Please show your support back,
. . . . . . . . Hit the 👍 LIKE button,
. . . . . . . . . . Drop some feedback below in the comment!
❤️ Your support is very much 🙏 appreciated! ❤️
💎 Want us to help you become a better Forex / Crypto trader ?
Now, It's your turn !
Be sure to leave a comment; let us know how you see this opportunity and forecast.
Trade well, ❤️
ForecastCity English Support Team ❤️

VET/USDT ChartHi, I try to post often so if you could follow and like it would mean a lot to me.
VET is looking really good in the mid/long term. However in the short term I am kinda bearish because we have a bearish divergence in the 4H chart. BTC is also showing signs of weakness so that is a factor that can make altcoins bleed. I still believe that after we hit the support level we we will bounce. Comment what you think.
I haven't been posting lately because I am busy with IRL stuff, so I apologise for that. I don't know if I can stream tomorrow or on the next week so I am also sorry for that. I will try to be more consistent in posts next week.
VETUSDT TO THE MOON?1D Timeframe
Trade at your own risk
Leverage: 10-15x only
Plan your entry and stoploss!!
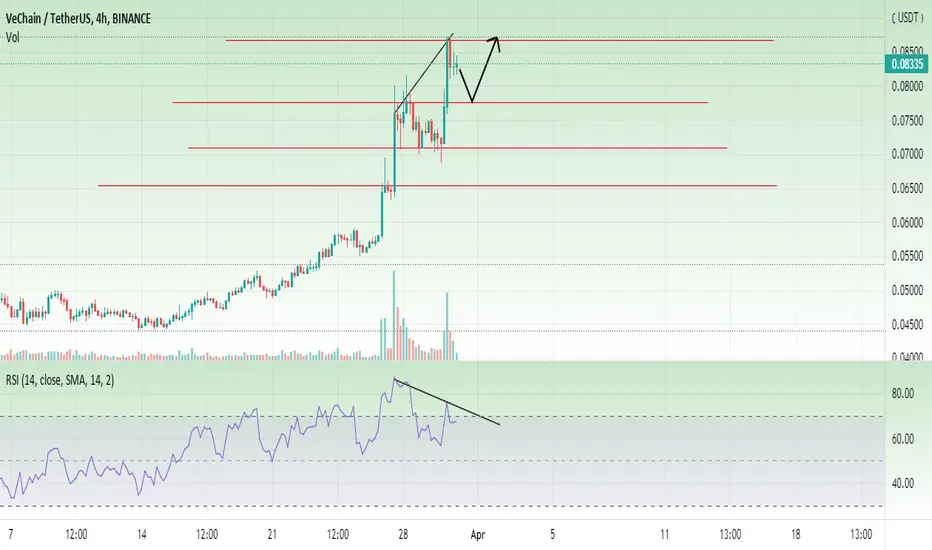
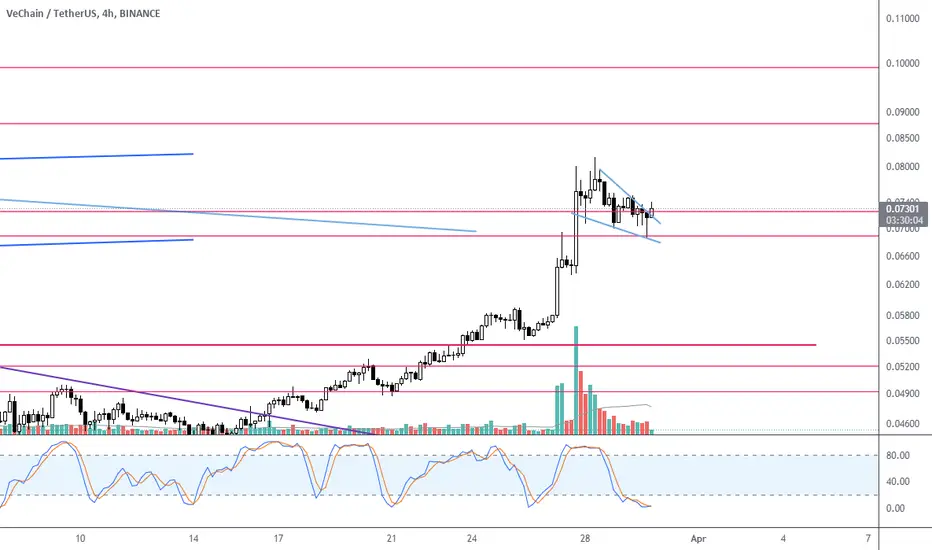
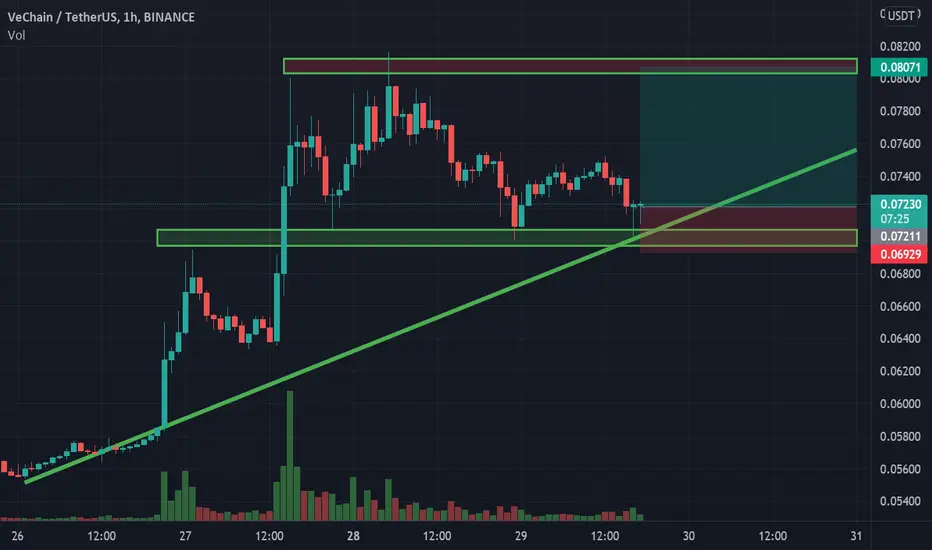
🔥 VET Huge Break Out: Parabolic Price ActionAround a week ago I made an analysis on VET where I discussed the bullish break out through a bear market trend line. Since then, VET has gained around 40% in value. Congratulations if you took the trade.
With most indicators severely overbought, I think we're going to see some consolidation on the chart. Naturally, I'm still very bullish, but we need to cool off a little after several days of huge gains.
I'm scouting an entry inside the area between the two last targets. If we're reaching hourly oversold levels, we might've found a lower high and resume the bullish move. Target placed at $0.1
Happy trading!
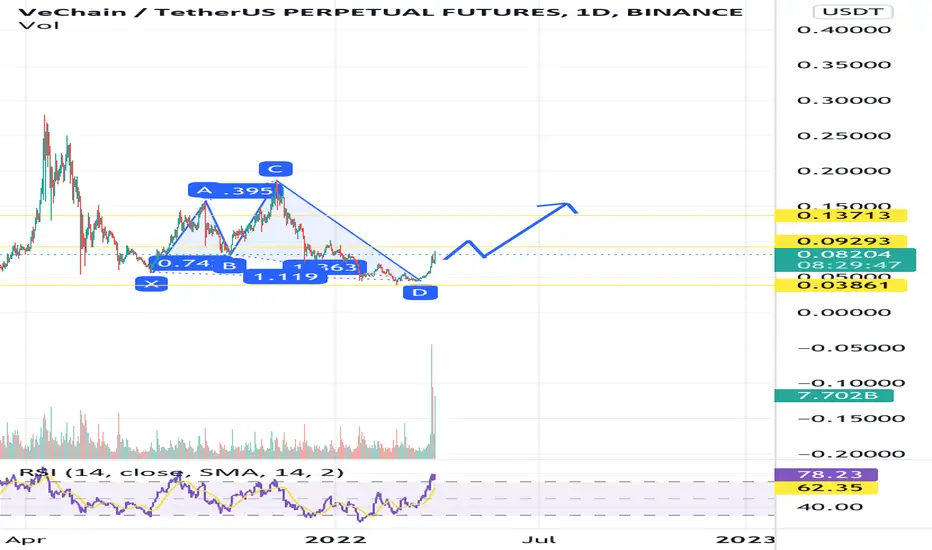
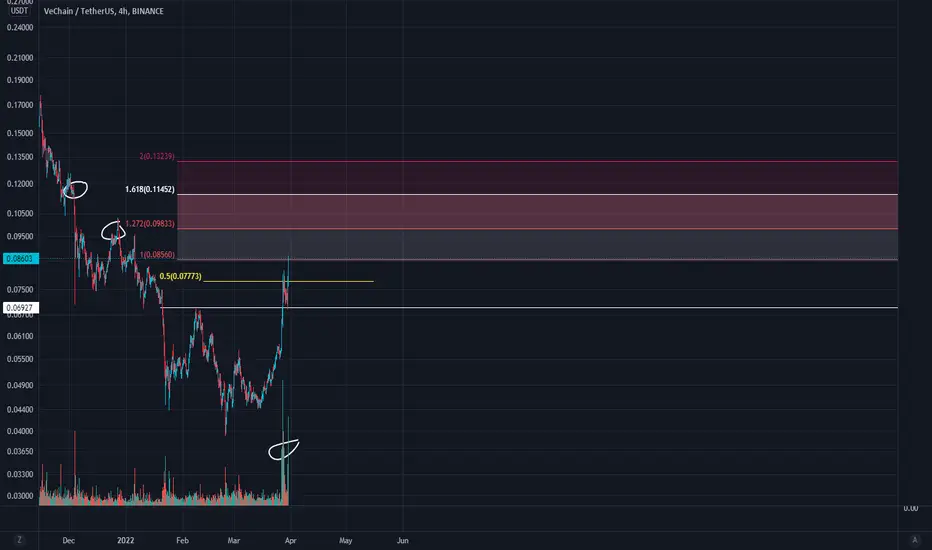
VET SwingApprox 36% gain from current PA to 1.618 Fibonacci
Target Price Limit Sell: .1138 - .1314 USDT
Suggested Take Profit: 1.272 Fibonacci (.0978 USD)
Invalidation Zone: Under .0737 USDT
Please allow 2-14 days for Swing
Not financial advice, DYOR
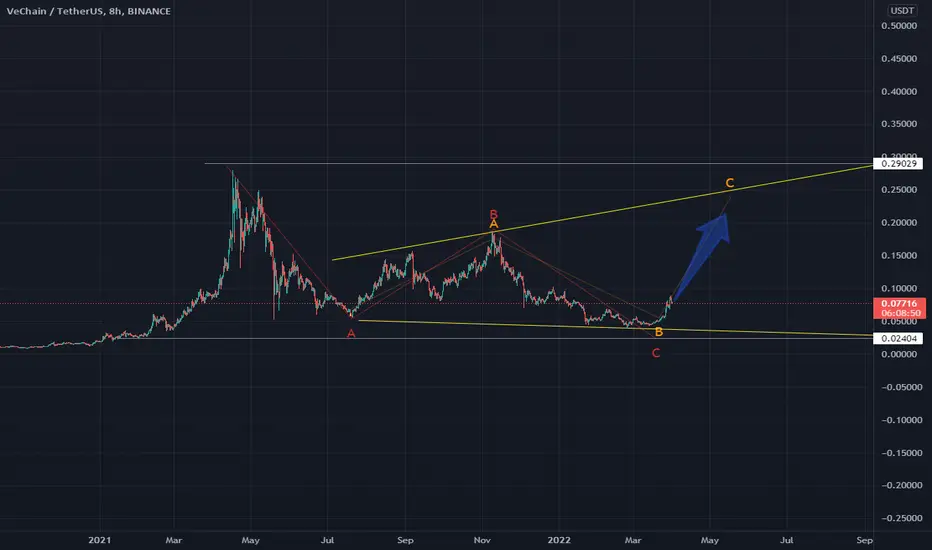
VeChain longVeChain bounced off the support level. Asset broke trough off the descending trendline and resistance level. Bullish movement to resistance level at 0.102 is possible. If the next resistance level will be broken up the VeChain is supposed to reach 0.125.

VETSalaam
Happy Norouz again.
Hope have happy new year's holidays!
VET seems strong after good rally in less than 20 days.
I'm waiting for some retrace but it makes a falling wedge in 1h time frame.
The next resistance is 0.087 that will make a 20% gain.
Let's see,
Manage the risk even in the strongest markets!
Good luck,
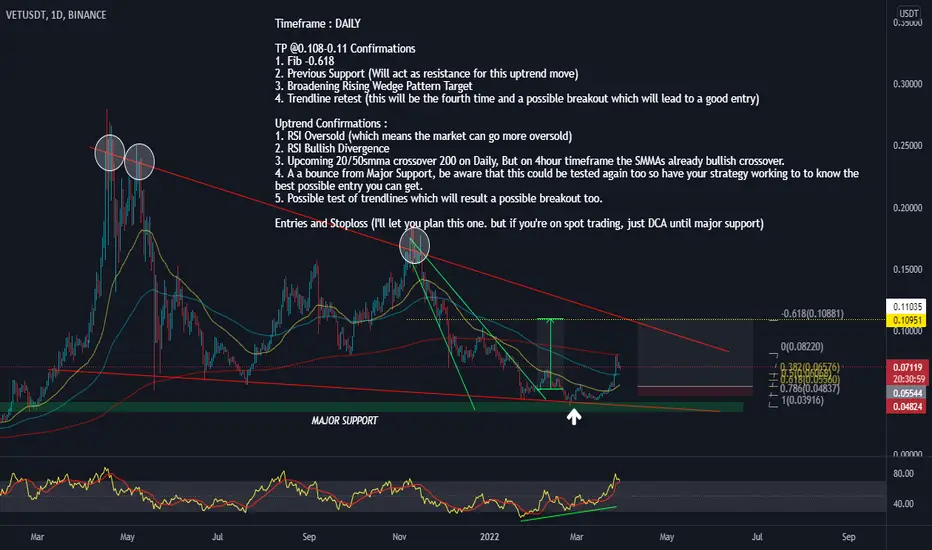
VETUSDT (BULLISH)Timeframe : DAILY
TP @0.108-0.11 Confirmations
1. Fib -0.618
2. Previous Support (Will act as resistance for this uptrend move)
3. Broadening Rising Wedge Pattern Target
4. Trendline retest (this will be the fourth time and a possible breakout which will lead to a good entry)
Uptrend Confirmations :
1. RSI Oversold (which means the market can go more oversold)
2. RSI Bullish Divergence
3. Upcoming 20/50smma crossover 200 on Daily, But on 4hour timeframe the SMMAs already bullish crossover.
4. A a bounce from Major Support, be aware that this could be tested again too so have your strategy working to to know the best possible entry you can get.
5. Possible test of trendlines which will result a possible breakout too.
Entries and Stoploss (I'll let you plan this one. but if you're on spot trading, just DCA until major support)
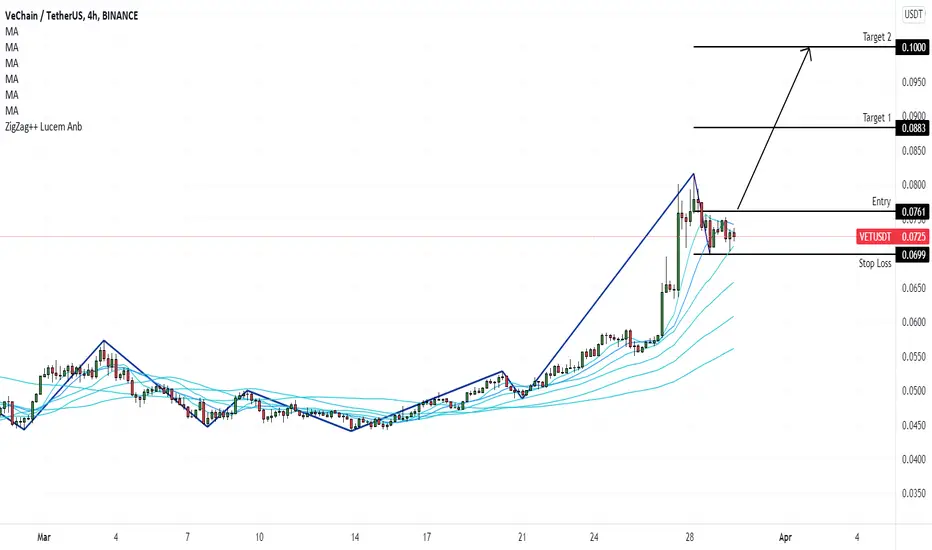
VETUSDT (4H) Bullish Wave We2Hi Traders
VETUSDT (4H Timeframe)
A high probability, entry signal to go LONG will be given with the upward break of $0.076 after the market found support at $0.070. Only the downward break of $0.070 would cancel the bullish scenario.
Trade details
Entry: 0.076
Stop loss: 0.070
Take profit 1: 0.088
Take profit 2: 0.100
Score: 8
Strategy: Bullish Wave We2
VET long $VETUSDT bouncing off the support level. Bullish trend is expected to continue up to resistance level st 0.08$
VET EXPLODING!Vet with some BIG ASS PUMPS! But its coming with a COST!! A big BIG BEARISH divergance on vet right now on the 1h chart! You have to be BLIND to not see it! IM SHORTING WITH LEVEAGE X15 TO 0.07 MINIMUM!

VET - Let`s go?Hey Guys, I`m a VET fan and it looks like he could make some gains today, if daddy BTC let him. What do you think?
DYOR!
Happy Trading!
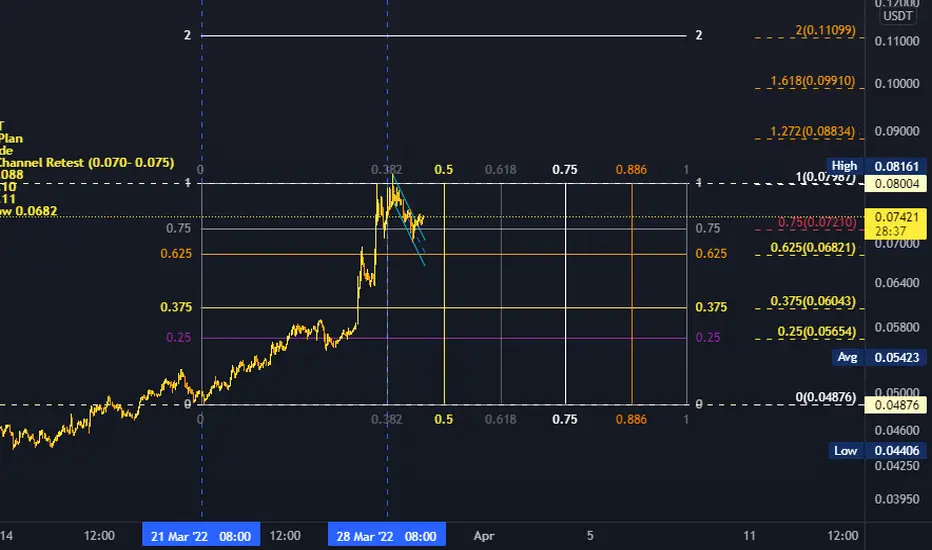
VETUSDT Buy Trade Idea No. 001VETUSDT
Trading Plan
Spot Trade
Buy on Channel Retest (0.070- 0.075)
TP 1 - 0.088
TP 2 - 0.10
TP 3 - 0.11
SL - Below 0.0682
VETUSDT Another Ready for Run SoonHi
Its me again
Here is my crazy idea on VEtusdt!
Please do check it out
Enjoy and stay safe in trading!
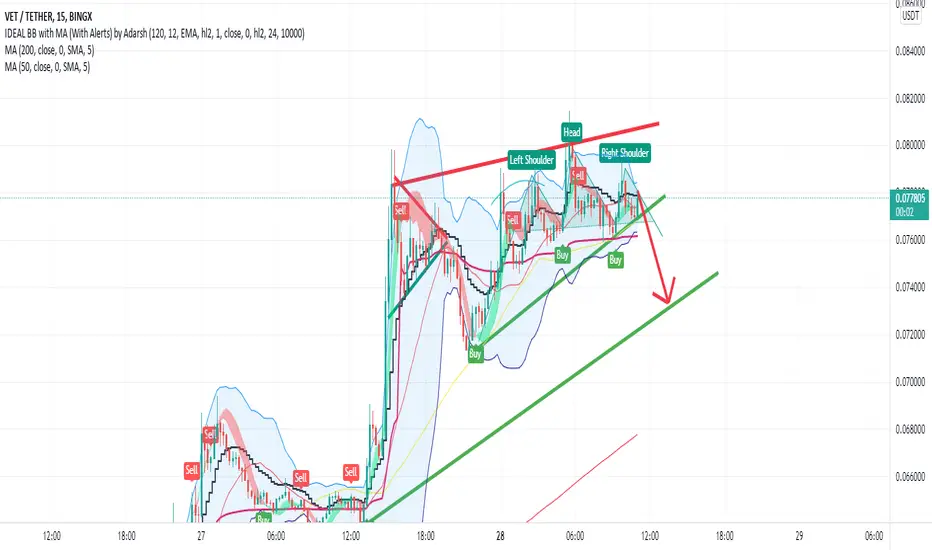
VET is looking bearish now in 15m chartI am shorting VET because of rising wedge pattern + head and shoulders pattern that potentialy can accure puting stoplose upper the red lane .
#VET broke the $ 0.07 resistance.#VET broke the $ 0.07 resistance.
It is important to close the daily candle above $ 0.07883 (EMA200).
