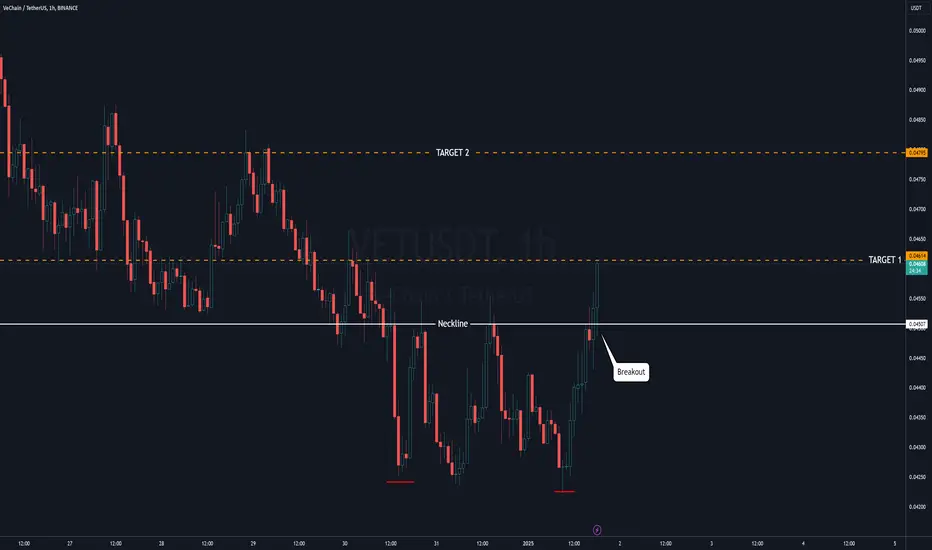
VeChain (VET) - Double Bottom BULLISHTarget Level 2= $0.04801 Incoming!!!
Breakout from a double bottom pattern formed, reversal to the upside.
VETUSDT.P trade ideas
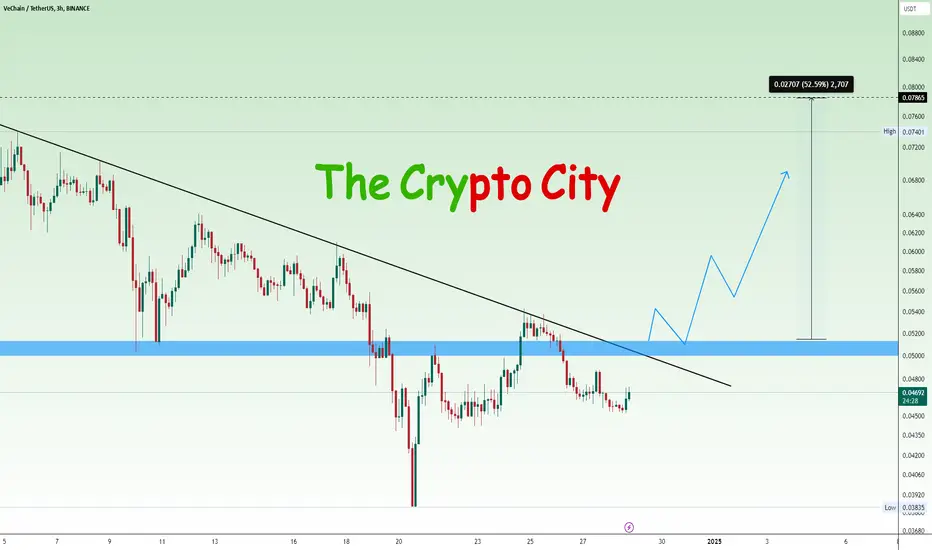
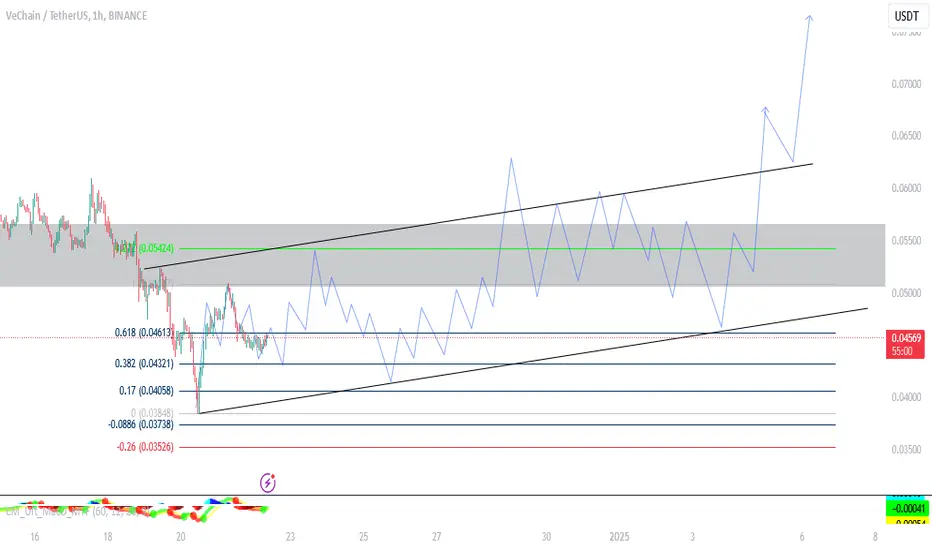
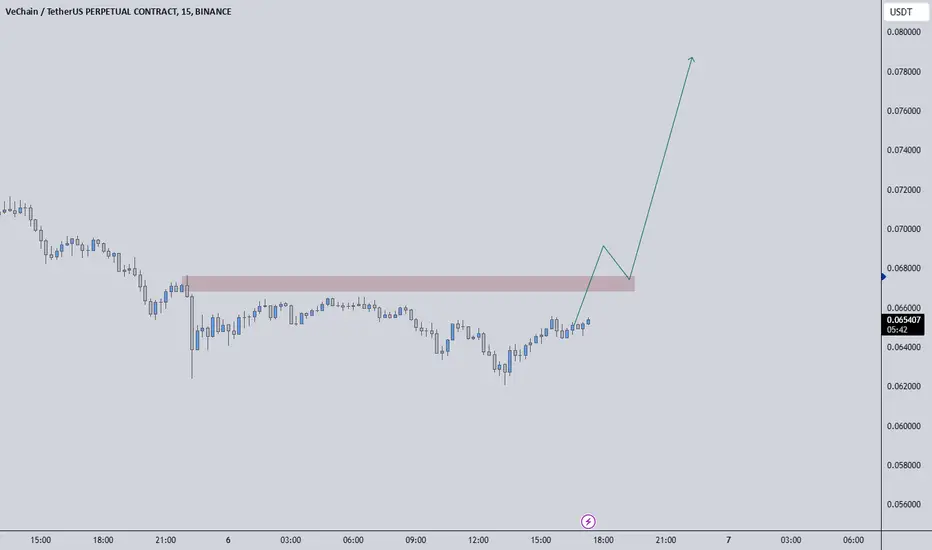
VET USDTIf the price breaks through a key resistance zone and the trend line, it could signal a strong upward trend. This momentum might drive the price towards the $0.07865 mark. The move could happen quickly, potentially within just a few days.
#VETUSDT Ready For a Pullback or Will it Slide Down Further? Yello, Paradisers! Is #VeChain gearing up for a pullback, or are we looking at a potential retracement? Let’s dive into the details of this crucial setup for #VETUSDT:
💎#VET has been trading within a broadening wedge for months, with descending resistance and support lines guiding the structure. Recently, the price broke out of the wedge’s descending resistance, marking a key technical development. However, VET saw a massive profit taking and came back for liquidity capture.
💎The immediate resistance is resting at $0.060. A clean breakout above the $0.06067 resistance, confirmed with a daily close, could trigger an aggressive bullish rally. The possible targets following this move would be $0.08000 and potentially higher. Such a rally could attract fresh buyers and propel #VETUSD into a new bullish trend.
💎On the downside, the immediate support lies at $0.03811. Beneath this level, a strong demand zone exists between $0.03119 and $0.03811, which has previously acted as a reliable area for bullish rebounds. If the price revisits this zone, it could present an excellent opportunity for buyers to step in again.
💎A daily candle close below the $0.03119 demand zone would invalidate the bullish structure. Such a move could lead to further downside pressure, with the price likely targeting the $0.02000–$0.01500 levels. This scenario would also indicate a shift toward bear control.
Stay focused, patient, and disciplined, Paradisers🥂
MyCryptoParadise
iFeel the success🌴

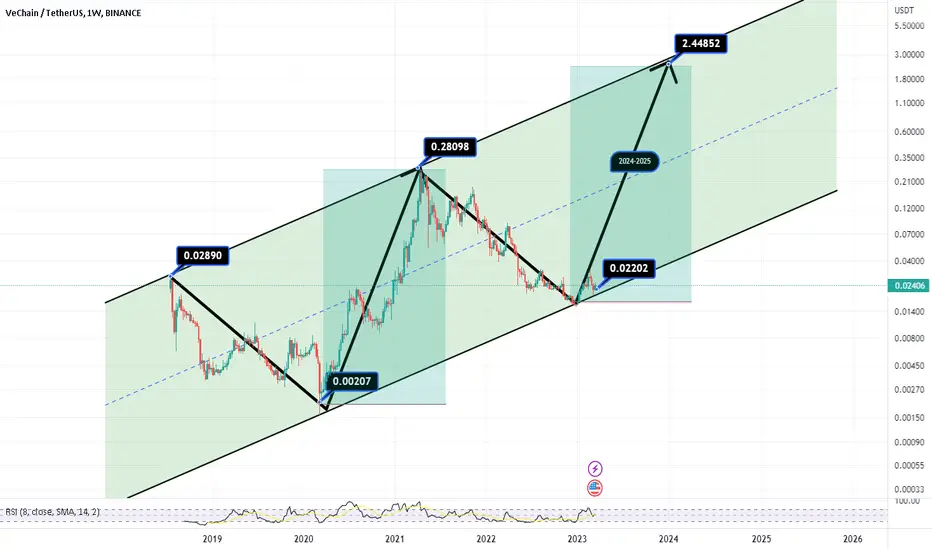
💲 vet/vechain - 2024-2025 price prediction 💲hi my friends , just look at the analyse ...
how much profit could we take ?
how much profit can we take ?
💲💲💲💲💲💲 this price prediction say it truly 💲💲💲💲💲💲💲
0.028 - 0.28 - 2.8 ...
VET in long TermMACD suggests bearish price action as BINANCE:VETUSDT takes a correction after a spike. The MACD histograms are red and shrinking. This points to a potential bullish price reversal. RSI stands neutral (43).
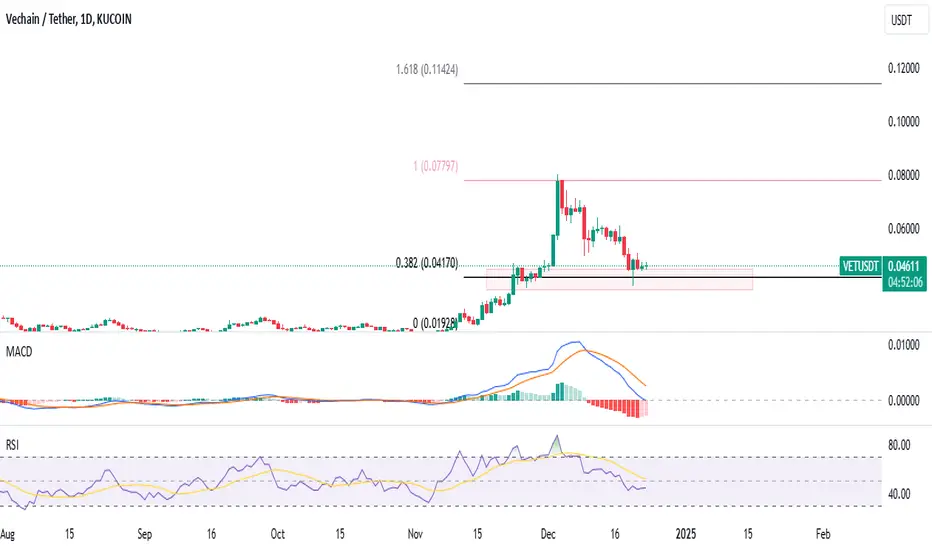
VET Mid TermFor a bullish reversal from this point, BINANCE:VETUSDT must break above the trendline resistance with a confirmation.

VET Short TermKUCOIN:VETUSDT is making lower lows in the short term as the price ranges between $0.5 and $0.44 zone.
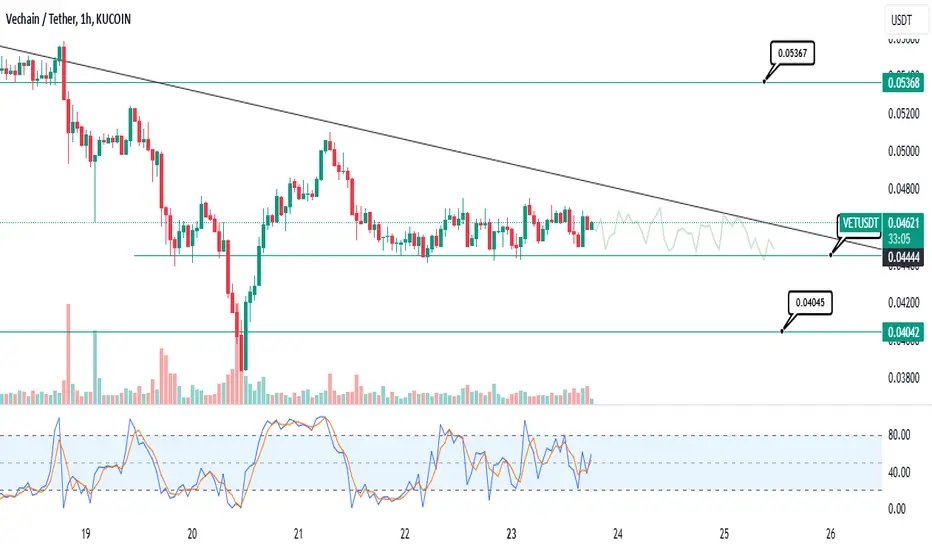
VET/USDT Potential Bottom Structure Formation ( Low Timeframe )Based on the information available, the VeChain (VET) market is currently showing mixed signals with both potential for consolidation and upward movement.
VET might undergo a period of consolidation before any significant price movement. This is supported by the view that the cryptocurrency is currently testing support zones without showing strong buy pressure, which could lead to a sideways movement or minor corrections before any breakout. This could be indicative of the market's uncertainty or waiting for further confirmation before making substantial moves.
Conversely, there are indications that if VET manages to break through certain resistance levels, a significant upward trend could follow. The breakout from a symmetrical triangle pattern on the monthly timeframe, as mentioned, could signal a shift in momentum, aiming for targets like $0.10 to $0.16. This suggests that once the consolidation phase resolves, VET could experience a parabolic rise due to pent-up demand and market dynamics shifting towards bullish sentiment.
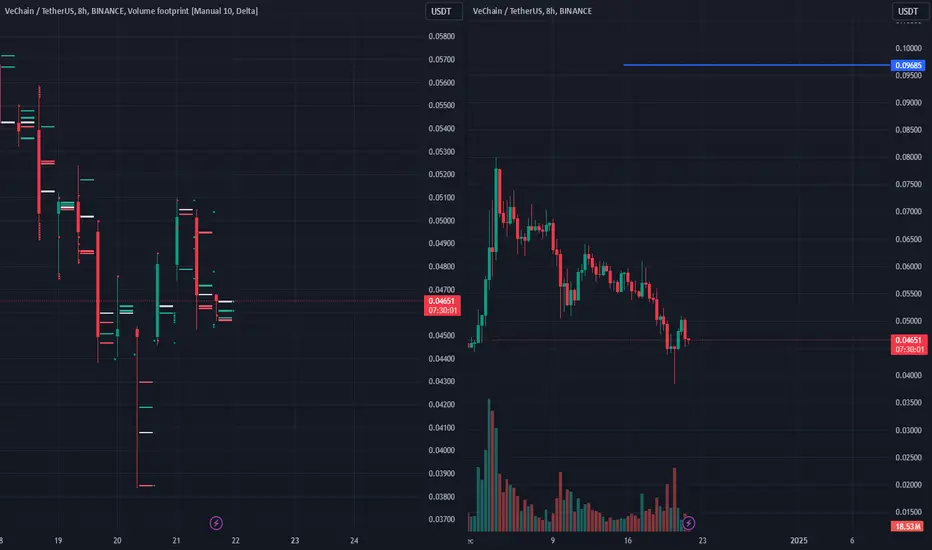
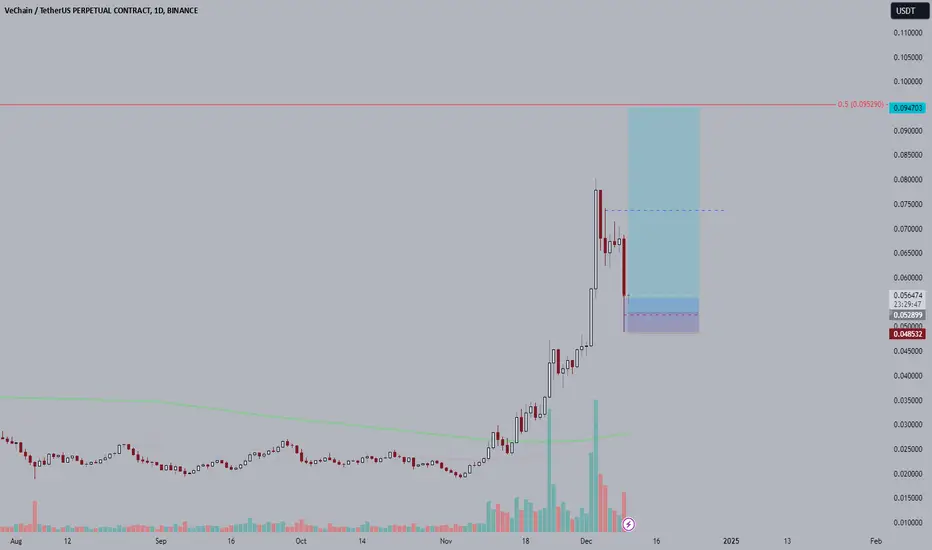
SPOT VET LONG 21.12.2024Fixation after abnormal activity.
🎯Purpose:
0.09685
‼️Risk per trade: 0.5% of the allocated funds for spot trading.
Thank you for subscribing and responding🚀.
VET Bull Run Ignites: Unstoppable Growth Ahead!VET appears poised to continue its upward momentum, driven by strong fundamentals and a thriving ecosystem. Recent price movements have been substantial, reflecting growing confidence in VeChain's potential. Historically, periods of significant upward movement are often followed by phases of consolidation, providing a foundation for sustained growth.
Looking ahead, the current uptrend seems to be in its early stages. With VeBetter playing a pivotal role as the cornerstone of the ecosystem and rapidly expanding its influence, the outlook for VeChain in 2025 remains highly optimistic. The combination of robust fundamentals and ecosystem growth suggests a promising future for NYSE:VET and its stakeholders.
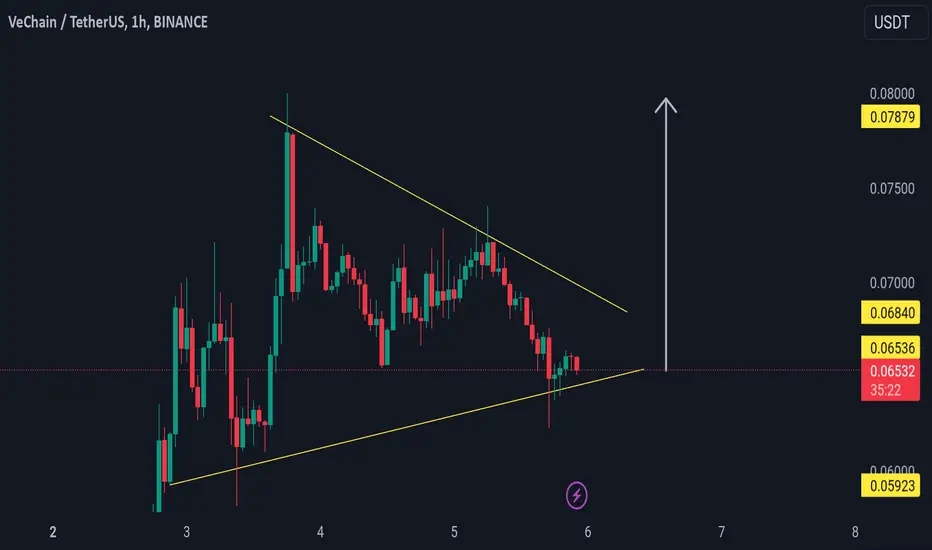
#VET/USDT Ready to go up#VET
The price is moving in a descending channel on the 1-hour frame and sticking to it well
We have a bounce from the lower limit of the descending channel, this support is at 0.04900
We have a downtrend on the RSI indicator that is about to be broken, which supports the rise
We have a trend to stabilize above the moving average 100
Entry price 0.05160
First target 0.05317
Second target 0.05633
Third target 0.06000

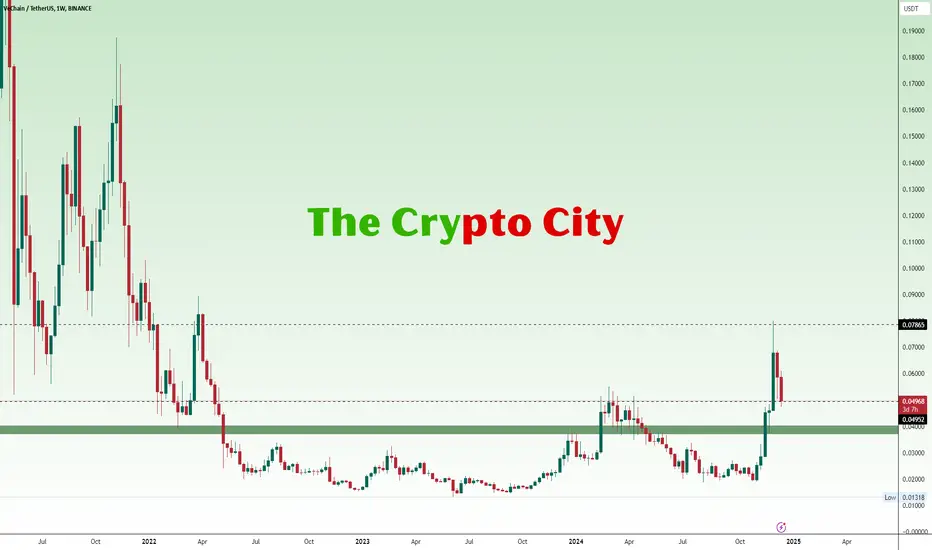
VETUSDT 1WVET Update ~ 1W
#VET If you still have Conviction on this coin,. Buy gradually within this support block,. This coin is still in a very bullish trend.
VET/USDTKey Level Zone : 0.04778-0.05405
HMT v1.0 detected. The setup looks promising, supported by a previous upward/downward trend with increasing volume and momentum, presenting an excellent reward-to-risk opportunity.
HMT (High Momentum Trending):
HMT is based on trend, momentum, volume, and market structure across multiple timeframes. It highlights setups with strong potential for upward movement and higher rewards.
Whenever I spot a signal for my own trading, I’ll share it. Please note that conducting a comprehensive analysis on a single timeframe chart can be quite challenging and sometimes confusing. I appreciate your understanding of the effort involved.
If you find this signal/analysis meaningful, kindly like and share it.
Thank you for your support~
Sharing this with love!

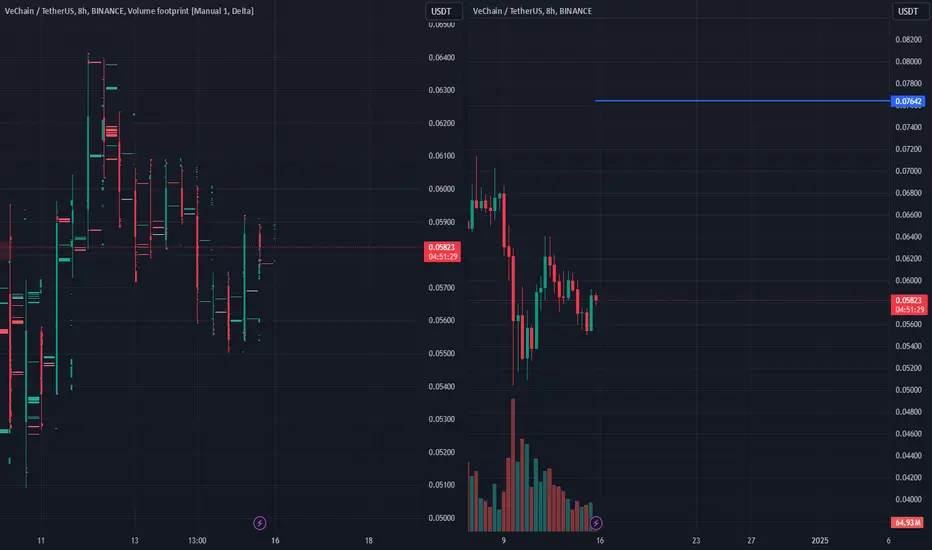
SPOT VET LONG 15.12.2024🎯Purpose:
0.07642
‼️Risk per trade: 0.5% of the allocated funds for spot trading.
Golden Opportunity for VET; Ready for Big Targets!If you're looking for a strong upward move in the crypto market, VET has reached an exciting and critical point. It seems that the B wave correction has finished, and now it's entering the C wave. It's about to face the 9 cent resistance, and if this level breaks, it could trigger a powerful rally!
🎯 Targets:
1️⃣ $0.60 (560% profit)
2️⃣ $1.50 (1550% profit)
This opportunity could bring significant gains for those who have been waiting for the right moment. Always enter with precise analysis and proper risk management.
Important note: Once 9 cents breaks, be ready to enter, but also stay cautious of any potential corrections!
With careful attention, you can take advantage of this move. Stay successful! 💪

VETLet's what happens. entry can be updated if too bullish in the coming days.
I am an amateur trader. I sometimes enter into trades. Other times it is only an analysis. Trade with your own risk awareness.
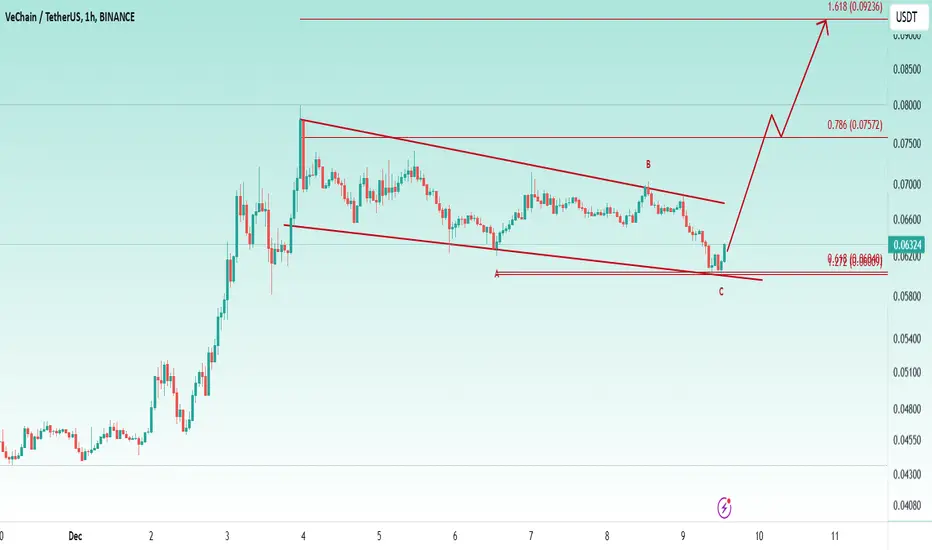
Buying Here Providing High R/R👉 The Price Perfectly Bounced From a Trend Line And The Main PRZ For Wave C, Expect a Bullish Move From Here Toward a Top Of The Bull Flag And Breakout To The 0.0757$ And 0.092$
VeChain | Massive Upside PotentialVET Previous Analyzes
Now I think another opportunity is coming.
1. Importance of the Red Box Resistance
Key Level Confirmation: If this resistance is broken with strong momentum and volume, it likely signals that VET has overcome a critical supply zone. This often serves as a launchpad for further upside.
Psychological Shift: Breaking a notable resistance can attract new buyers and trigger short covering, accelerating upward movement.
2. Entry Point and Positioning
Previous Recommendation at $0.045: Your call around $0.045 was a solid entry point in hindsight. Those who followed it are now in a position of strength.
Re-Entry Strategy: For those looking to "upload" again, targeting a pullback to support zones post-breakout (if the red box is cleared) can be an effective strategy. Use Fibonacci retracement levels or prior consolidation zones for precision.
3. Bullish Scenario Validation
Volume Confirmation: A breakout above the red box should be accompanied by significant volume to confirm the move isn't a false breakout.
Macro Factors for VET: Consider VeChain's fundamentals, such as partnerships, enterprise adoption, and developments in blockchain supply chain solutions. Positive news can fuel the rally further.
4. Long-Term Vision for VET
Next Resistance Levels: Identify key targets for profit-taking or psychological resistance zones (e.g., $0.10).
Spot Holdings Strategy: For long-term holders, accumulating in green zones while focusing on the macro bullish narrative of VET is a sound approach.
I keep my charts clean and simple because I believe clarity leads to better decisions.
My approach is built on years of experience and a solid track record. I don’t claim to know it all, but I’m confident in my ability to spot high-probability setups.
My Previous Analysis
🐶 DOGEUSDT.P: Next Move
🎨 RENDERUSDT.P: Opportunity of the Month
💎 ETHUSDT.P: Where to Retrace
🟢 BNBUSDT.P: Potential Surge
📊 BTC Dominance: Reaction Zone
🌊 WAVESUSDT.P: Demand Zone Potential
🟣 UNIUSDT.P: Long-Term Trade
🔵 XRPUSDT.P: Entry Zones
🔗 LINKUSDT.P: Follow The River
📈 BTCUSDT.P: Two Key Demand Zones
🟩 POLUSDT: Bullish Momentum
🌟 PENDLEUSDT: Where Opportunity Meets Precision
🔥 BTCUSDT.P: Liquidation of Highly Leveraged Longs
🌊 SOLUSDT.P: SOL's Dip - Your Opportunity
🐸 1000PEPEUSDT.P: Prime Bounce Zone Unlocked
🚀 ETHUSDT.P: Set to Explode - Don't Miss This Game Changer
🤖 IQUSDT: Smart Plan
⚡️ PONDUSDT: A Trade Not Taken Is Better Than a Losing One
VET / USDT: rebounding towards trendline resistance VET/USDT: Rebounding Toward Trendline Resistance – Breakout Ahead?
VET/USDT is showing promising signs 📈 as it rebounds from a strong support level, making its way toward a critical trendline resistance 📊. This setup hints at a potential breakout 💥 that could pave the way for a bullish move 🚀. Stay alert for confirmation signals before taking action 👀.
Key Insights:
1. Support Bounce: VET/USDT has found solid support, fueling bullish momentum as it approaches trendline resistance.
2. Volume Watch: A surge in trading volume during a breakout will confirm buyer strength 🔥.
3. Momentum Build-Up: RSI and MACD indicators are trending upward ⚡, signaling increasing bullish pressure.
Steps to Confirm the Breakout:
Wait for a 4H or daily candle to close decisively above the trendline 📍.
Monitor for a significant volume spike during the breakout, indicating robust buying activity 📊.
A retest of the trendline as a new support will validate the breakout ✅.
Be cautious of false breakouts, such as sharp reversals or wicks above resistance ⚠️.
Risk Management Strategies:
Place stop-loss orders below the breakout zone or key support to manage risk effectively 🔒.
Ensure position sizing aligns with your trading plan 🎯.
This analysis is for educational purposes only and not financial advice. Conduct your own research (DYOR) 🔍 before making investment decisions.
XRP Momentum BREAKOUT! / Indicator Shows 3 Year HIGH on XRPHigh Followers. I like to keep things simple.
We needed this pullback as XRP has risen over 400% this year alone.
Although, checkout the momentum indicator as there is a clear breakout marking a 3 year high. Things are going to get very rocky with XRP any day now. I would not engage in day trading this asset.
I am long term bullish on XRP with an anticipated growth to $18-$22.

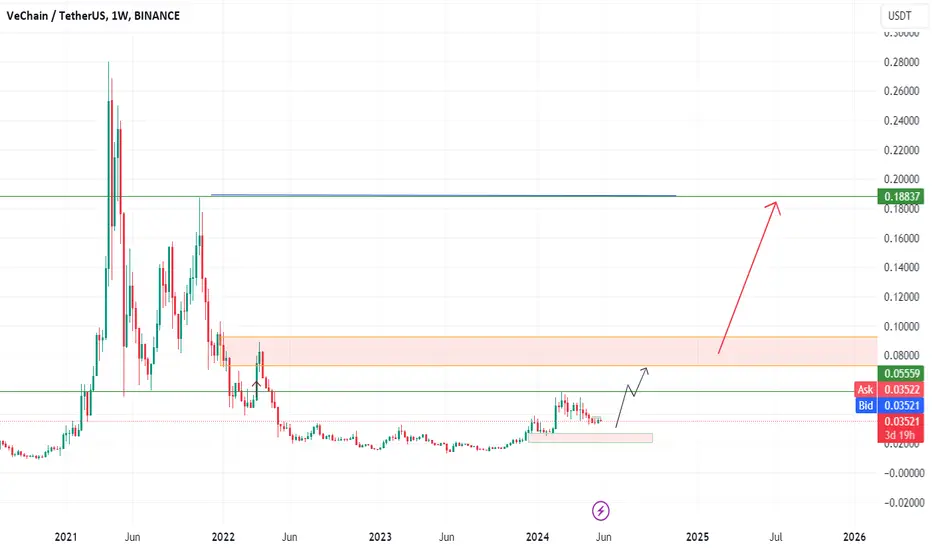
VETUSDT ---->Buy positionVETUSDT BUY position
first target 0.055 $
main long term target 0.19 (450 % profit)
don't forget money management
be profitable
Ve Chain (VET): Possible Re-Test of Broken Resistance ZoneVechain has made a good breakout on the daily timeframe, resulting in a big gap just above the broken resistance zone.
We are now looking for this zone to be re-tested and secured by buyers in order to see further movement to upper zones, which means we are looking for a slight downward movement before a bullish run on VET coin!
Swallow Team

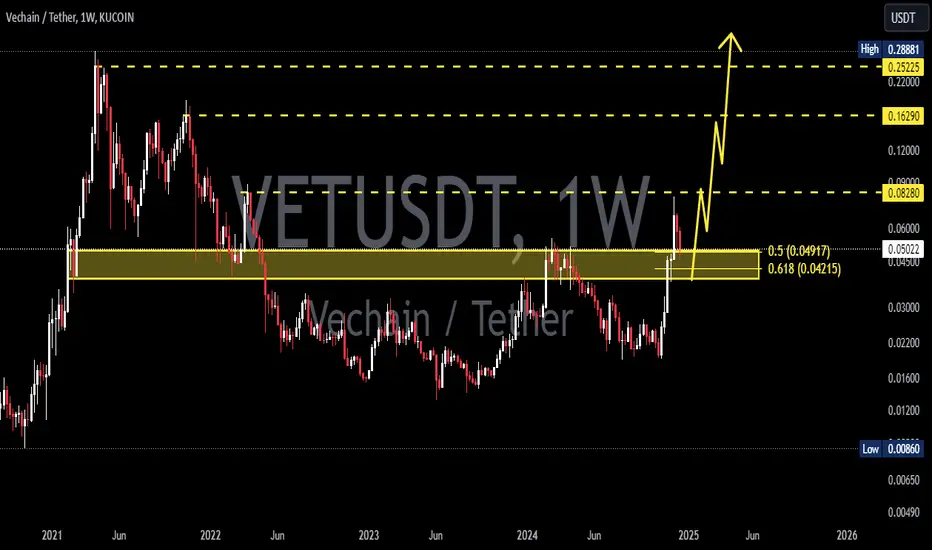
VeChain Price Analysis: Targeting $0.22 in a 32-Day CycleThis is my analysis of VeChain's price chart. I believe it will behave similarly to its performance in 2021. Over a 32-day period, I anticipate the price will rise to $0.22.
Additional Notes and Suggestions:
1. Historical Patterns:
Comparing the current price action to 2021 is a reasonable approach if there are clear similarities in volume, sentiment, and market conditions. However, ensure you evaluate the broader crypto market trends in 2024 compared to 2021 to validate this comparison.
2. Fibonacci Levels:
The chart shows strong resistance near the $0.18-$0.22 levels (Fibonacci 1.0-1.618). Monitor how price reacts to these levels, as they could either confirm the bullish breakout or signal a reversal.
The 0.786 ($0.14405) and 0.618 ($0.11635) retracement levels could act as key support zones in case of a pullback.
3. Volume and Momentum:
Look for increasing trading volume and strong bullish momentum to support your prediction. A divergence between price and volume could indicate weakening trends.
4. Risk Management:
If trading, set stop-loss levels to manage potential losses. Price could consolidate or retrace sharply, particularly if broader market conditions shift.
5. Market News:
Stay updated with any VeChain-specific announcements or partnerships. Positive news can act as a catalyst to accelerate price movement towards your target.
