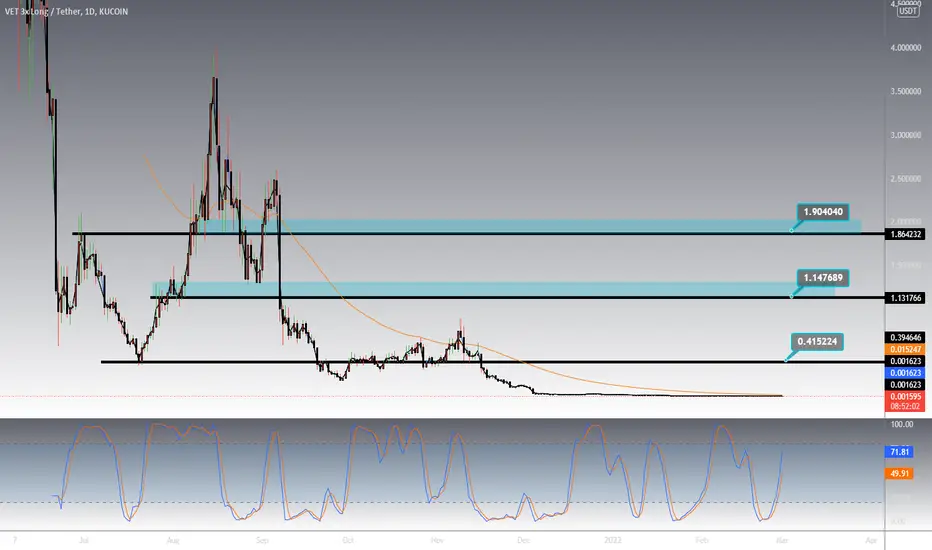
Accumulate at dirt low pricesSpotted a Macro range wont sell any till $1.9 which is top of that range
VETUSDT.P trade ideas
Inverted H&SWho else is ready for this? Looks like an Inverted Head and Shoulders is in play for VETUSD, however, it needs to cool off a bit on the LTFs before continuing imo.
Thoughts?

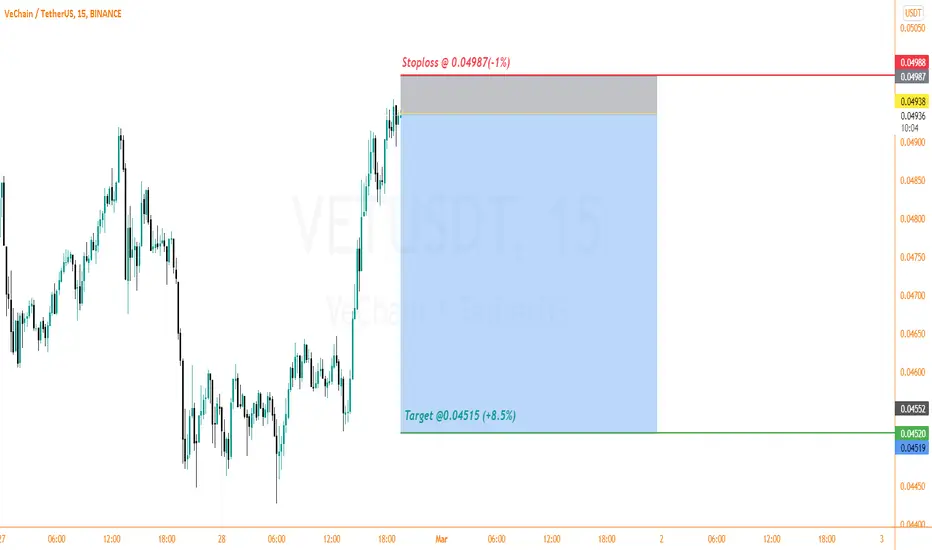
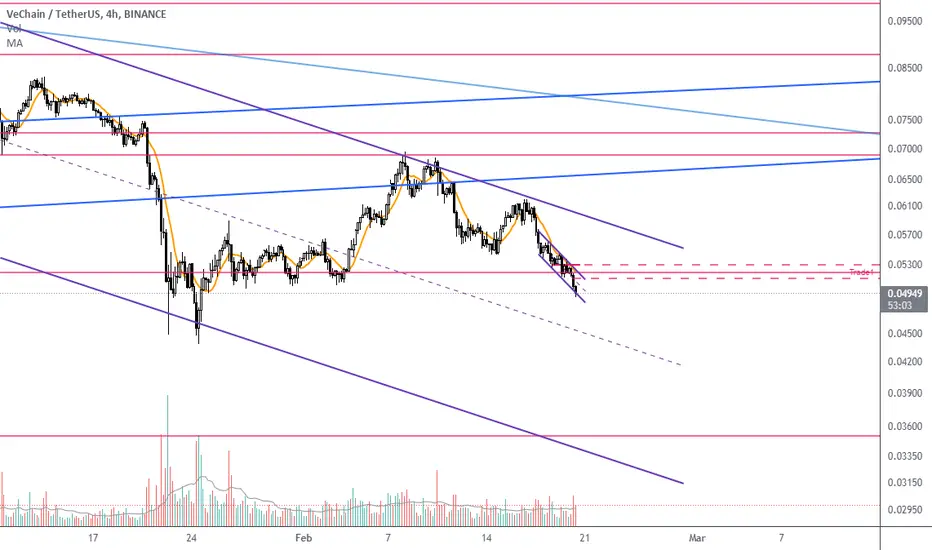
VETUSDT SellHello traders!
Looks like the Market is at the peak of this bullish move. We will see some dip in the Market.
We will not risk more than necessary.
Stoploss @ 0.04987(-1%)
Target @0.04515 (+8.5%)
Suggested leverage 20x
Don't forget to hit the like button and follow to stay connected.
VET - BUY AND HOLD.Following on from our last trade idea on VET where we were expecting more downside before the big bullrun, we are now at the perfect place to buy with very minimal downside and major major upsides!
Long Term BUY Trade idea:
- Enter with stops below the recent lows
- Target the wedge resistance as first target
- Target ATH as second target.
- HODL the rest
Goodluck!

VETSalaam
Despite impulsive downside move, I think here is good buy area.
Just above the long-term channel.
Good risk rewards
Good luck

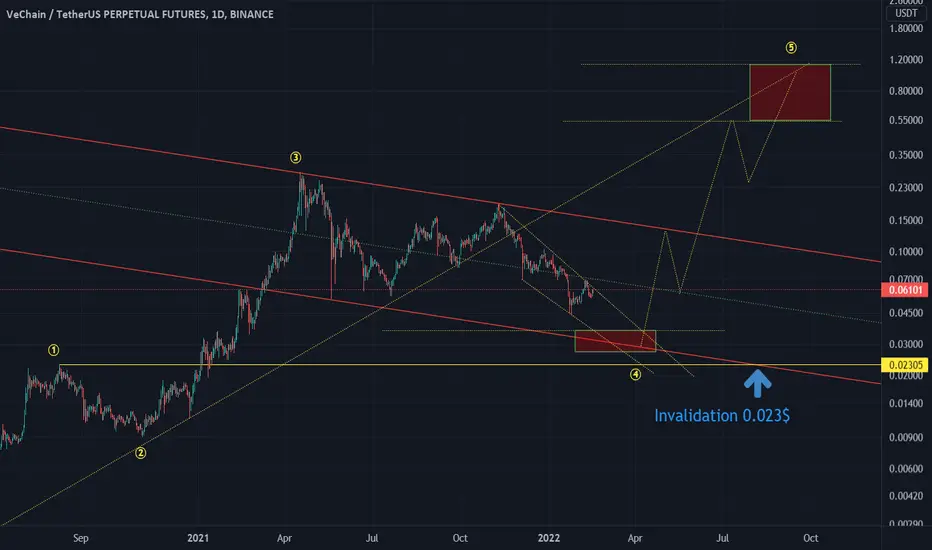
VETUSDT- Very clear 1,2,3 waves
- Still working on wave 4, accumulation zone is anything below 0.04$
- wave 5 target is above 0.5$ ( around august to September)
- Invalidation of this analysis is breaking 0.023$
Only few can detect the change of the trend. Come learn freeI detected change of trend in VETUSDT earlier ,same as in BITCOIN . Through price action and few indicators you can sniff the reversal very early.

VET/USDT 1HOUR UPDATE BY CRYPTOSANDERSWelcome to this quick VET/USDT analysis.
I have tried my best to bring the best possible outcome in this chart.
Reason of trade:- VET/USDT is a bullish falling wedge pattern conform and retest and buy the green zone
Entry:-CMP and green zone
Traget:-25% to 30%
Stoploss:- $0.04600
Remember:-This is not a piece of financial advice. All investment made by me is under my own risk and I am held responsible for my own profit and losses. So, do your own research before investing in this trade.
Happy trading.
Sorry for my English it is not my native language.
Do hit the like button if you like it and share your charts in the comments section.
Thank you...
Falling wedge on the Weekly VECHAINWe have this beautiful falling wedge on the weekly chart.
As we all know Vechain has great fundamentals but the price is falling like rain, but i think we are at the bottom, because of this falling wedge on the weekly.
I have missed the train and bull run for vechain and now i am happy to have this opportunity to buy that great project so cheap.
The price target should be at the top of the wedge which is 25 cents but i think we can go way above that if the bitcoin goes up which i think it will.
What do you think about this falling wedge?
Feel free to leave a comment.
If you like my ideas please follow me and like the post because i am posting every day and you can find always something interesting on my profile, i am new to Treadingview but i have 6 years expirience in trading.
VET TO THE MOON!

INVERSE:head & shoulderCould this be a potential inverse head and shoulders on the breakout of the short-term downtrend? Maybe time for a swing play or two?

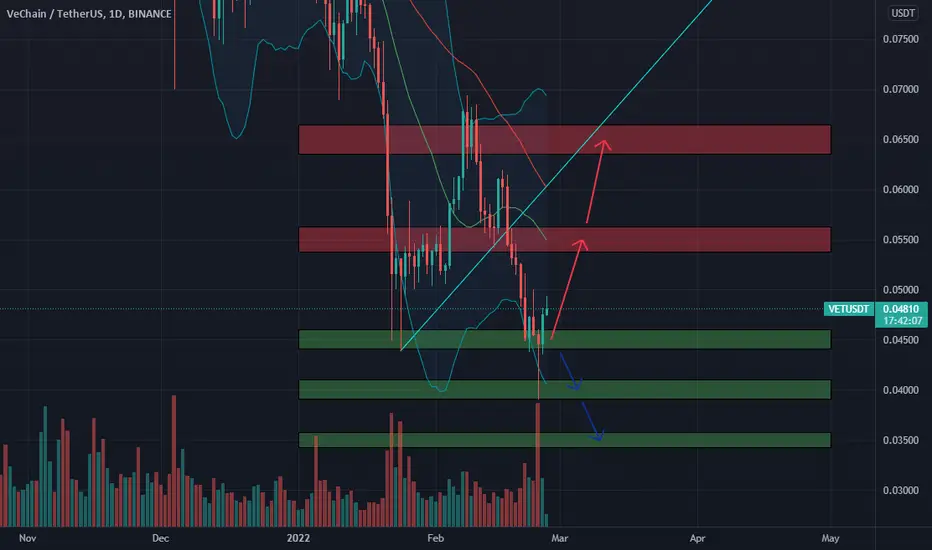
🆓VeChain (VET) Feb-26 #VET $VET
VET is still holding the $0.045 zone in the past few days, if it doesn't lose this zone, in the near future VET can rebound strongly to the $0.065 zone.
📈RED PLAN
♻️Condition : If 1-Day closes ABOVE 0.045$ zone
🔴Buy : 0.045
🔴Sell : 0.055 - 0.065
📉BLUE PLAN
♻️Condition : If 1-Day closes BELOW 0.045$ zone
🔵Sell : 0.045
🔵Buy : 0.04 - 0.035
❓Details
🚫Stoploss for Long : 10%
🚫Stoploss for Short : 5%
📈Red Arrow : Main Direction as RED PLAN
📉Blue Arrow : Back-Up Direction as BLUE PLAN
🟩Green zone : Support zone as BUY section
🟥Red zone : Resistance zone as SELL section
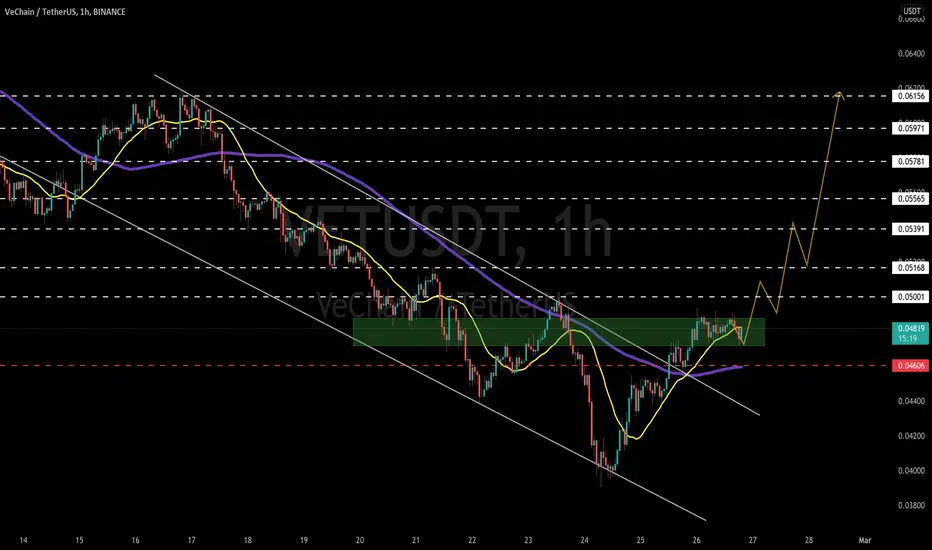
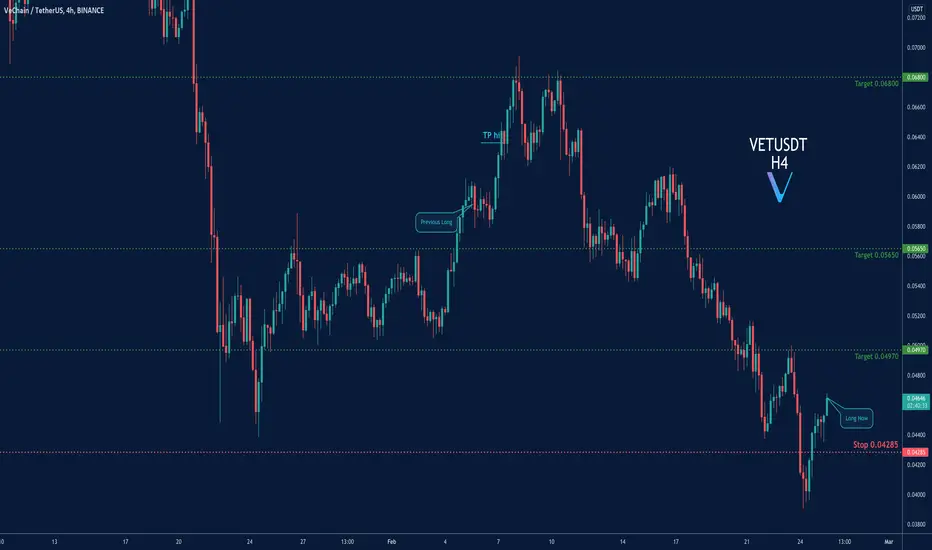
VETUSDT- Trading oppotunityThere is a trading opportunity for Long in the VETUSDT and you can long now according our trading setup.
We hope it is profitable for you ❤️
📊 VETUSDT
🔵 Long Now 0.04650
🧯 Stop loss 0.04285
🏹 Target 1 0.04970
🏹 Target 2 0.05650
🏹 Target 3 0.06800
💸Capital : 1%
Please support our activity with your likes 👍 and comments 📝
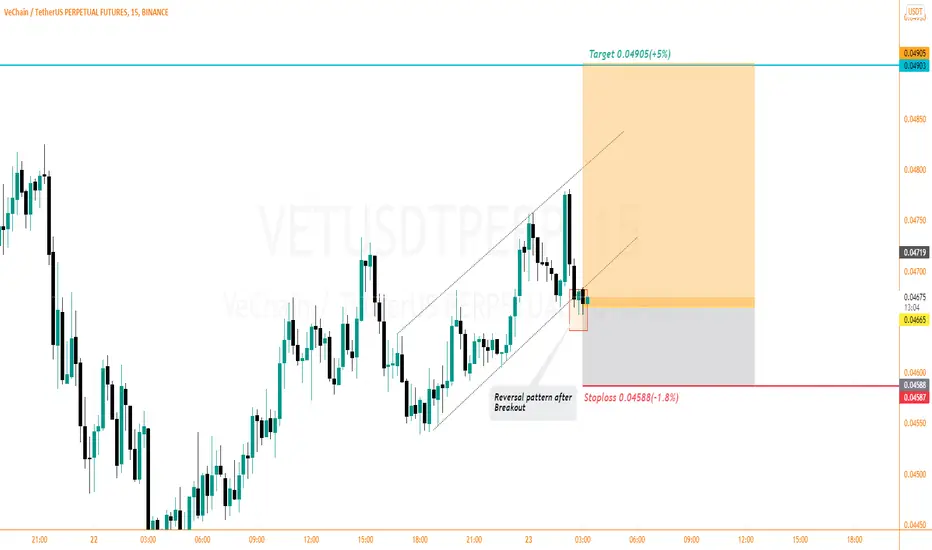
VETUSDT Buy timeHello traders!
We can see a channel breakout but it looks like the market is forming a reversal pattern after a breakout. It will push up to form new Higher highs.
Stoploss 0.04588(-1.8%)
Target 0.04905(+5%)
Suggested leverage is 10x
Don't forget to hit the like button and follow to stay connected.
VETUSDT - A move up to $0.049XXHi,
This is iJustCoin, the one lucky trader who puts money where his mouth is!
We have a nice opportunity for a high timeframe SCALPING trade on VETUSDT .
Based on the indicators we are having White/Aqua Lower as our support and Yellow Basis/White Upper as resistance.
Based on that data i am executing a LONG trade:
SL: $0.04266
Entry 1: $0.046XX
Entry 2: $0.045XX
Take Profit 1: $0.04989
Take Profit 2: $0.04788
If you didn't click Like - you should do that right now.
Feel free to ask me any question related to the idea in the comment section - i'll be glad to reply.
And make sure you smashed that SUBSCRIBE button!
Bye-bye!
Good Luck!
***
Chart Code:
Blue Bold Dotted Line - Decreasing of Selling Volume
Purple Bold Dotted Line - Decreasing of Buying Volume
Green Bold Dotted Line - Increasing of Buying Volume
Red Bold Dotted Line - Increasing of Selling Volume
Red Dashed Lines - Downwards Reversal Momentum
Green Dashed Lines - Upwards Reversal Momentum
Green Rectangle - Buying Area
Red Rectangle - Selling Area
Yellow Dotted Lines - Estimate Timerange of the price target might be getting hit
***

Vechain Will Have The Next Big Pump Cycle From Here. 0.1 TargetWe are at the end of the bear cycle for Vechain.
Support at 0.51 looks promosing. Keeping a SL at 0.49 should be a good opportunity to go long.

VETUSDT is testing an important supportThe price is testing an important support at 0.05$. if you check on the left you can see how the price respected that area, it means that this area is very strong.
The seller's pressure is strong, and if the price is going to lose the support we could see a new retest of 0.046$
How to approach?
IF the price is going to lose the support and retest as new resistance, According to Plancton's strategy , we can set a nice order
Don't forget, a simple breakdown is not enough
–––––
Keep in mind.
🟣 Purple structure -> Monthly structure.
🔴 Red structure -> Weekly structure.
🔵 Blue structure -> Daily structure.
🟡 Yellow structure -> 4h structure.
–––––
Follow the Shrimp 🦐

VETSalaam
I bought here at the support line.
and because of the good risk-reward ratio.
Let's see if it could hold this time or not!
Good luck!
VETSalaam
good entry IMO.
but 1h candle should return back above the channel.
close below the support also invalidate the setup.
Good luck
VET USDTVET good chart to make butterfly pattern and falling wedge. you can open long at good moment
VETSalaam
The total crypto market doesn't seem good at all!
VET broke important key levels clearly and most probably going to test the next support.
I open a short position below the level at about 0.05
Manage your risks and don't fear to close trades in loss!
If you are sure about breaking a level!
Update For VET/USDT Analysis 📈📉What's up guys !?
In the Last time that I had an analysis for vet/usdt it exactly hitted all of my Tps and even went beyound(<600%💰)
But actually i expected more growth for vet !
anyway so lets go a little bit deeper now
-----------------------------------------------------------------------------------------------------------------------
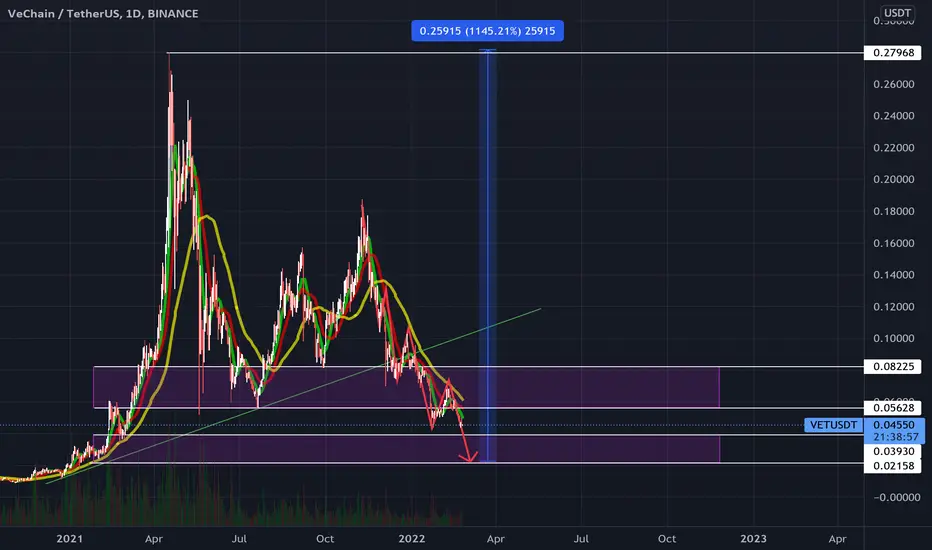
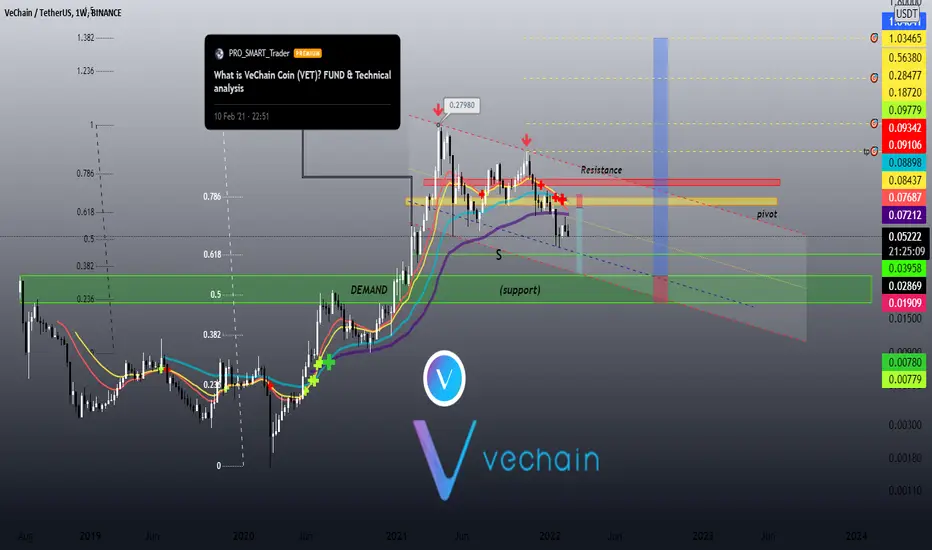
📈📉 TECNICAL ANALYSIS
As you can see on the weekly timeframe for pair of VETUSDT , Its trading about $0.052 right now .
since ATH ,VET has been declining in a descending channel , and as we can see ,
already lost an important key levels as support which is now pivot range .
so in this situation of crypto market it can go down more likely ,
and drop to the next supports and Fibo levels respectively even
to the bottom of channel on demand zone.but otherwise if it be able to jump
above the pivot zone and be closed with enough volume as confirmation it can reach
the red resistance zone in this case and then if it be able to break out the descending channel it can reach tps
🛑resistance level: 0.084$-0.094$/ 0.111$-0.123$ /trendline of channel
❇️support level: $(0.25-0.3) / fibo levels 0.0396///0.019-0.028
--------------------------------------------------------------------------------------------------------------------
👉This analysis is my personal opinion ,not a financial advice ,so do your own research.
💜 if you're a fan of my analyses PLZ follow me and give a big thumbs 👍 OR drop comment 🗯💭
🙏with Best Regards
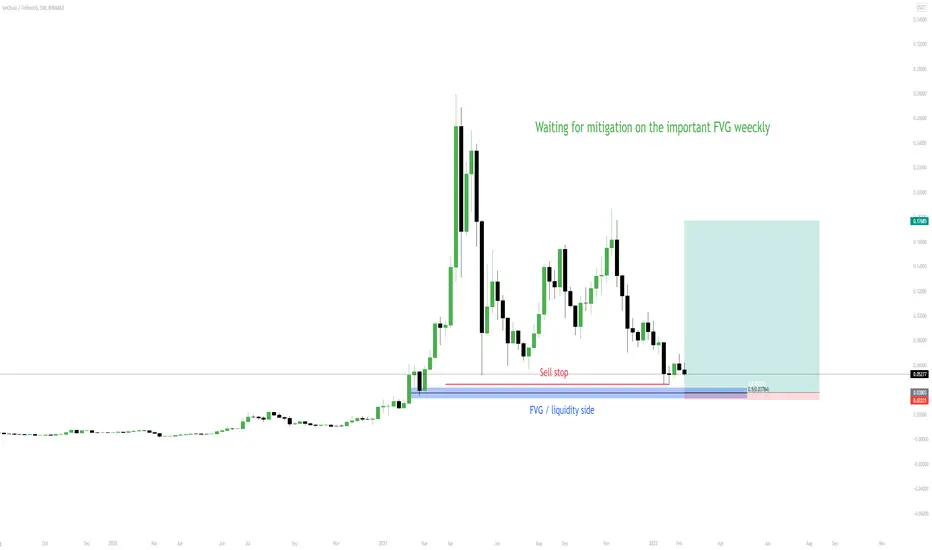
Sniper entry en VET , éducationnal onlyKeep it simple and follow the institutionnal move , they don't use trendline or any indicator . ONLY Liquidity Chase = SL retail trader