VETUSDT H2: 135% gains XABCD BEST LEVEL TO BUY(SL/TP)(NEW)Why get subbed to me on Tradingview?
-TOP author on TradingView
-2000+ ideas published
-15+ years experience in markets
-Professional chart break downs
-Supply/Demand Zones
-TD9 counts / combo review
-Key S/R levels
-No junk on my charts
-Frequent updates
-Covering FX/crypto/US stocks
-before/after analysis
-24/7 uptime so constant updates
🎁Please hit the like button and
🎁Leave a comment to support our team!
VETUSDT H2: 135% gains XABCD BEST LEVEL TO BUY(SL/TP)(NEW)
IMPORTANT NOTE: speculative setup. do your own
due dill. use STOP LOSS. don't overleverage.
IMPORTANT NOTE: always do your own due dill.
not financial advice.
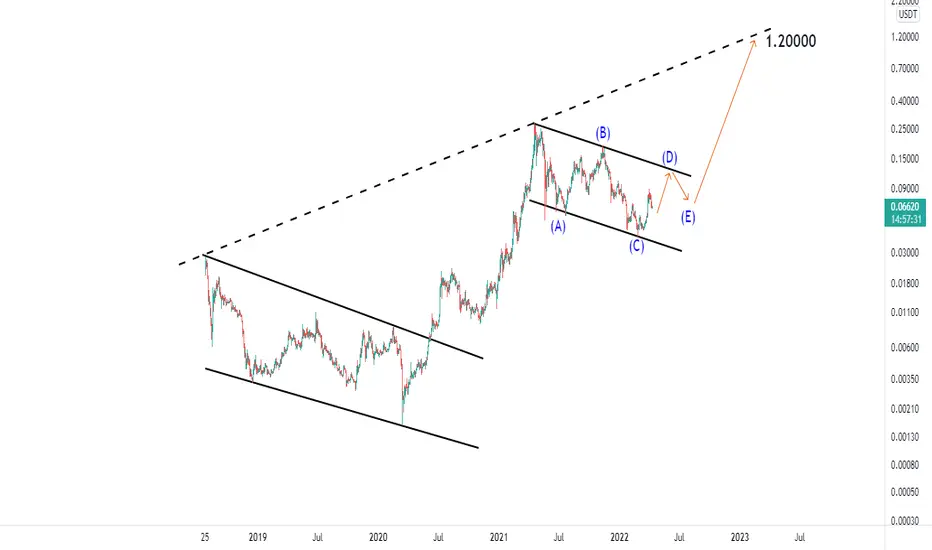
🔸 Summary and potential trade setup
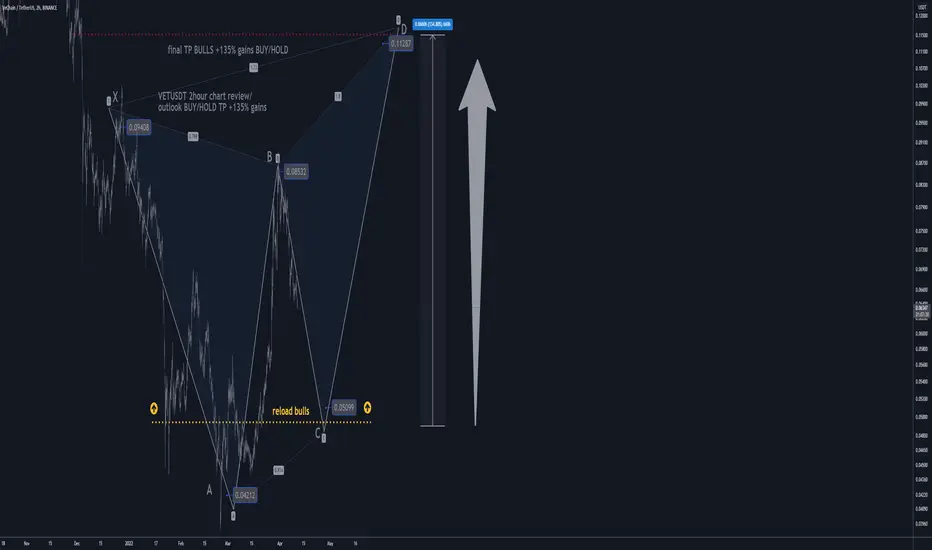
::: VETUSDT 2hour/candle chart review
::: new setup based on XABCD patter
::: still great setup for 135% gains
::: we are almost already for valid reversal
::: at point C / so it's cycle low soon
::: speculative XABCD setup in progress
::: BULLS BUY DIPS / market BUY NOW
::: from my level TP +135% gains
::: this is BUY/HOLD setup
::: patient traders only
::: not for gamblers
::: SPECULATIVE SETUP
::: do your own due dill
::: and use proper risk management
::: TP bulls is +135% gains USD
::: details: see chart
::: FINAL TP +135% gains point D
::: recommended strategy: BUY/HOLD
::: SWING TRADE: BUY/HOLD IT 0.05
::: final TP BULLS is 0.11 cents
::: bull run not over yet
::: good luck traders!
::: BUY/HOLD and get paid. period.
🔸 Supply/Demand Zones
::: N/A
::: N/A
🔸 Other noteworthy technicals/fundies
::: TD9 /Combo update: N/A
::: Sentiment mid-term: BULLS/PUMP/point D
::: Sentiment short-term: BEARS/PULLBACK/point C
RISK DISCLAIMER:
Trading Crypto, Futures , Forex, CFDs and Stocks involves a risk of loss.
Please consider carefully if such trading is appropriate for you.
Past performance is not indicative of future results.
Always limit your leverage and use tight stop loss.
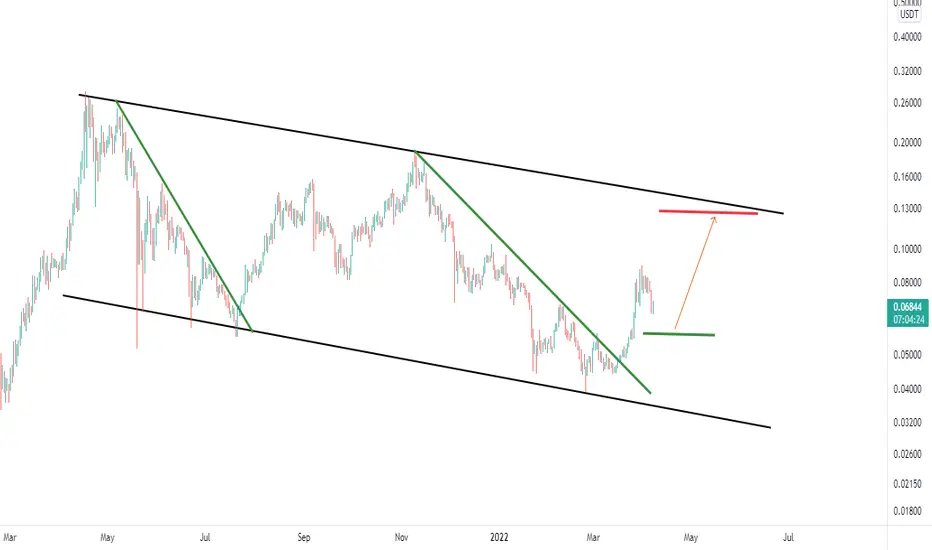
VETUSDT.PS trade ideas
VETSalaam
VET seems very good atm
Breaking the descending channel and retest.
Cup and handle pattern.
Key level as support.
Good Risk Reward
I'll also add if today's candle closes bullish.
The possible targets are 10c and 14c.
Good luck,
VeChain (VET) - April 11hello?
Traders, welcome.
If you "follow", you can always get new information quickly.
Please also click "Like".
Have a nice day.
-------------------------------------
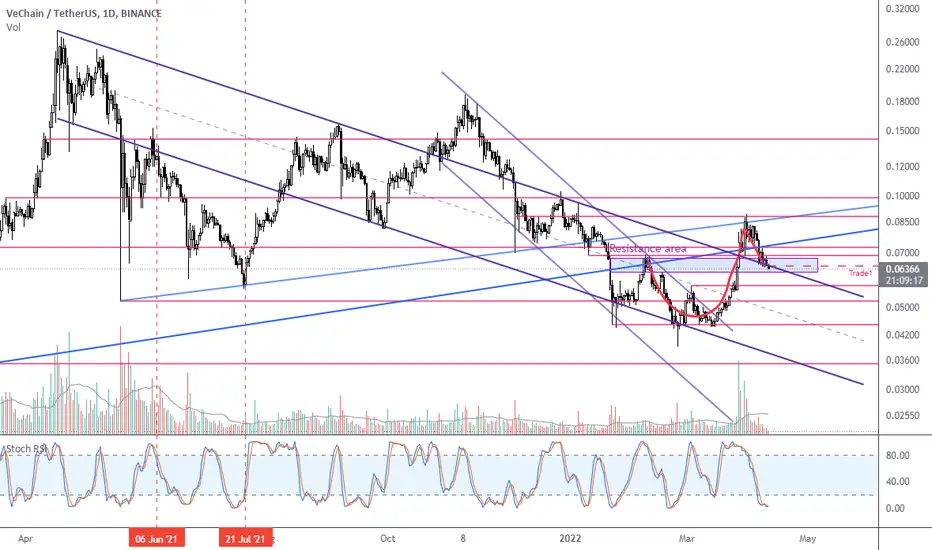
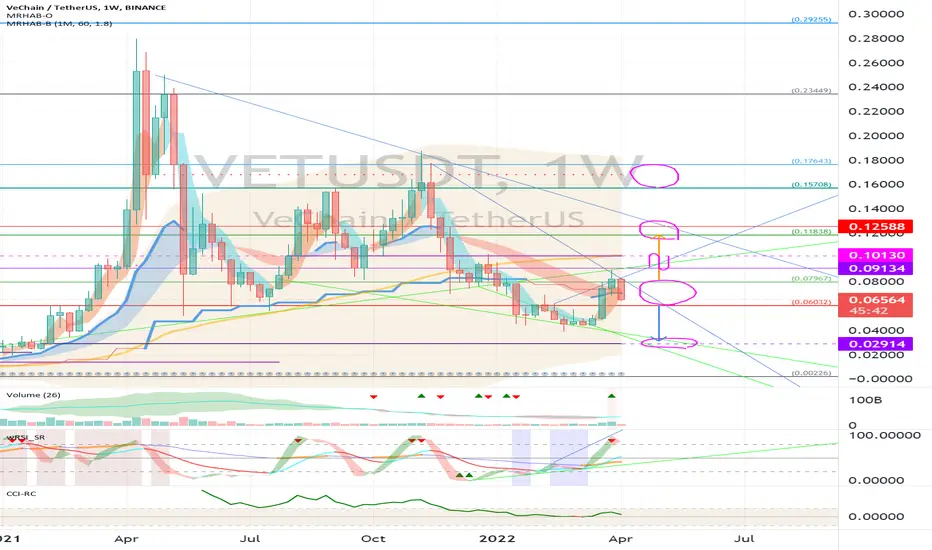
(VETUSDT 1W Chart)
Support: 0.06032-0.07967
If it falls from the support zone, there is a possibility of entering the mid- to long-term investment area, so careful trading is required.
(buy)
- After confirming the support near 0.07967
(Stop Loss)
- When it falls below 0.06032 and receives resistance
(Sell)
- When receiving resistance near 0.11838
- When resistance is received in the range 0.15708-0.17643
There is a possibility that it will swing up and down in the 0.09134-0.10130 section, so you need to trade carefully.
A move towards the 0.11838 level is expected to lead to a surge.
------------------------------------------------------------ -------------------------------------------
** All indicators are lagging indicators.
Therefore, it is important to be aware that the indicator will move accordingly as price and volume move.
However, for convenience, we are talking in reverse for the interpretation of the indicator.
** The MRHAB-O and MRHAB-B indicators used in the chart are indicators of our channel that have not been released yet.
(Since it was not disclosed, you can use this chart without any restrictions by sharing this chart and copying and pasting the indicators.)
** The wRSI_SR indicator is an indicator created by adding settings and options to the existing Stochastic RSI indicator.
Therefore, the interpretation is the same as the traditional Stochastic RSI indicator. (K, D line -> R, S line)
** The OBV indicator was re-created by applying a formula to the DepthHouse Trading indicator, an indicator disclosed by oh92. (Thanks for this.)
** Support or resistance is based on the closing price of the 1D chart.
** All descriptions are for reference only and do not guarantee a profit or loss in investment.
(Short-term Stop Loss can be said to be a point where profit and loss can be preserved or additional entry can be made through split trading. It is a short-term investment perspective.)
---------------------------------
#VETUSDT At big support.Vet/usdt at big support expect some uptrend from tomorrow. My level of taking profit is set at 0.09$. Long the dip at support prices of 0.065$. Currently I'm 5x long. Also manage your risk.
#vet #vechain #usdt #btc
VETUSDT / D1A good trend is taking shape. It has been 8 months since a flag pattern was made in the middle of the process, and after completing this pattern, it can grow to the size of a flag handle and have a return of 1000 to 2000 percent. The next 1 year is very important for this digital currency
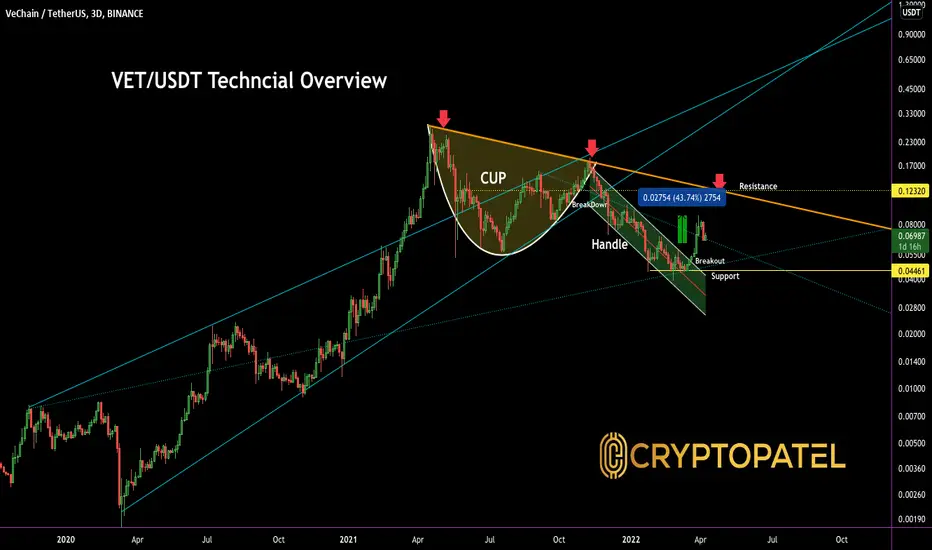
VET/USDT 43% Up from our entry and still Upward Potential#VET/USDT TA Update:-
$VET currently trading at $0.07
And went upto $0.090
#VET Gave almost 43% fromOur entry.
Hope you followed and enjoyed.
Now..?
Now Trading at support level $0.069
And If hold then we can see $0.123 Next Target.
Otherwise Good Re-Entry entry around $0.05
Support:- $0.05
Resistance:- $0.123
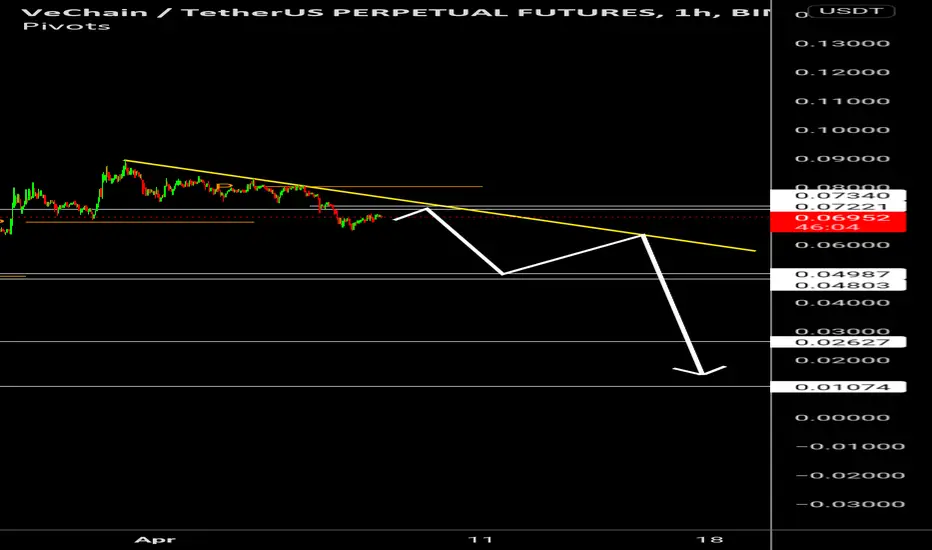
VETSalaam
VET makes a rising wedge in 1h below the 0.072 ky level.
The targets are 0.065, and 0.057.
Manage the risk,
Good luck


VETUSDTVETUSDT / 1 DAY
It has the ability to move upwards and can reach the specified goal in a period of 2 months
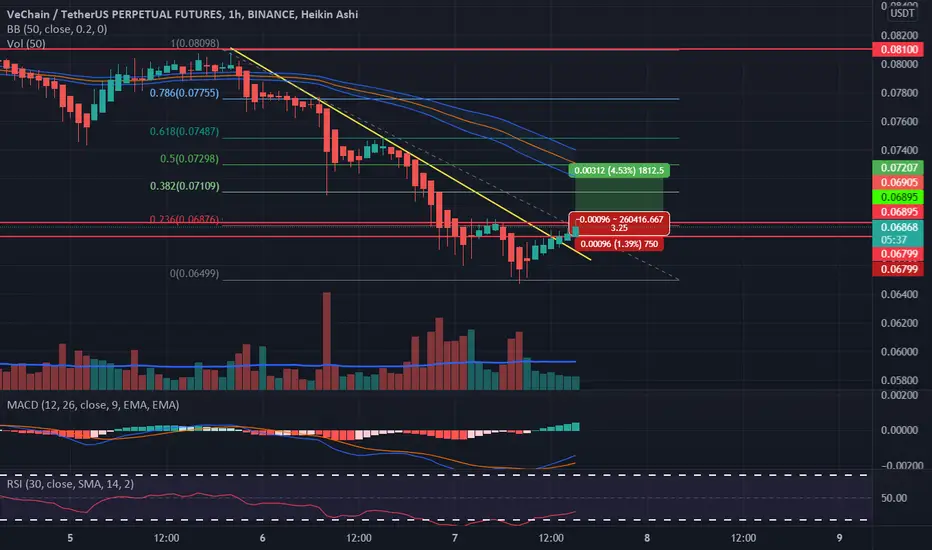
VETUSDTPERP TRBO PLAY-MACD confirmed
-RSI @37 confirmed
-TRBO
-Volume = Not yet High, waiting for it to go up
-TP under BB 50
-2nd TP at 0.618
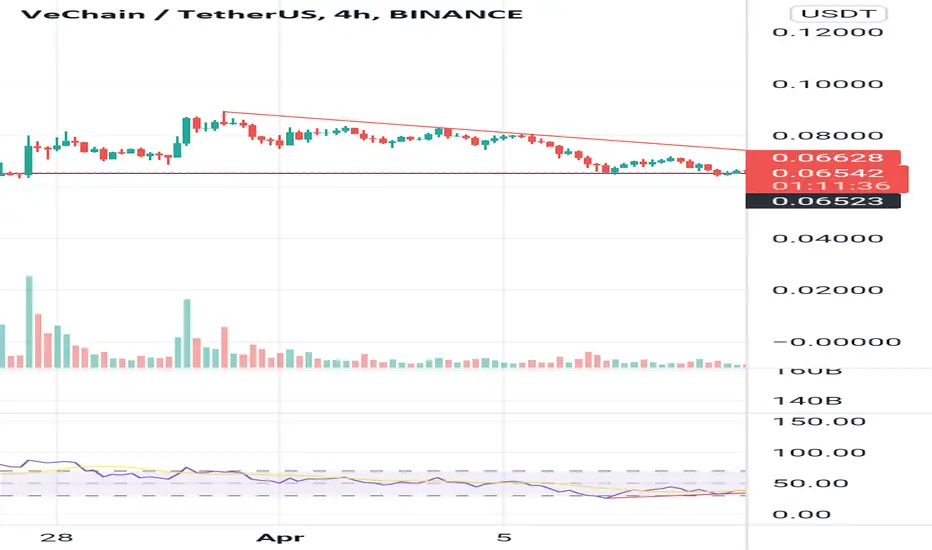
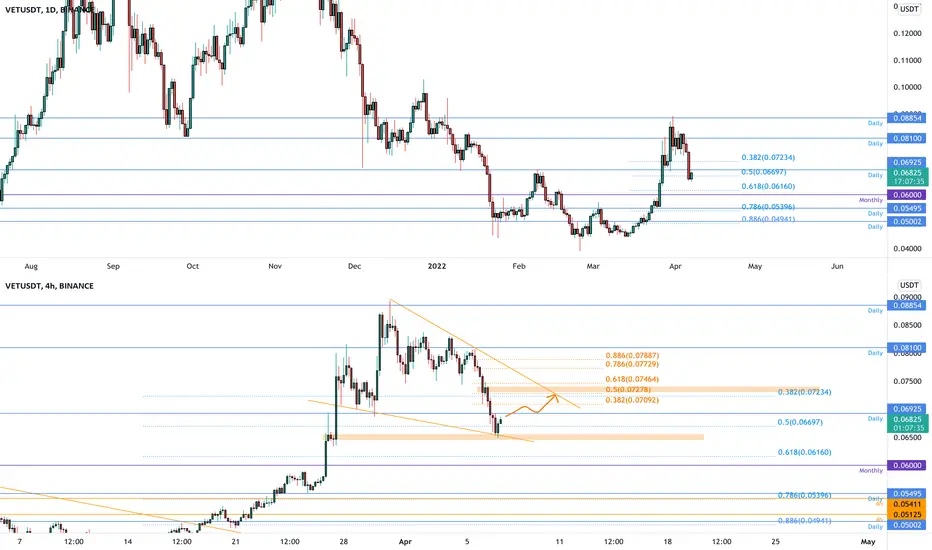
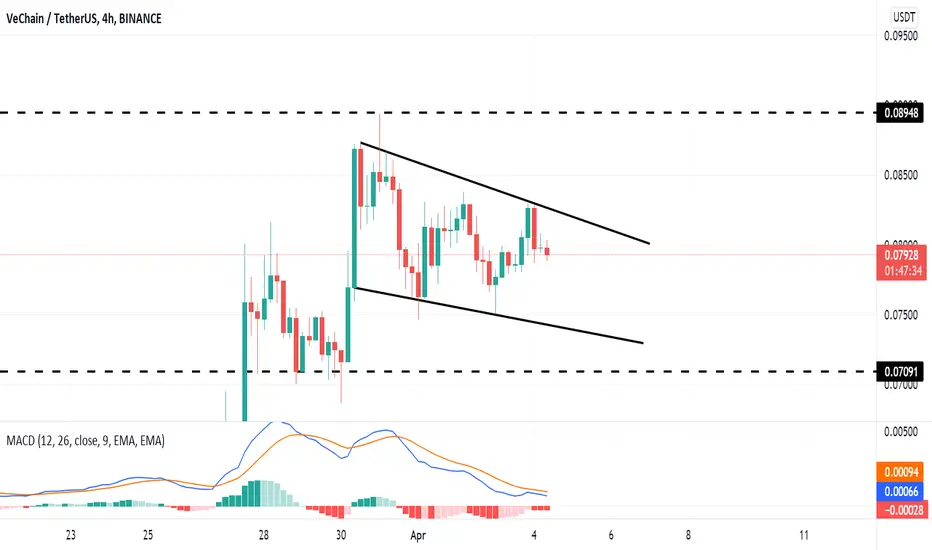
VETUSDT PullbackThe price is testing the 0.5 Fibonacci level on the daily timeframe on 0.67$ after a rejection on 0.088$ daily resistance.
On the 4h timeframe, the price is creating a triangle, and the price is testing the previous dynamic support again.
How to approach?
The price bounced on the previous supply zone on 0.064$. The price needs to flip again the daily resistance, and if the market is going to satisfy our rules, we could see a retest of the previous 4h support now resistance on 0.72$
––––
Keep in mind.
🟣 Purple structure -> Monthly structure.
🔴 Red structure -> Weekly structure.
🔵 Blue structure -> Daily structure.
🟡 Yellow structure -> 4h structure.
$Vet long Price just bounced off of a 2 hour demand zone.
This 77645 level has been defended multiple times.
Higher time frame bullish action
I’ve added to my position here.

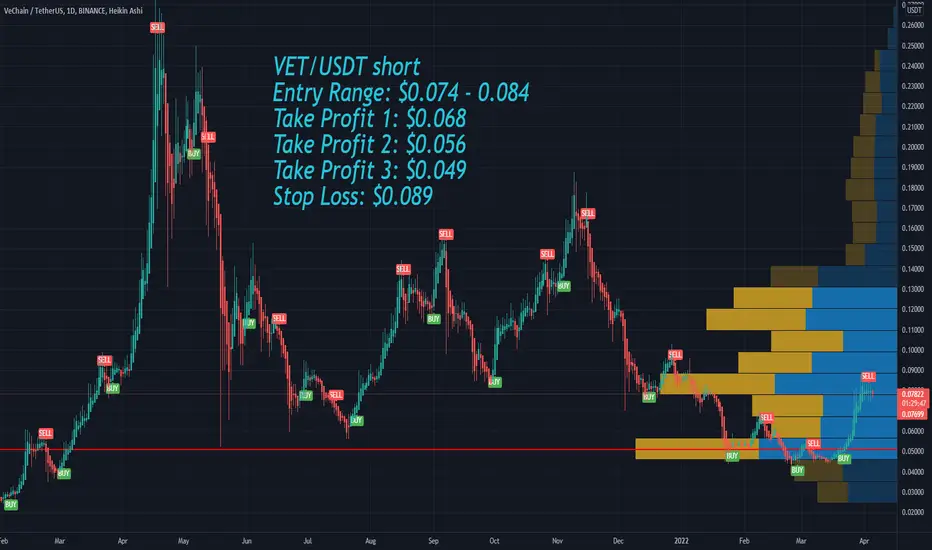
VeChain VET Price Targets and Stop LossVET/USDT short
Entry Range: $0.074 - 0.084
Take Profit 1: $0.068
Take Profit 2: $0.056
Take Profit 3: $0.049
Stop Loss: $0.089

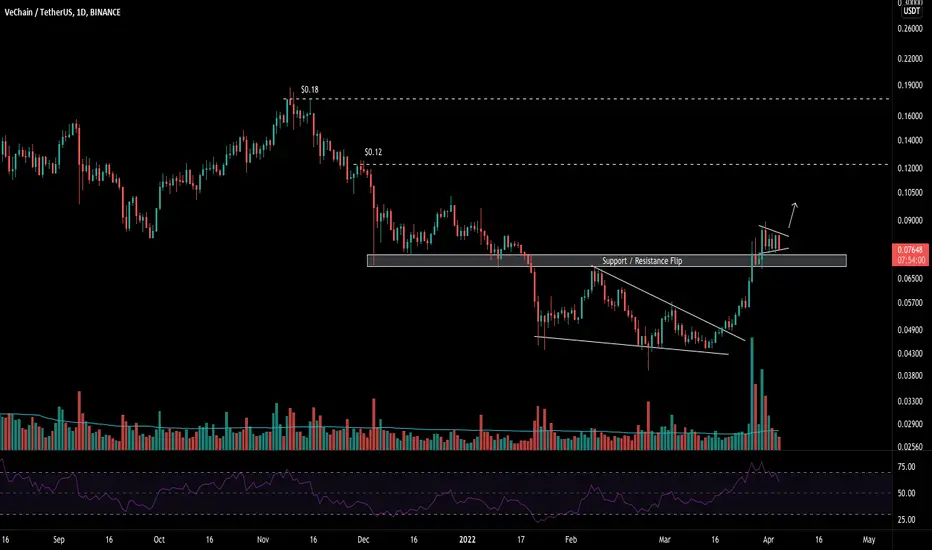
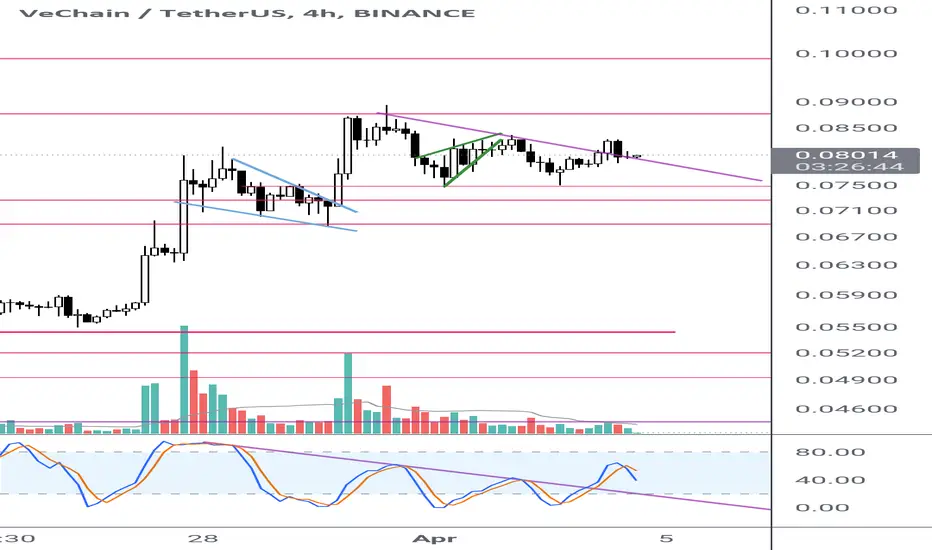
Bull FlagVET had a monster breakout from the falling wedge and got back above significant resistance. Basing into a flag pattern right now with volume drying up and RSI dipping back below overbought territory. Think this continues higher over the coming days.
VETUSDTVET is making bullish flag on H4 TF. Wait for breakout and take entries at 0.083-85 and the tp would be 0.089. SL for this trade would be 0.07
VET Comeback?VET broke out of the bull flag which it formed at the bottom of the downtrend and may be preparing for it's comeback. 200 day ema acting as a strong resistance right now. Flip and we could get a 70% recovery.

VET Salaam
After breaking the trend line, VET is ready in my opinion.
Target is about 10-11c.
Closing a 4h candle below the trend line will neglect the idea.
Good luck

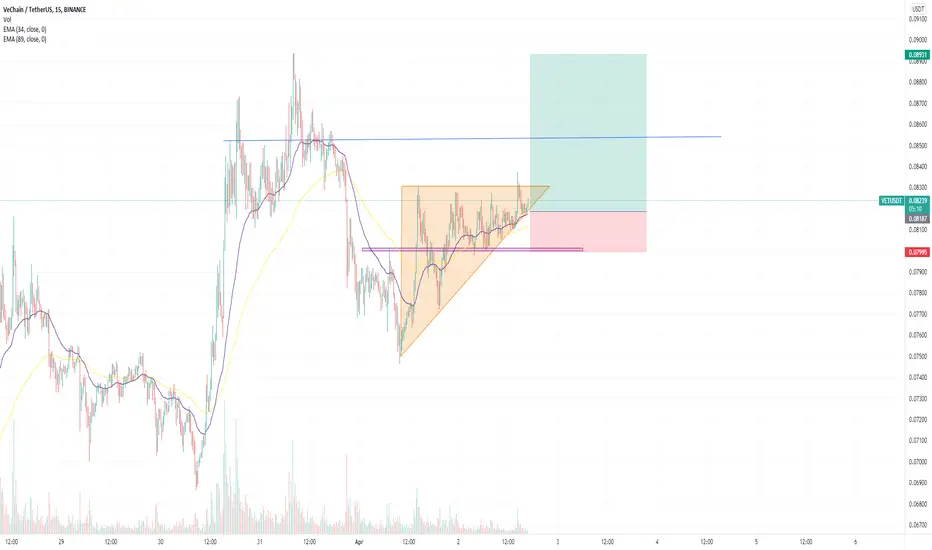
LONG VET RR 3.87Hi everyone,
Please hit the like button or leave a comment if this can make you some money.
LONG VET RR 3.87
- ENTRY : 0.08187
TP1: 0.08539
TP2: 0.08931
- SL: 0.07995
VETSalaam
VET makes a rising wedge in 1h.
If the pattern works could send VET to 0.073 about a 10% correction.
This is buying opportunity in my opinion.
Good luck,
