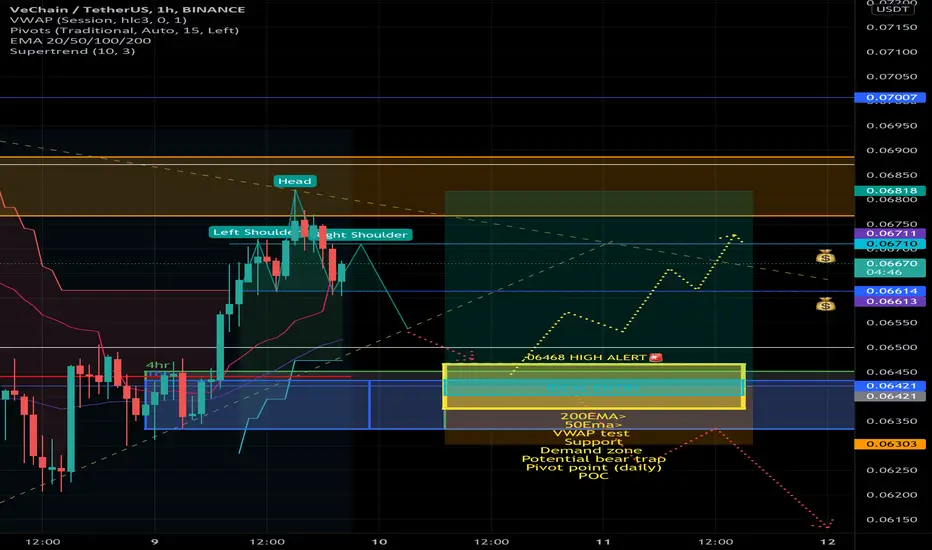
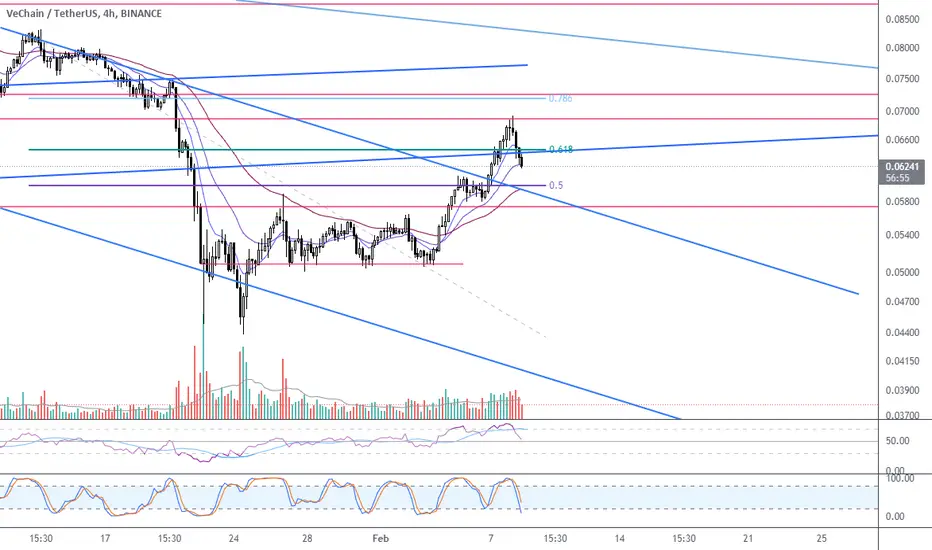
$Vet Long If price rejects to .0646 I will watch how buyers react to this level.
This is an important level where buyers are stacked up.
If price sells through this area = No trade
If price continues to rally = No trade
Confluence
200EMA>
50Ema>
VWAP test
Support
Demand zone
Potential bear trap
Pivot point (daily)
POC
VETUSDT.PS trade ideas
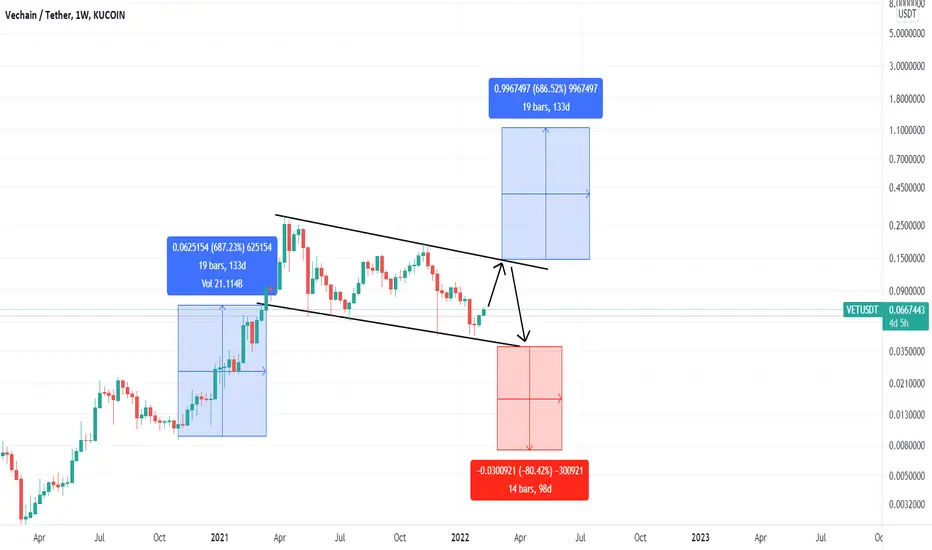
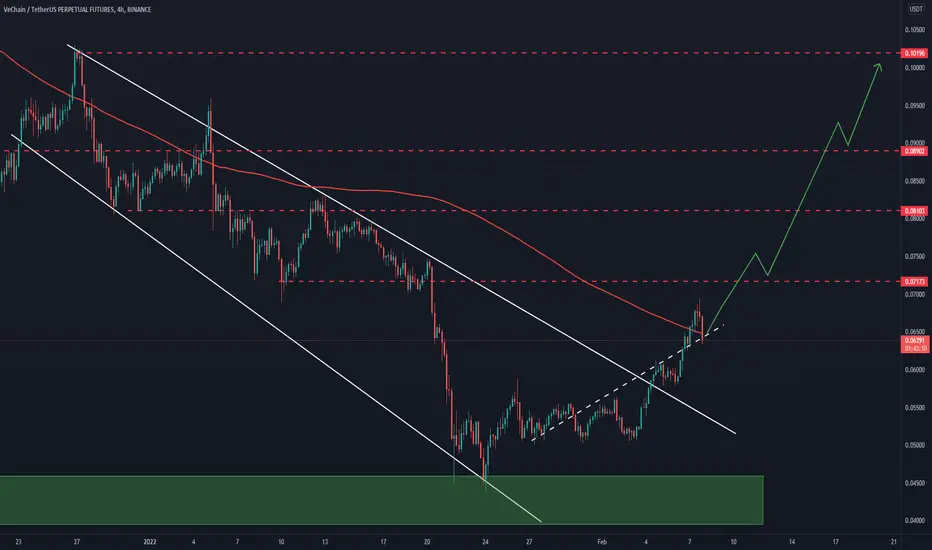
Insane VeChain Bull Flag in Formation!Hey Traders,
This may be my most important trade yet! According to the Weekly chart of VETUSD, the price action has formed a bull flag (attached image URL). The breakout target out of this pattern is approximately 1.1-1.2 USD. In the rare case this does break down the target would be 0.007 USD (In this case we could open a short).
VeChain (VET) is a very revolutionary blockchain product, its utility is very unique compared to other Cryptocurrency Projects. The various amounts of things VeChain could be used to track for supply are infinite, not to mention it could also partner up with things like oracles AKA Chainlink to make it more efficient and data rich.
I hope this helped,
-Pulkanator
VETUSDT, LONG, 1D, BOUNCING FROM STRONG BOTTOM SUPPORT!!VETUSDT is bouncing back from strong support zone, my TP 1 will be at 0.07746 which is 0.236 Fib & previous support too.
And if the momentum continues my TP 2 will be 0.09844 which is at 0.382 Fib.
Good Luck ;)

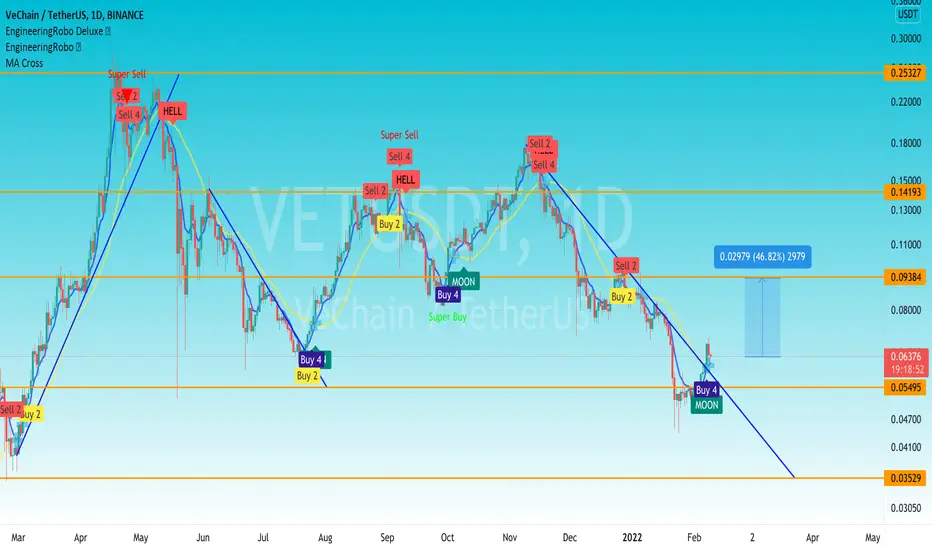
VETUSDT TECHNICAL ANALYSISThe candles break out down trendline and one candle open-close above to down trendline. Also, MA changed to direction as well. Not only that, we have received multiple buy signals from @EngineeringRobo as well and Candle is staying above to support line as well. If market not get any correction in short time, we may earn approximately 46%. Let's follow our analysis together and do not forget the follow me.
"NFA"
VET USDT downside target under $0.064-HTF confluence with fibs, speed fibs, high volume node, range anchored vwap, and 55 vwma.

VETSalaam
All healthy markets need some correction after a decent rally.
VET retrace 60 Fibo of last up move.
Also, there are falling flag (channel) in 15m charts of many coins that could be a good sign to show the correction will end soon.
But remember that no pattern is perfect and always consider some percent to fail patterns.
So, manage the risk and use stop loss to control it.
Good luck
Short term move for Vechain Once this ABC-pattern triggers vechain's bound to hit the .441 fib retracement. Bullish times ahead :)
Also just a massive fan of Vechain fundamentally.

WIll VET continue respecting the up trend and chance to buy !!VET is in an up trend on fraim 15 min an maybe this our chance for scalping so guys my entry price 0.06389$
my first target 0.068$ /
second target .0.076$
and my stop loss 0.0617$ good luck everyone
NOTICE: THIS IS A SPOT POSITION NOT ON FUTURE YOU ARE RESPONSIBLE FOR YOUR SELF

VET/USDT 4 HOURS UPDATE Welcome to this quick Update, everyone.
If you are reading my updates for the first time do follow me to get more complex charts in a very simplified way.
I also post altcoin setups on Spot, Margin, and Futures.
I have tried my best to bring the best possible outcome in this chart.
VET/USDT breaks out this channel and already retested it and lying on 200MA.
Entry: CMP
Targets: 30%TO 40%
Stop Loss: $0.0612
What's your thought on this?
Do hit the like button if you like this update and share your views in the comment section.
Thank you
#PEACE
VET/USDT 4 HOURS UPDATE Welcome to this quick Update, everyone.
If you are reading my updates for the first time do follow me to get more complex charts in a very simplified way.
I also post altcoin setups on Spot, Margin, and Futures.
I have tried my best to bring the best possible outcome in this chart.
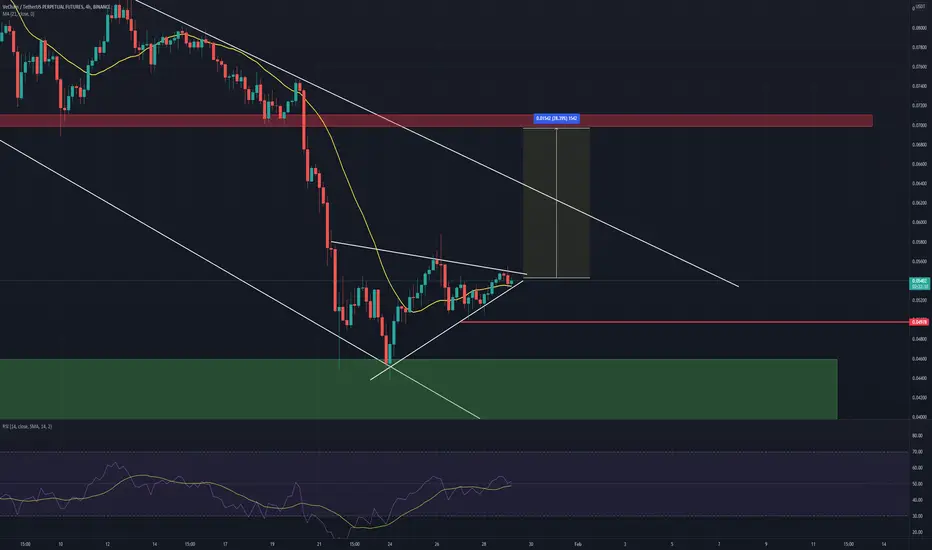
VET/USDT is making a bullish symmetrical triangle pattern.
Entry: CMP
Targets: 20%TO 28%
Stop Loss: $0.0497
What's your thought on this?
Do hit the like button if you like this update and share your views in the comment section.
Thank you
#PEACE
VeChain shortVeChain bounced off the resistance level. Asset bounced down off the bearish trendline. Decline to support level at 0.044 is expected to happen.

VET - investment idea💡💡#INVEST 💡💡
VET / USDT
▶️ Buy in two Block
1Block (40%) 0.0567 - 0.0676
2Block (50%) 0.0325 - 0.0397
3Block (10%) 0.0219 - 0.0254 (In case things get really bad, but I don't believe the price will fall here...)
SPOT ONLY!!!
#VETUSDT_INVEST_030122
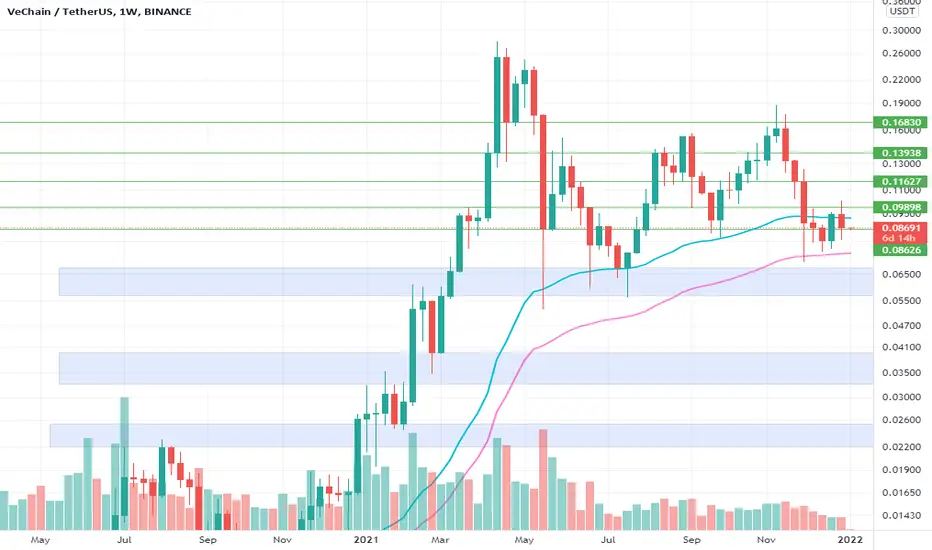
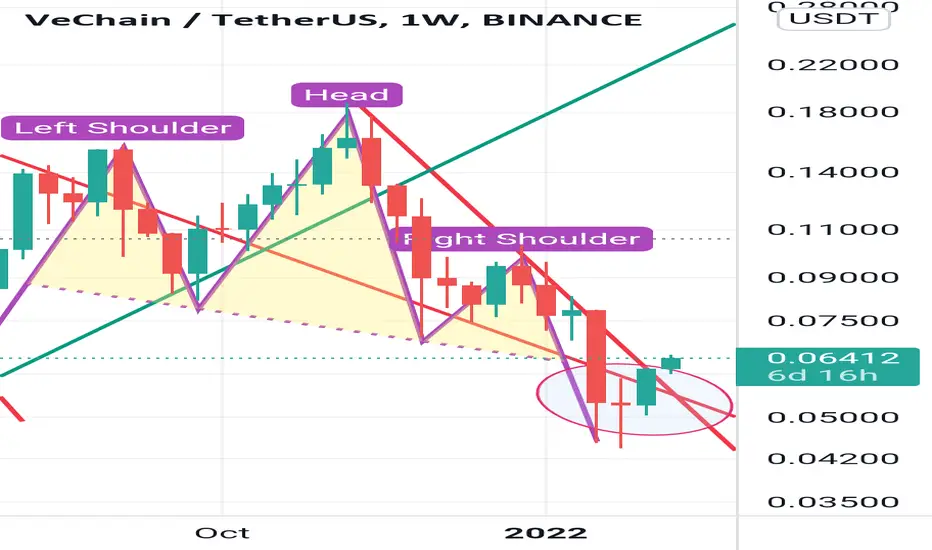
VET H&SHello, trading view community, should you like this analysis, please support with like and comments, Thanks
It seems that VET has compeleted a head and shoulders pattern in the weekly timeframe which means it may pullback to $0.07896 resistance zone and then probably carshes to $0.03455 - $0.03341 support zone.
at the bottom right, in the circle, the morning star formation has already been confirmed which is a very strong confirmation of bullrun.
both of them have been formed in weekly timeframe which is very strong signal to present two different trends in near future.
should traders take the morning star formation into consideration, then they may go long from $0.06400 and exit on $0.07890
or if you look at the H&S pattern, it's better go short from $0.07895 resistance zone and exit on $0.03341 - $3455 support level
this is a personal idea and I am not a financial adviser.
Vet next movesVet(chain) possible next up Moves. With Previous Hard Resistent. Break These we see 5$

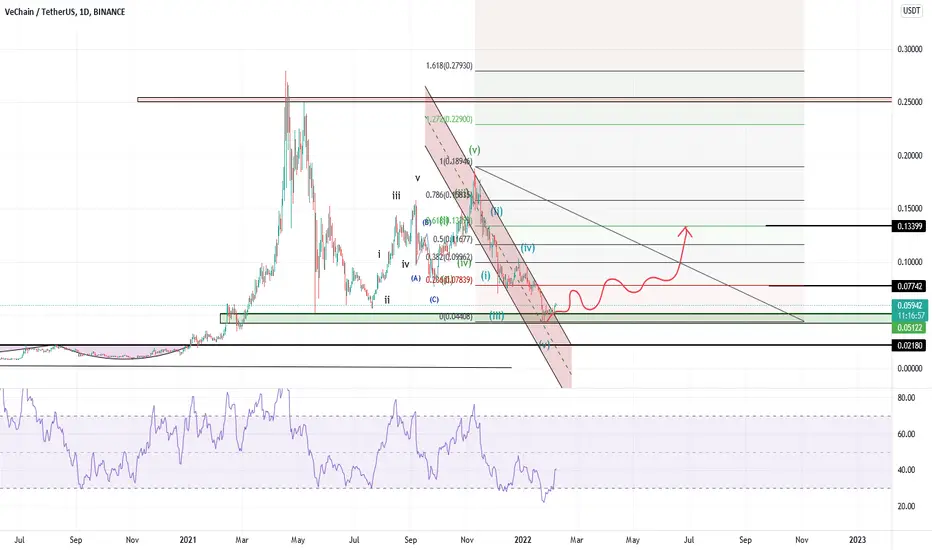
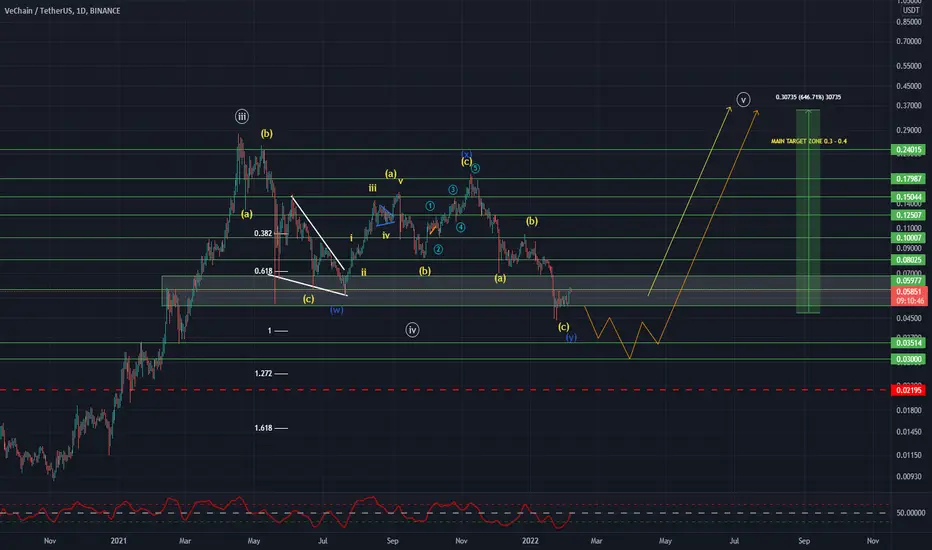
VETUSDT Wave Analysis (GLOBAL VISION)Hello friends.
Please support my work by clicking the LIKE button👍 (If you liked).Thank you!
Everything on the chart.
Globally we're in double zigzag (wxy) wave of (4).
Waiting for an upward movement either from the current price, or through a small update of the last low (will depend on #BTC).
Entry: market and lower
MAIN TARGET ZONE AT THE END OF BULL RUN: 0.3-0.4$
Stop: (depending of ur risk). ALWAYS follow ur RM .
cancellation of growth,consolidation below ~0.022$
Risk is justified.
Good luck everyone!
Follow me on TRADINGView, if you don't want to miss my next analysis or signals.
It's not financial advice.
Dont Forget, always make your own research before to trade my ideas!
Open to any questions and suggestions.
vet
Assembly process targeting 0.07
Fionacci 0.236
Not financial advice, but this is a personal opinion