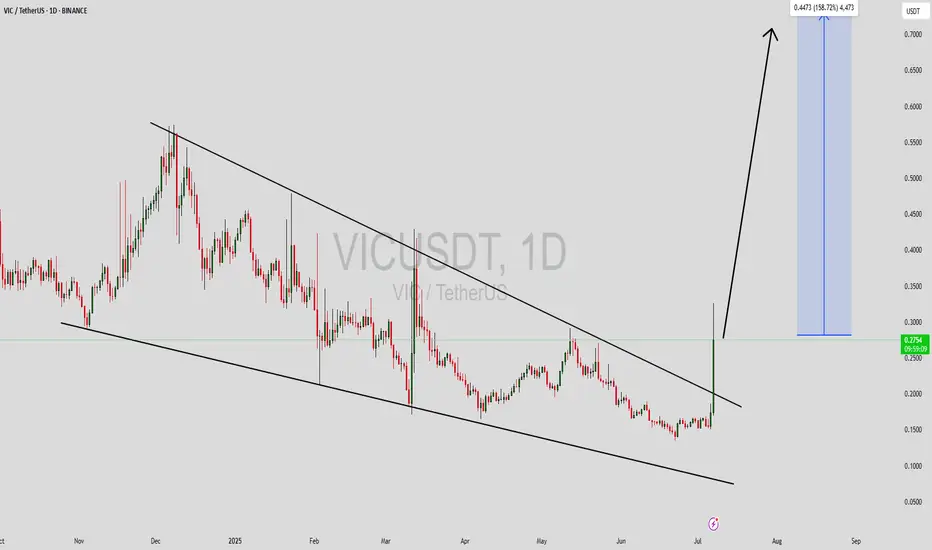
VICUSDT Forming Falling WedgeVICUSDT is displaying a classic falling wedge breakout pattern, which is often seen as one of the most reliable bullish reversal signals in technical analysis. This pattern suggests that the downtrend may be losing steam and a significant trend reversal could be underway. With a well-formed falling
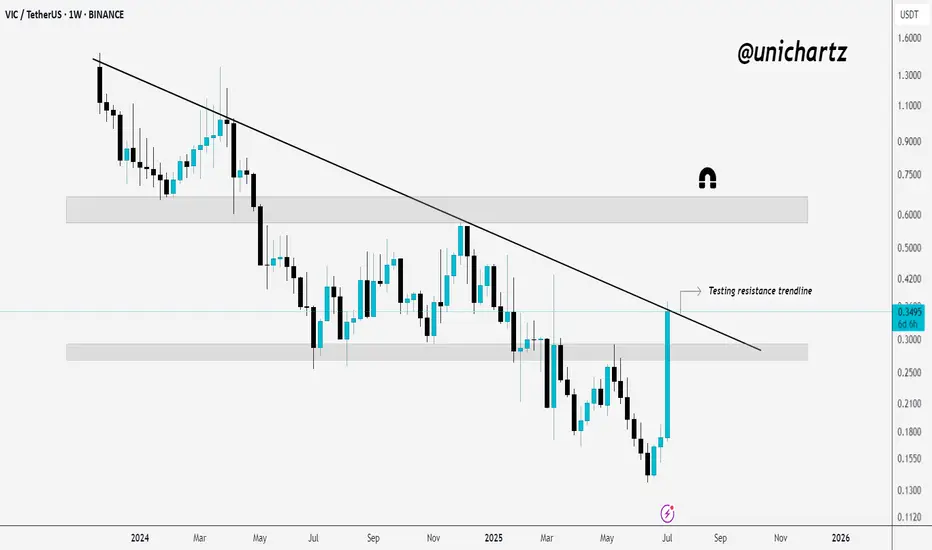
VIC Faces Crucial Resistance Test After Explosive RallyVIC just popped over 100% and is now testing a key resistance trendline.
After weeks of sideways chop and downside pressure, VIC has made a strong bounce off the demand zone and is now pushing right into the falling resistance trendline.
This is a crucial level, if it breaks and holds above this t
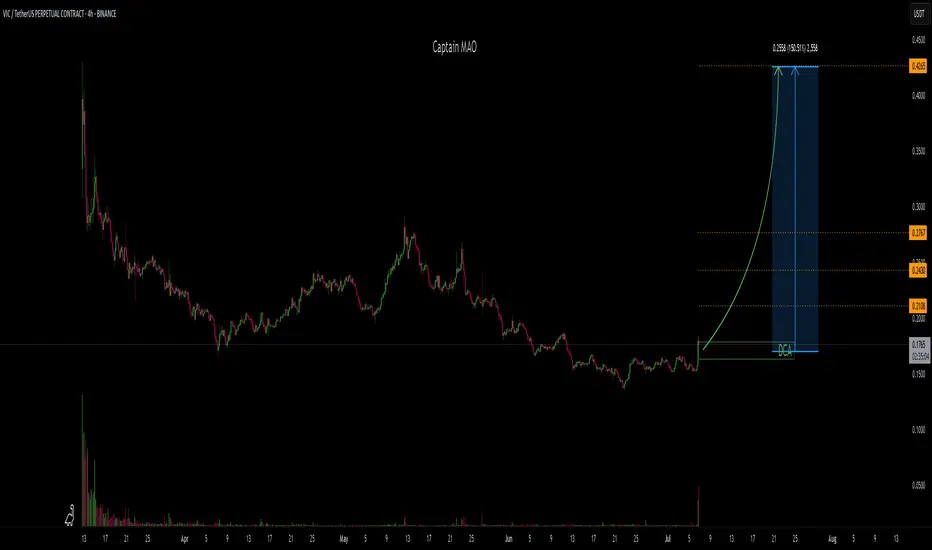
VIC/USDT 150% !!VIC has been ranging for the past 11 days between $0.15 – $0.166, and that consolidation phase has now been broken with a strong 4H bullish candle, giving us the first solid sign of a potential trend reversal.
Entry Zone: DCA from current price down to $0.163
Target 1: $0.277
Target 2 (Full Target)
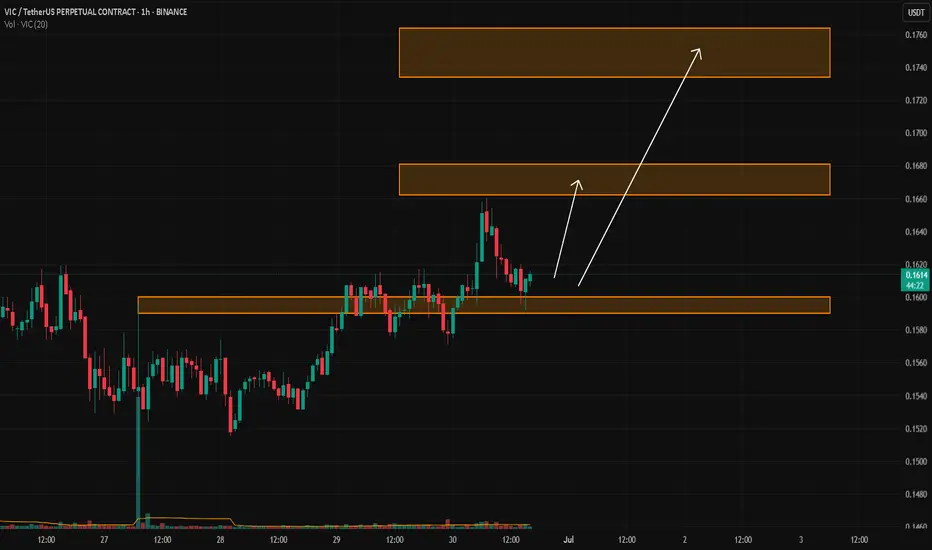
VIC/USDTKey Level Zone: 0.1590 - 0.1600
LMT v2.0 detected.
The setup looks promising—price previously trended upward with rising volume and momentum, then retested this zone cleanly. This presents an excellent reward-to-risk opportunity if momentum continues to align.
Introducing LMT (Levels & Momentum Tr
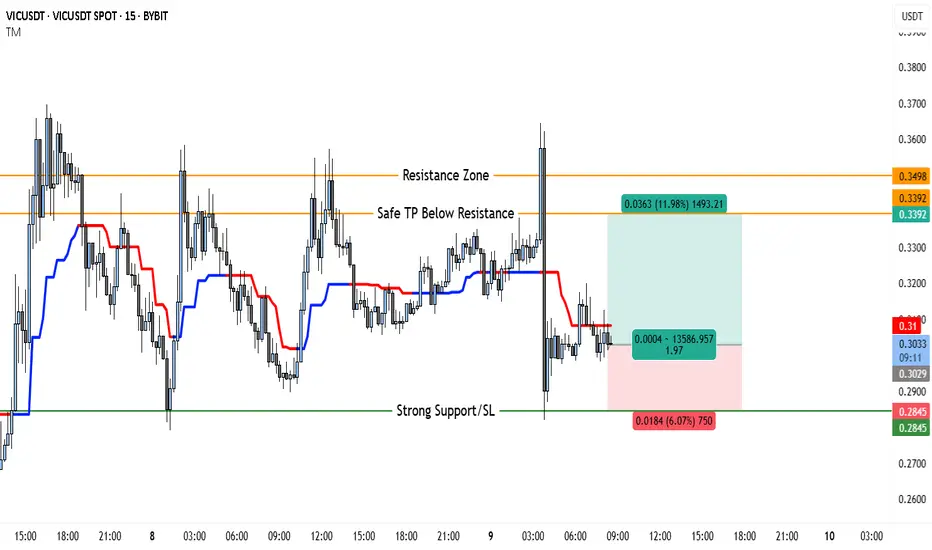
VICUSDT 15-Minute Technical Analysis With 2:1 RewardThis chart shows a clear range-bound market, with price oscillating between a strong support and a well-defined resistance zone. Overall, momentum has been choppy, and frequent reversals are visible.
Support and Resistance
At the top of the chart, you have the Resistance Zone marked at 0.3498 USD
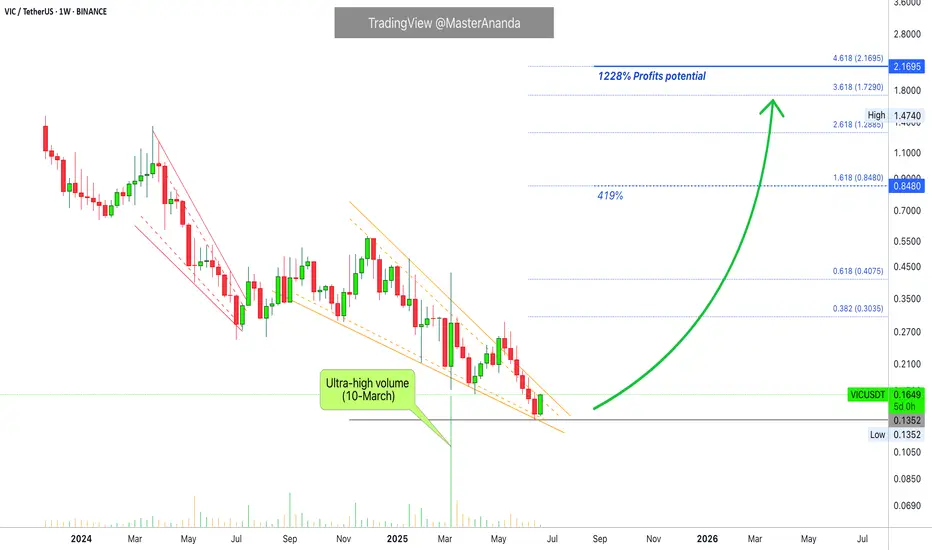
Viction Hits Bottom, 1,228% Growth Potential or HigherViction produced the highest volume ever on the 10-March week. All the other weeks have insignificant volume compared to this one and this session ended closing green. This is a strong signal.
A large part of the altcoins market produced a bottom 10-March.
Another signal that favors the bulls and
#VICUSDT shows signs of reversal and strength📉 LONG BYBIT:VICUSDT.P from $0.2507
🛡 Stop loss $0.2470
🕒 1H Timeframe
📍 Important Note:
Wait for confirmation around the $0.2507 level. Enter the trade only if price holds above with volume.
✅ Overview BYBIT:VICUSDT.P :
➡️ The chart shows a completed Falling Wedge — a bullish reversal pa

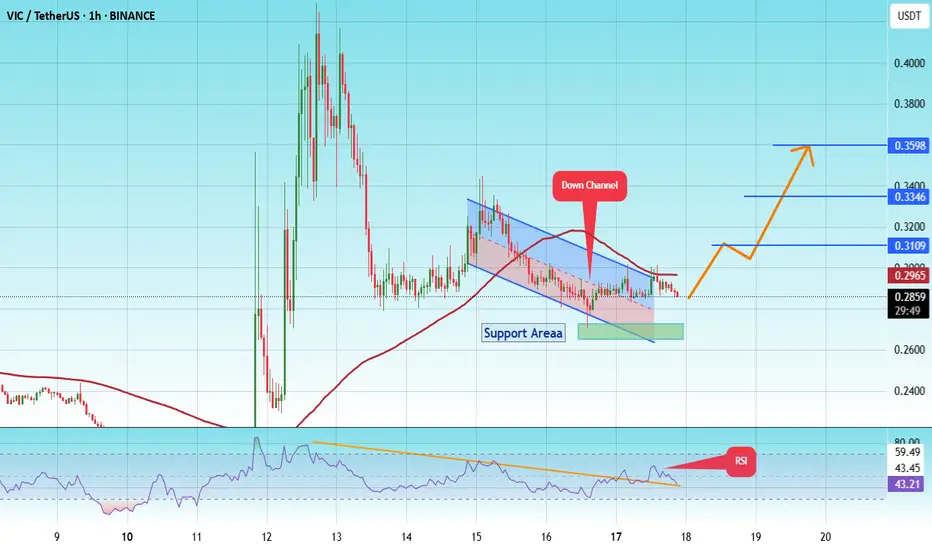
#VIC/USDT#VIC
The price is moving within a descending channel on the 1-hour frame and is expected to continue upward.
We have a trend to stabilize above the 100 moving average once again.
We have a downtrend on the RSI indicator, which supports the upward move by breaking it upward.
We have a support are
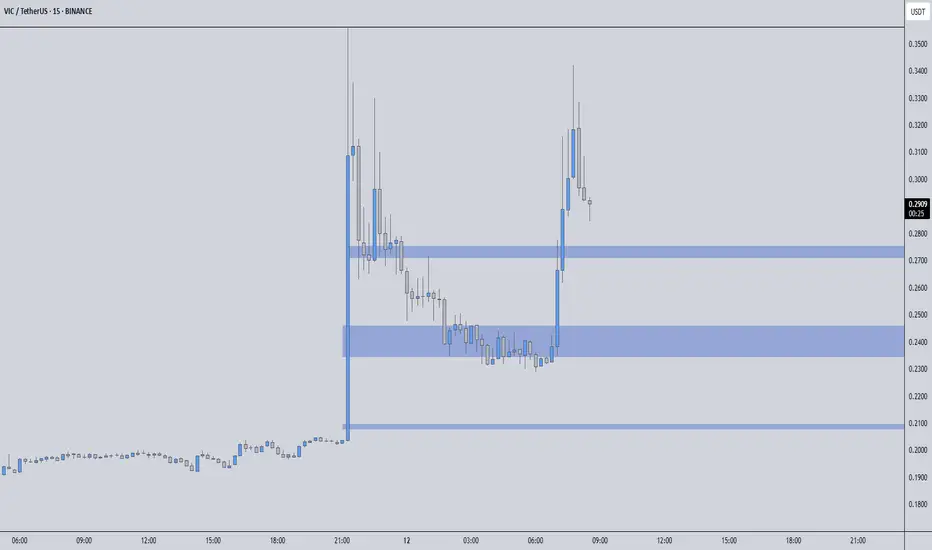
ALTCOINS TO WATCH - INSANE VOLUME SPIKE! BIG MOVE LOADING?🚀 VICUSDT – INSANE VOLUME SPIKE! BIG MOVE LOADING? 🚀
“This is not just a volume increase. This is a 3,061% SPIKE. Smart money is moving—are you paying attention?”
🔥 Key Points:
✅ Massive Volume Surge – This isn’t retail noise. Someone BIG is making a move.
✅ Blue Boxes = Strong Support – But don’
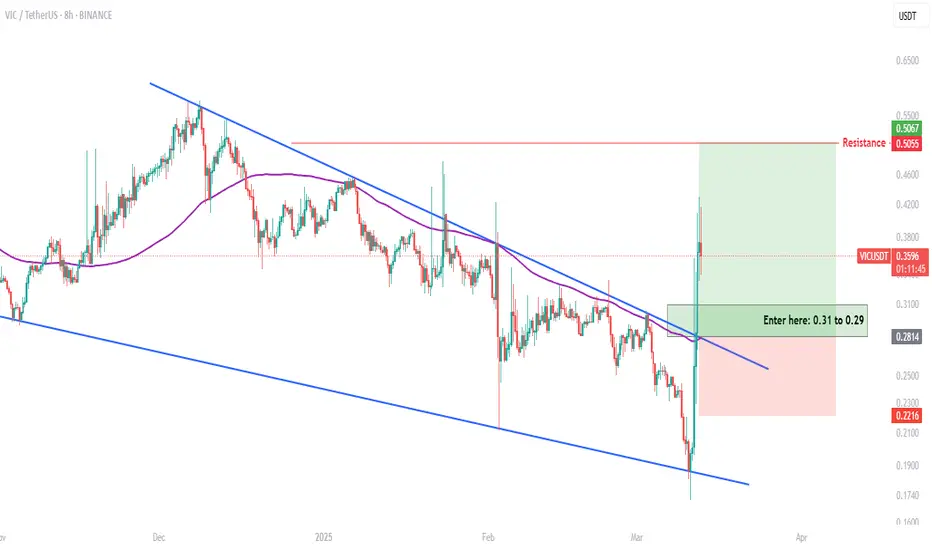
VICUSDT: long trade set-up!!Join our community and start your crypto journey today for:
In-depth market analysis
Accurate trade setups
Early access to trending altcoins
Life-changing profit potential
VICUSDT long trade set-up!
Buying Levels:
$0.31 to $0.29
Target Levels:
$0.55
SL: $0.22
If you find this analysis helpful,
See all ideas
Displays a symbol's price movements over previous years to identify recurring trends.