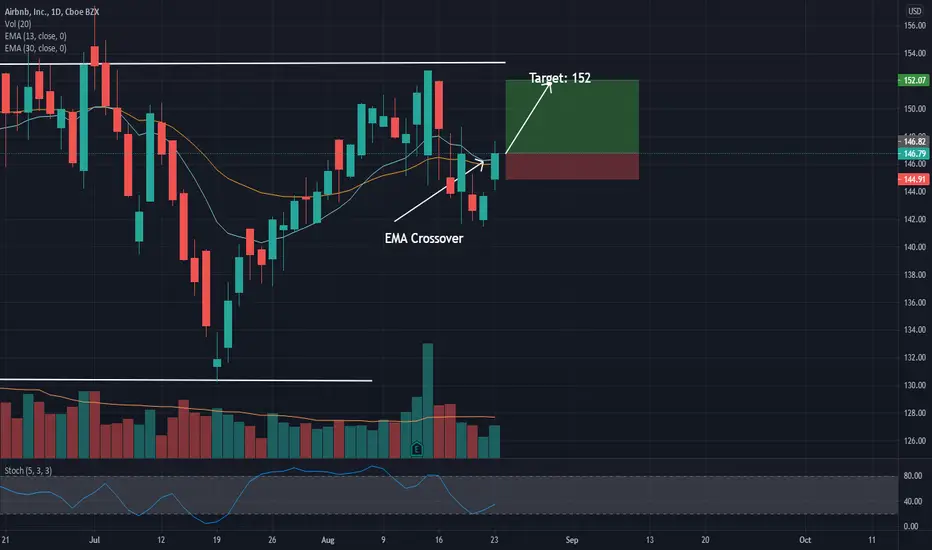
ABNB EMA CrossoverABNB has crossed over its 13 EMA at the close, i'm suspecting a push higher over the next 1-2 trading days into the next layer of resistance, which is at the 152 area
ABNB trade ideas
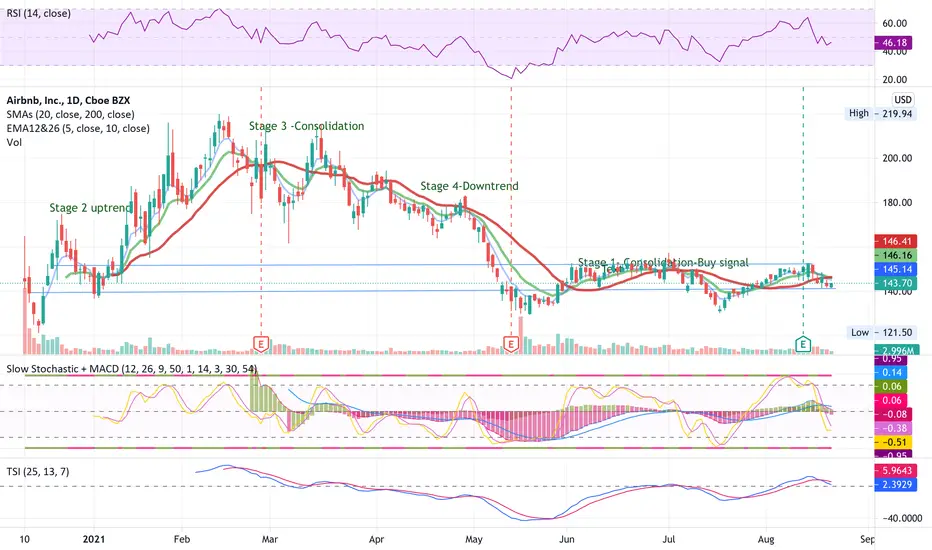
AirBnb in Stage 1Looks like Airbnb is in stage 1 consolidation or buy stage. If it stays above the $140 support line it should be setting up for a bullish run to the $146 line of resistance. If it breaks that line it could try for the all time high, with time. My opinion, no trading advice from me. Trade at your own risk.
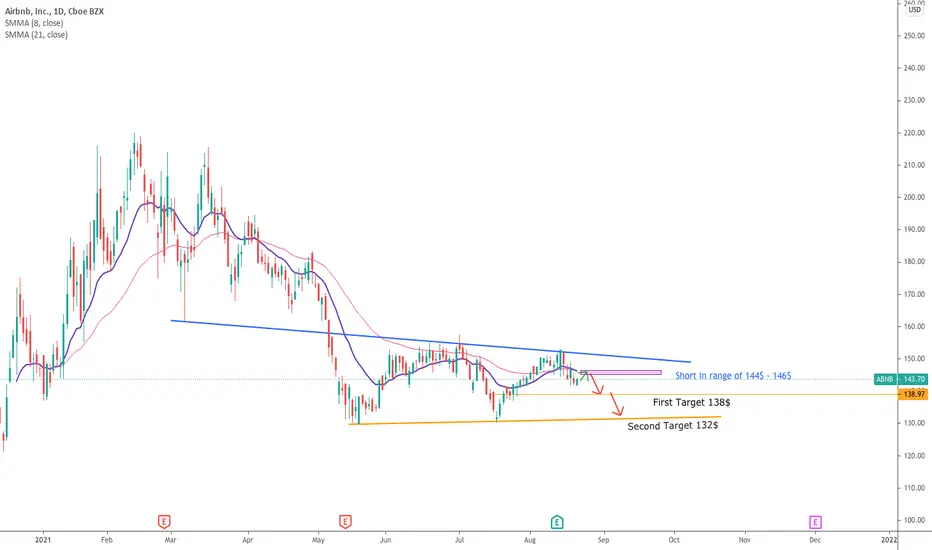
Short $ABNB ( $QQQ, $SPY )Nice rejection from upper trend line.
Below 8 SMA and 21 SMA
Target 138$ , 132$
StopLoss : 147$
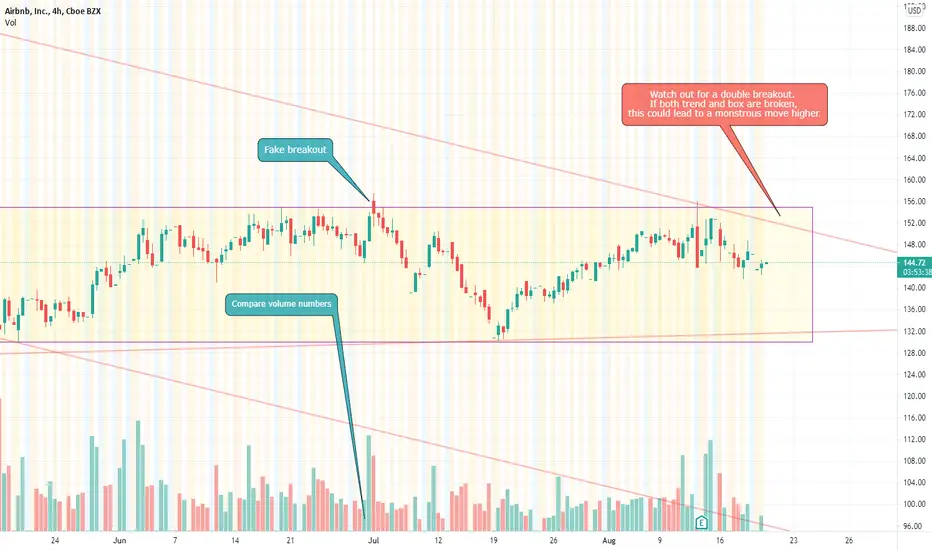
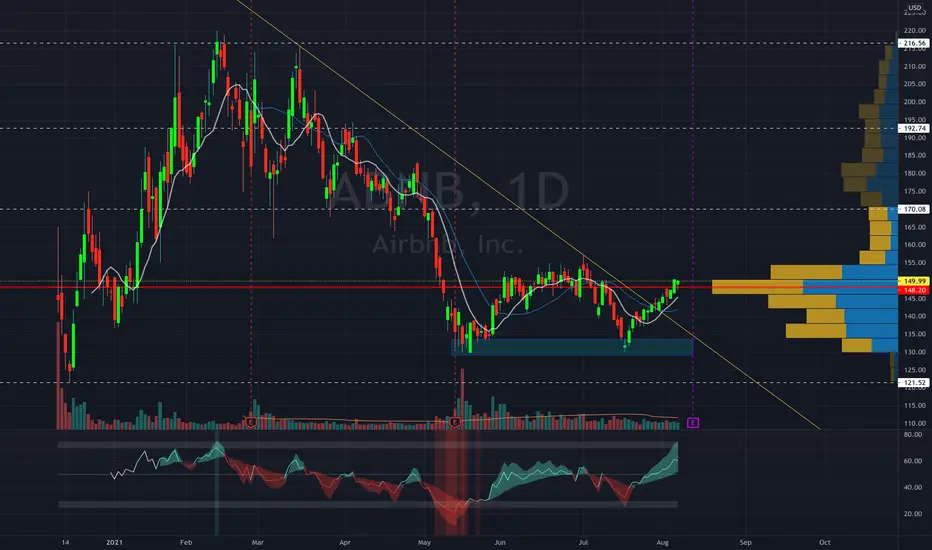
Boxes trading strategy example. $ABNB stock.Continuing my tutorials on boxes trading strategy.
This time let's analyze NASDAQ:ABNB stock price movement.
Taking all appropriate steps as described in my first lesson:
1. Identifying long-term trend channel.
2. Finding supply and demand zones.
3. Drawing a box inside which price is moving sideways.
4. Buying demand zone bounces.
5. Watching for breakouts.
There are some curious details in this stock's price movements.
We can see there was an attempt for a breakout from the box on the session opening of July 1st. However, there was not enough volume for the move higher, so the breakout failed.
As expected, the stock reversed to go lower in the followind days.
Even though this stock is in a falling trend channel, it's very news sensitive stock.
For instance, if there are positive news regarding COVID mitigation, we could see a major breakout from the falling trend.
-----------------------------------------------------------------------------------------------------------------
Airbnb has been on my radar for a long time now. Personally, I think it's a great long-term investment and I've been buying the stock on it's way down. I believe it will be a great post-COVID play.
-----------------------------------------------------------------------------------------------------------------
Disclaimer!!!
This is not financial advise.
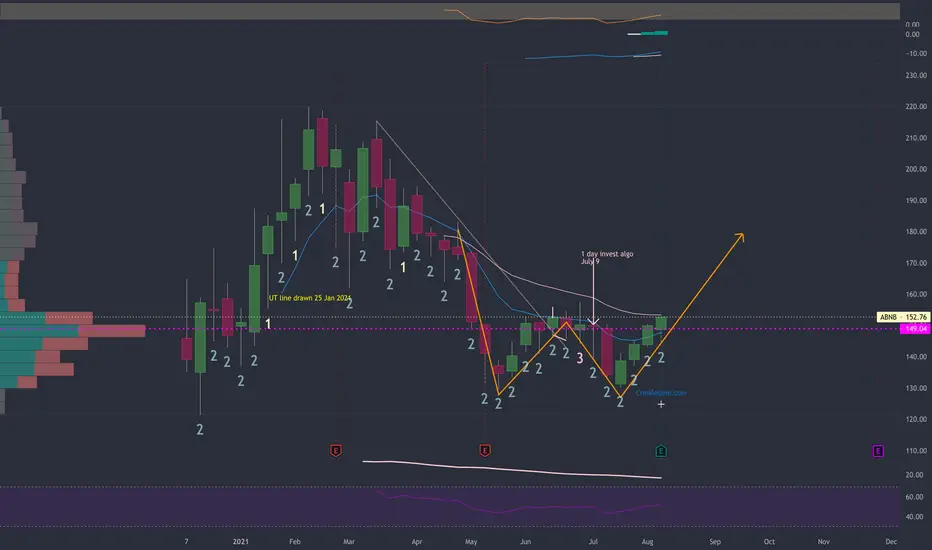
$ABNB (AIRBNB)Possible Double Top Into Triple Bottom.
ABNB Short Term (2-6 Weeks back into bottom of channel )
Current Price : $144
Price Targets Down:
1) $ 140
2) $ 135
3) $ 130
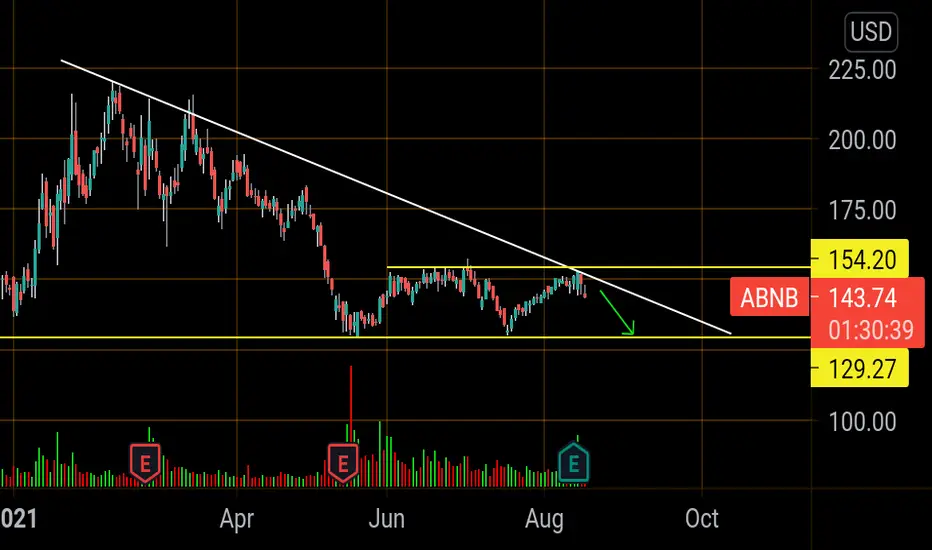
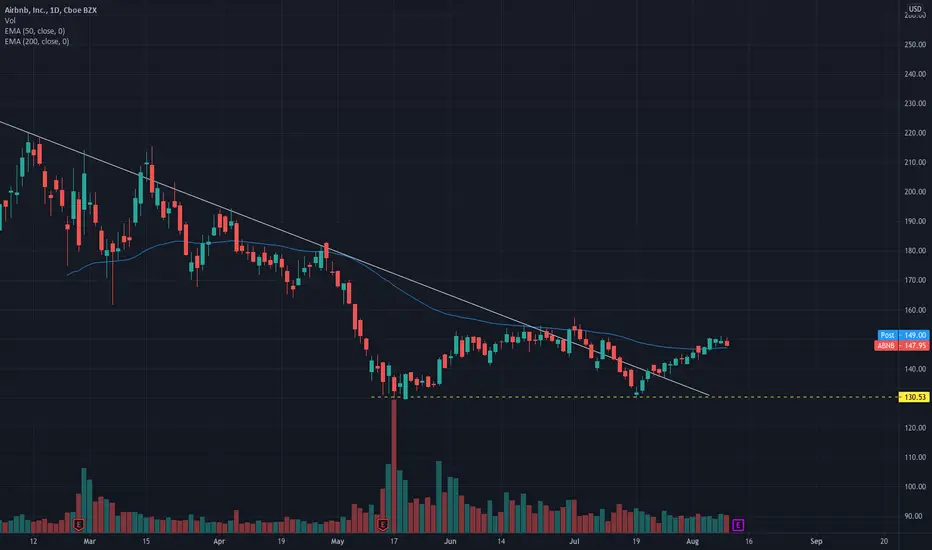
Abnb back to 130Rejected at downtrend (Whiteline)
Rejected at horizontal resistance.
Fell below 50ma today
Rise in covid cases have institutions dumping this

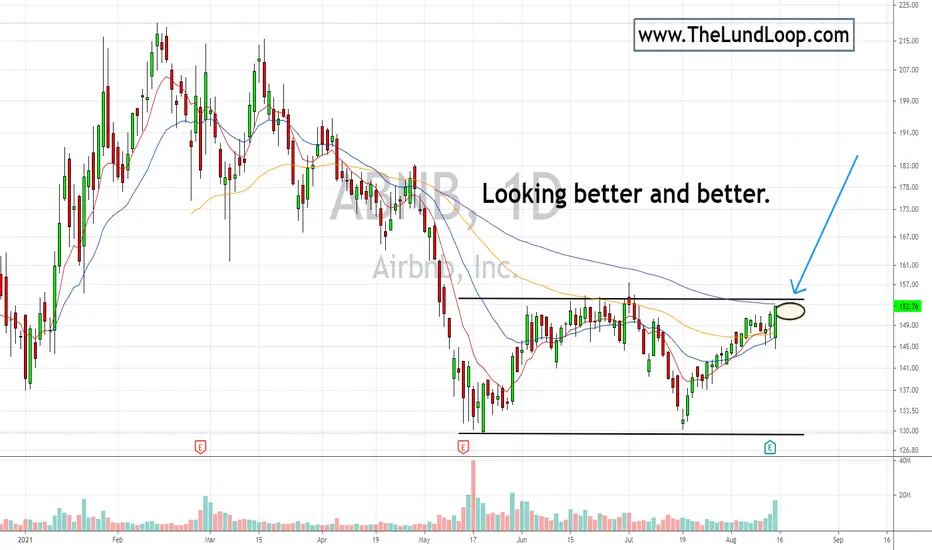
Potential ABNB setup.1-3 tight days right below this resistance level could set up a nice risk/reward trade in $ABNB
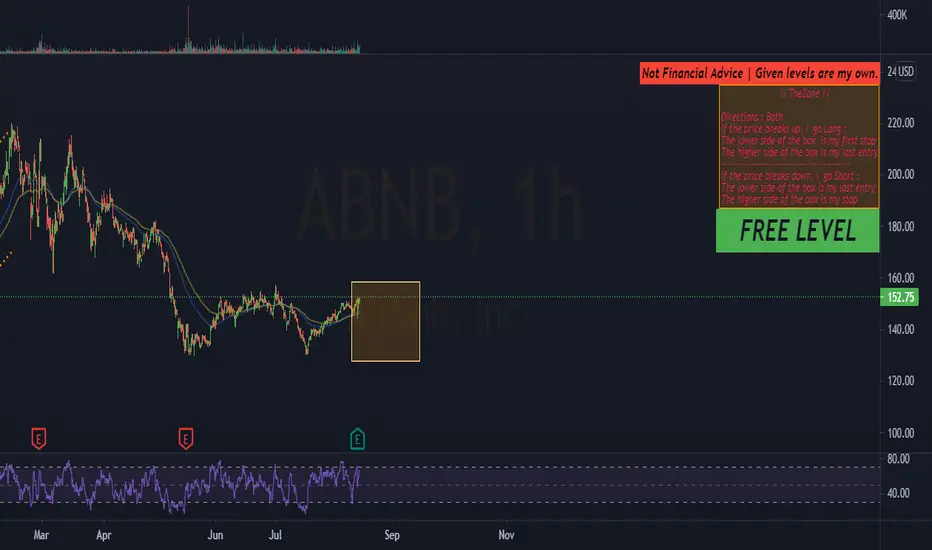
New Level : ABNBWeek n. 33 | Trigger #14 | #20213314
ticker #ABNB
Long > 159 with stop at 143
Short < 127 with stop at about 145
Ema21+50 at the test. Price needs a new high to consolidate the bullish trend.
$ABNB - lets make "W"Screeners like it, I like it. It will rebound eventually.
Pick up around $150 and target is $170
Common shares.
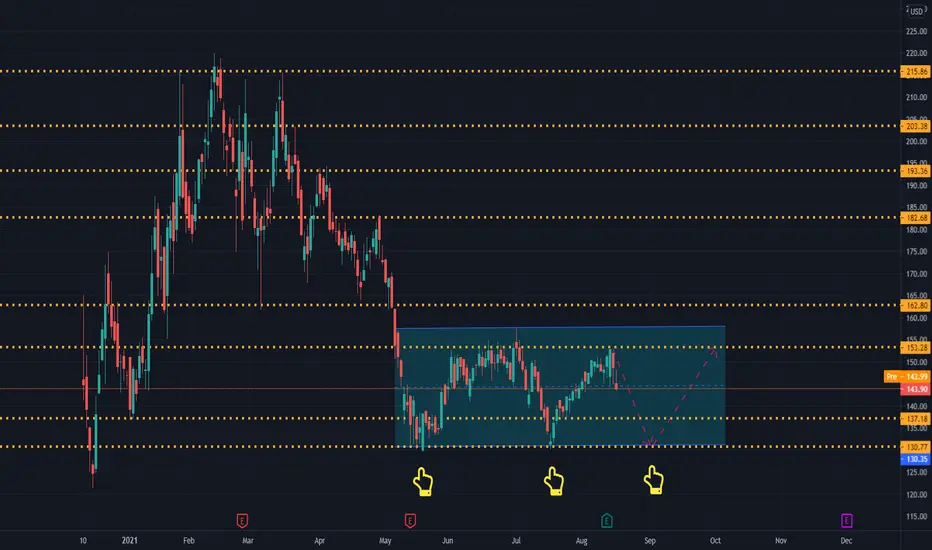
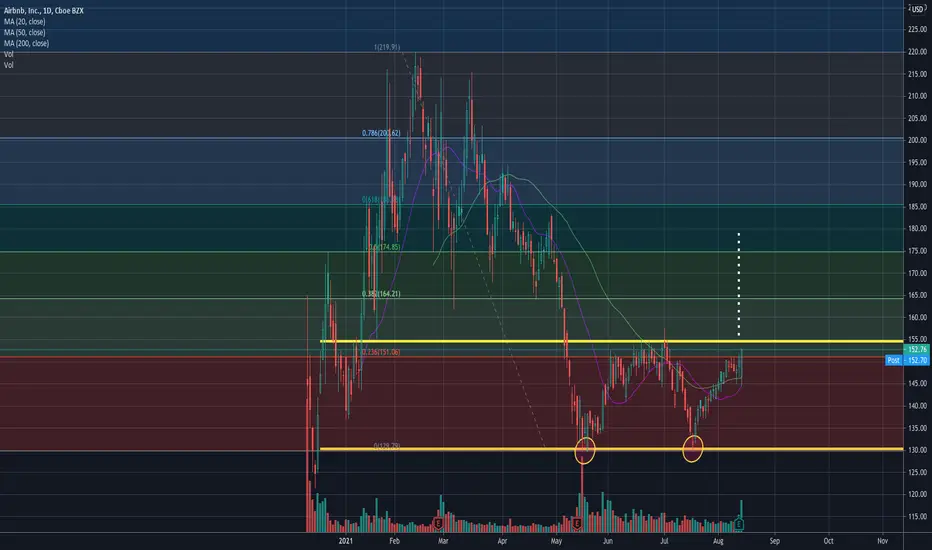
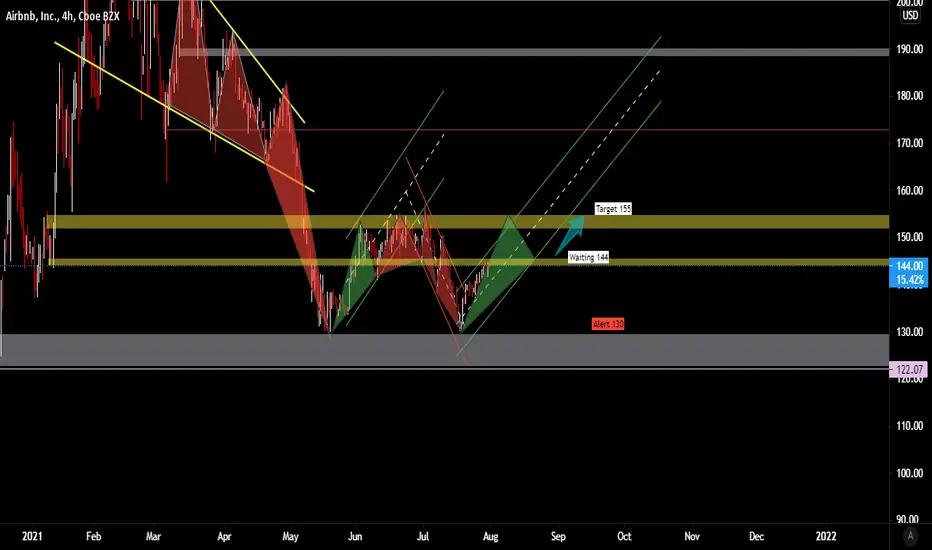
$ABNB - Double bottom breakout watch!Stock double bottomed and now heading back to the peak $155 area.
If stock breaks above $155 area, it could see $175.
———————————————————
How to read my charts?
- Matching color trend lines shows the pattern. Sometimes a chart can have multiple patterns. Each pattern will have matching color trend lines.
- The yellow horizontal lines shows support and resistance areas.
- Fib lines also shows support and resistance areas.
- The dotted white lines shows price projection for breakout or breakdown target.
Disclaimer: Do your own DD. Not an investment advice.
ARAB B&BER Aug 12. trying to find support at the 50MA after many attempts. no good r/r. ER tomorrow could go either way. big gamble. nearest support that i trust is $130. ER will be interesting, i wanna see how they've performed during the re re opening.
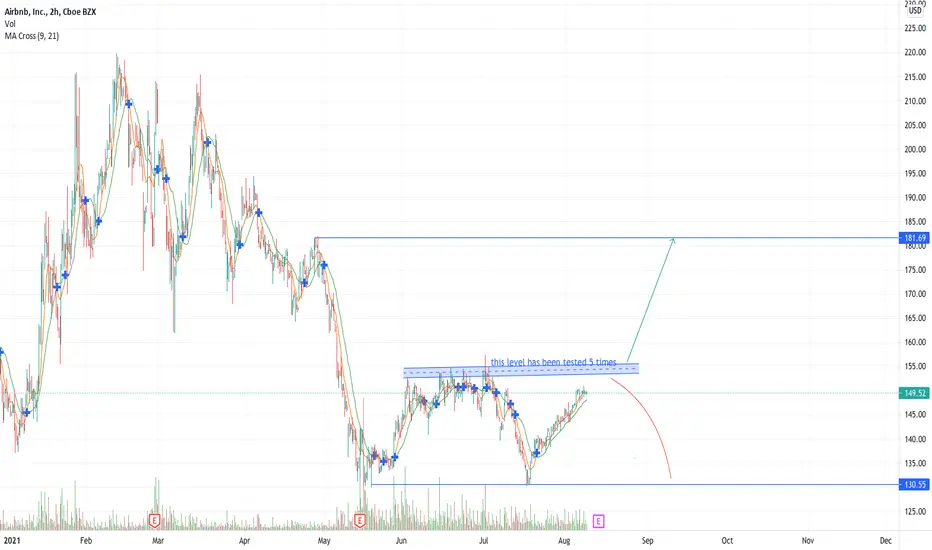
lookout for $ABNBchart is moving towards a resistance level, that has been tested 5 times. Might give a breakout here if it closes above the resistance level.
(or) might give a short term retracement.
I am bullish on this, will take a trade only if it breaksout.
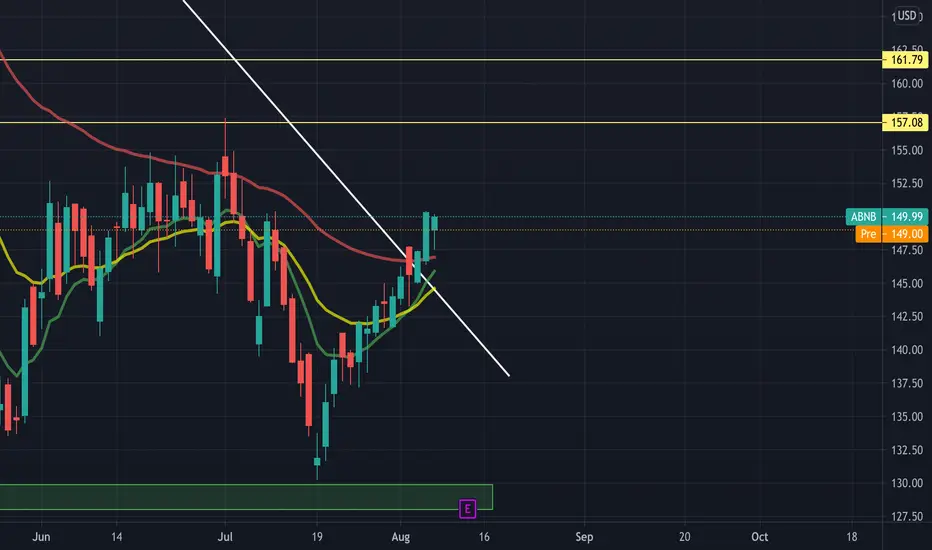
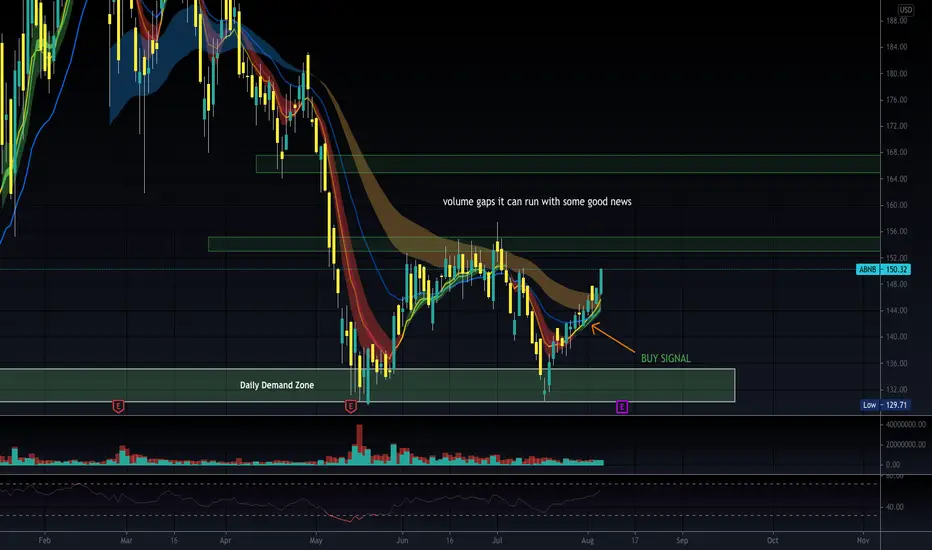
Breakout of Downtrend with a Golden CrossStrong Support with a double bottom as the green supply zone, Rebounded well and broke out of the downtrend.It is sitting above Moving averages and seeing a Golden Cross in the making on the 4HR Chart. A nice squeeze from $157 to $162/$163. but must break $150 first and turning resistance to support. Much bigger upside from $165 to $200. Would be good for long term holding. However beware of delta variant cases affect reopening stocks and also Earnings is coming up on 12th August.
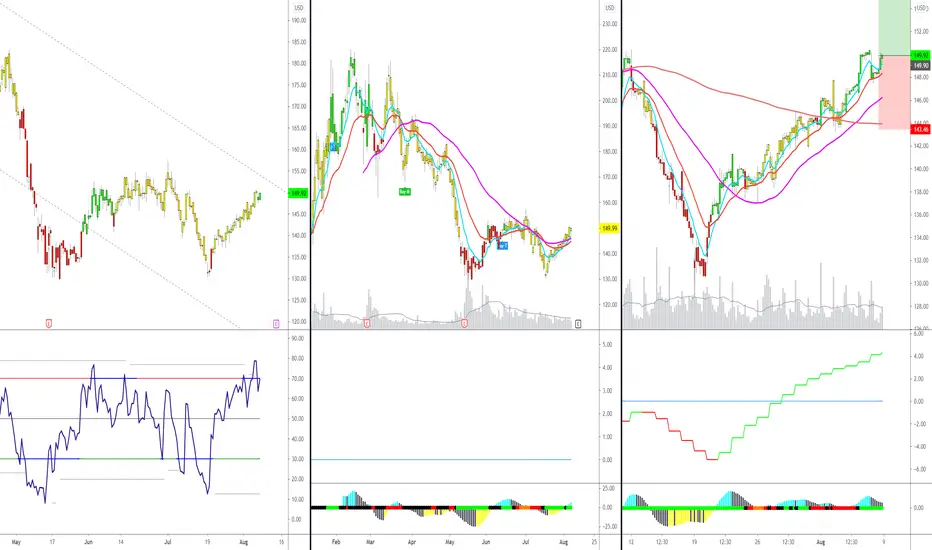
Technical 50-200-50 maneuver long setupMoxie Long hourly setup. This setup is based on 50-200-50 maneuver (Price crosses the SMA50, rejected by SMA200 and tests the SMA50 again, long when it clears SMA200)
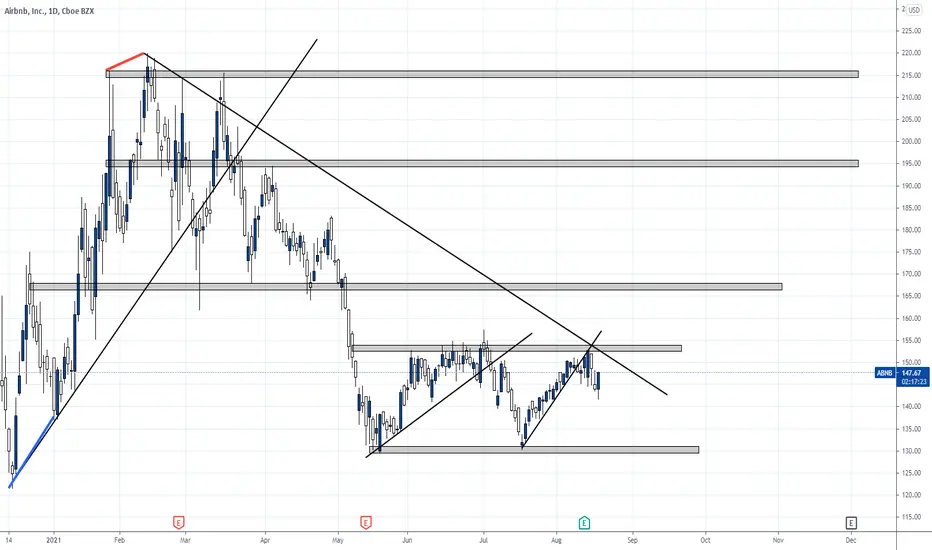
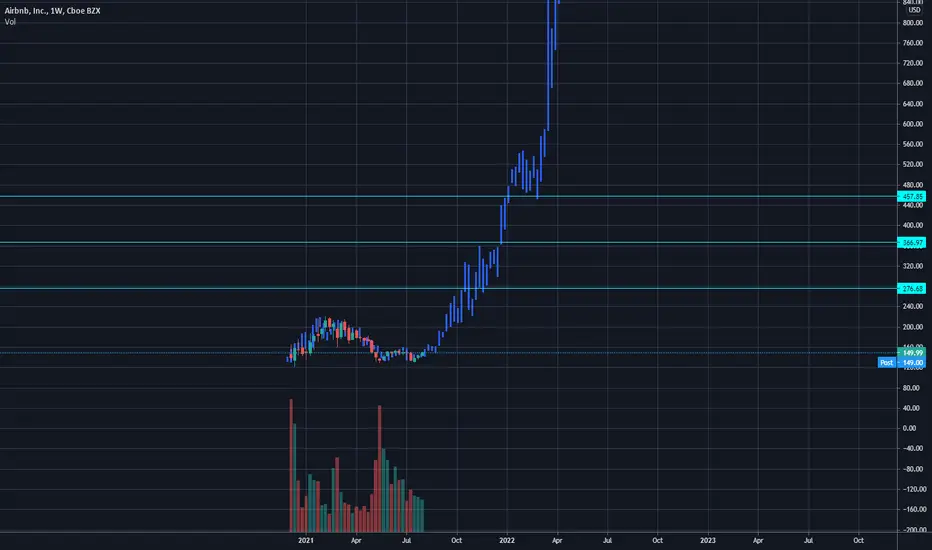
Airbnb (ABNB) We all know Airbnb,
no matter where you are, by opening the app you will surely find accommodation.
This simple idea has led Airbnb to have a Market Cap superior to the most important and historic chains in the Hotel sector, such as Hilton, Marriot, or Accor.
The IPO that arrived in December 2020 immediately had a big boost after the first week of trading, as often happens.
Between February and March, we had a double top, followed by an important descent that ended in May, also accompanied by negative ROI and P / E below expectations, but obviously, data conditioned by what is happening in the world.
After the double low in July, I was expecting the break of the resistance trendline, which then took place on July 30th.
We are facing a possible trend reversal that will have to be confirmed by the breakout of the price level of $ 157.49.
As far as I'm concerned, this is not short-term trading, but a long-term investment.
I believe in the company, in its fundamentals, and in its growth.
Considering the global scenario, with a pandemic not yet completely overcome, for my portfolio, it was time to insert ABNB.
We are close to the Earnings, I intentionally entered first with a part of the investment. Should the price fall, the important levels to buy are $ 130 and $ 121.
For those interested in medium-term speculation, the levels where to take profit in my opinion are:
- $ 170
- $ 190
- $ 216
A few important statistics as of August 8, 2021:
Short Float: 5.16%
Average analyst target price: $ 173.68
RSI (14): 60.57
Performance Half Y: -23.20% (last very important figure, considering the potential of the company, let's always remember the words of Warren Buffett: Try to be greedy when others are scared, and scared when others are greedy).
Lazy Bull
ABNB fractalFound the PA going on with ABNB to be similar to what happened with ZM early on. Earnings coming up next week. Keeping a close eye on this one.
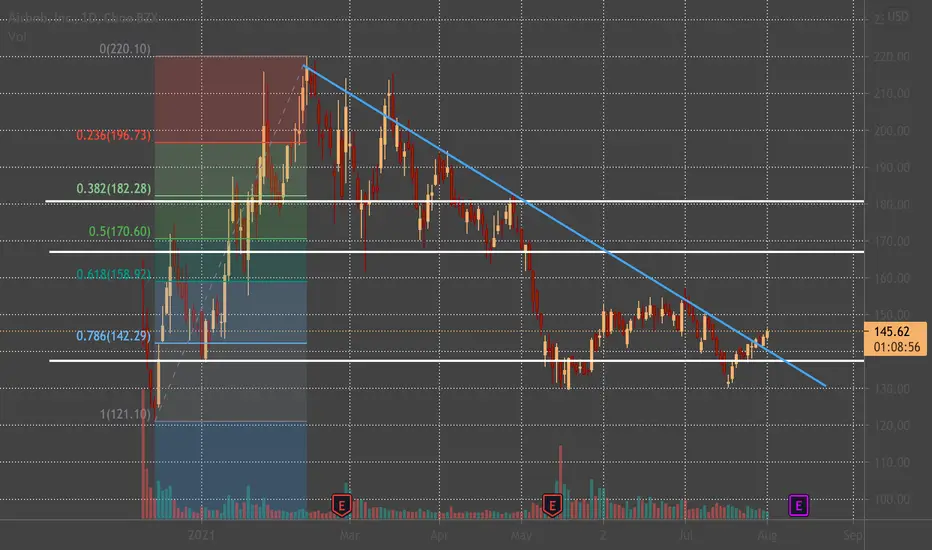
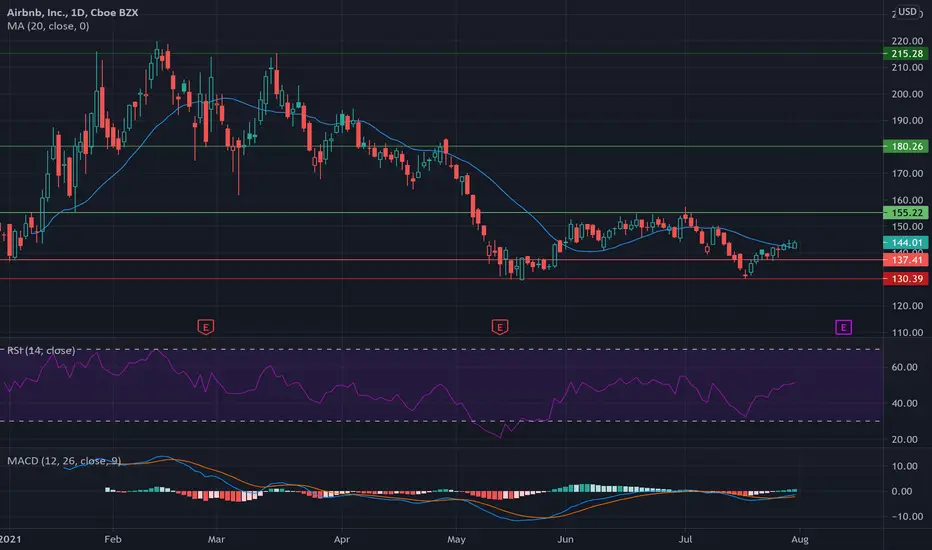
ABNB with a double bottom pattern?!Airbnb!! This might indicate the beginning of a reversal! The only thing issue regarding this analysis is that, it would have been better if the distance from the 2 bottoms were more than 3 months. Besides this, it looks pretty clean! And i'm liking this 0.786 region.
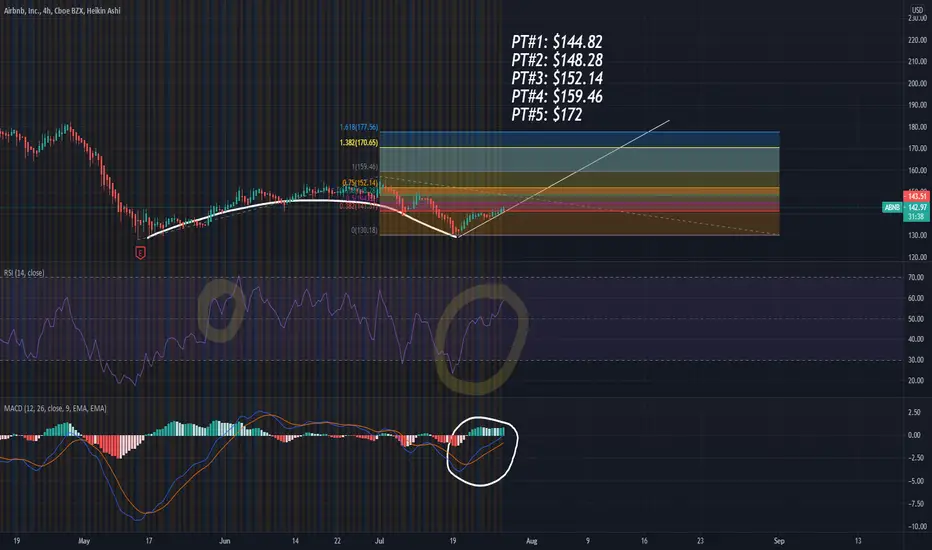
$ABNB - Major Buy Zone! -4 HR Timeframe
-Inverse Cup and Handle
-MACD = above signal
-RSI = Sexy af and room to run
-Price targets labeled
-Set S/L (stop loss) at $119.61
Calls:
$145c 8/6 (3.00)
$148c 8/6 (2.00)
$155c 8/6 (0.69)