Who is buying this? I do not trade stocks because they do not live in the real world. They live in lala land where PE no longer matters. Reality has taken a back seat to FED jawboning and flagrantly cooked up jobs numbers. That being said, there are some opportunities that are too tempting to pass up!
I do not even know where to start...
This one really smells... from insiders dumping to the basic fundamentals around Airbnb. Airbnb has no moat! Assigning the majority of the vacation rental market to its market cap is lunacy. Competitors have already begun to take back market share offering the same exact listings with more competitive fee structures.
Personally as a former Super host and and avid traveller I can state first hand that my experiences with Airbnb have gone from bad to worse. The percentage fees they charge both the host and the guest are outrageous when you consider what you actually receive from the platform... Nothing!
In addition to user experience, the general view on STRs has shifted. This has created a difficult landscape for hosts and the platform as governments have regulated and outright banned the platform.
Fundamentals of the business aside, the macro back drop for travel are bleak. The S&P is at all time highs but if you pop the hood the reality of the real economy is bleak. Savings are almost at record lows while credit card debt is at record highs. I can go on....
Personally, I am salivating at the prospect that some poor soul will continue to buy Airbnb and let me borrow their shares at the 140 level.
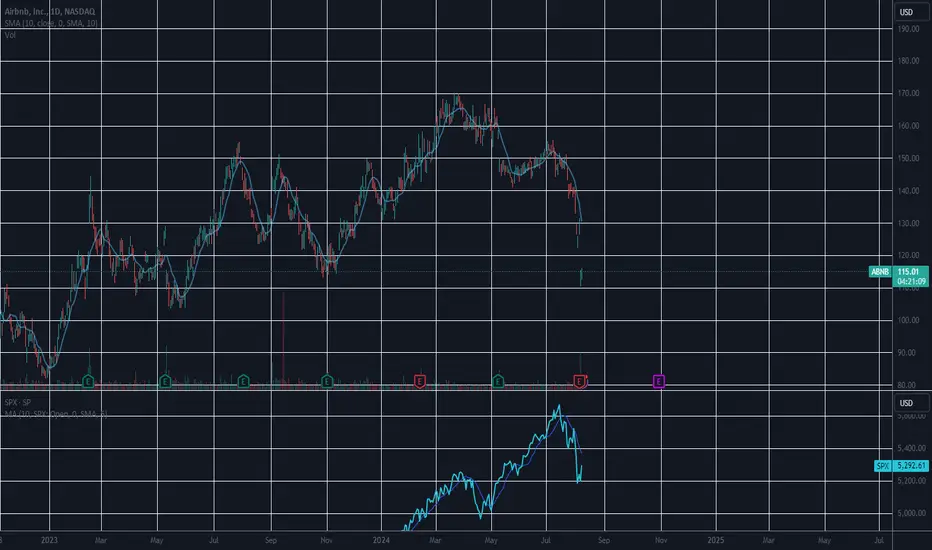
If you are a believer in a "soft landing " I would approach this as a pair trade
Historically 50 basis point cuts are BEARISH. They are a sign of panic by the fed. If the US does enter a recession travel will be one of the hardest hit sectors.
$140-$155 is the zone in which I will build my short position.
ABNB trade ideas

Airbnb year's end rally?It's a beautiful horizontal correction over the last couple of days. If it breaks to the upside I enter long and expect another impulse move to the upside.
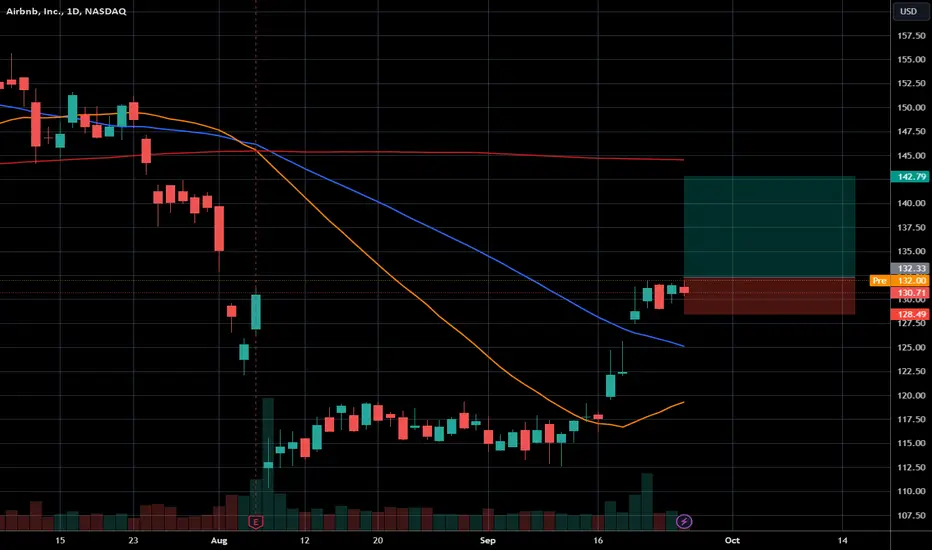
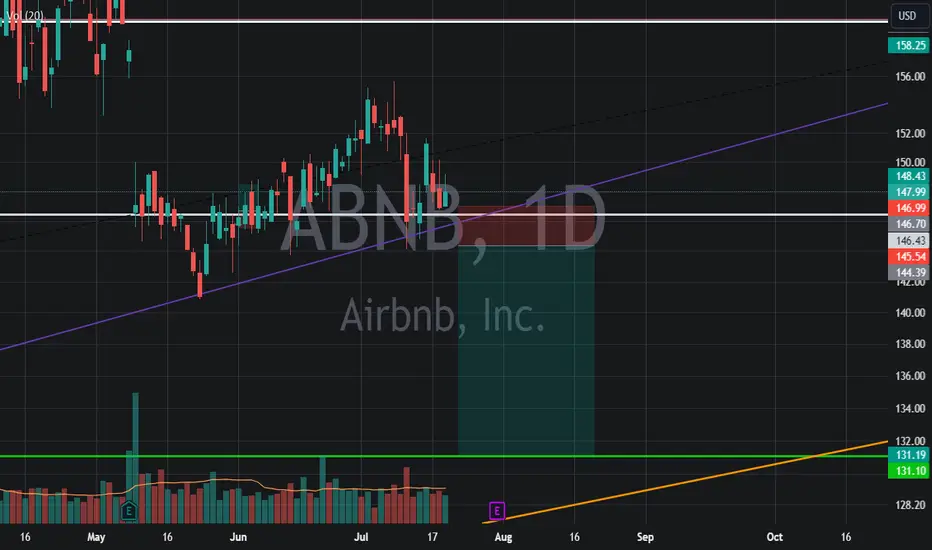
ABNB short term short & a trading system development ride alongSo I'm not one to short. For a lot of reasons. I HATE margin. It's like a credit card where the things you bought can go up in price after you buy them, you're charged interest on them immediately, and the "credit card" company can require you to pay your bill early. As someone who has never in my life carried a balance on a credit card except accidentally, that is 100% NOT my style. Margin creates an added layer of complexity and difficulty to any trade it involves.
Add to that, shorting is potentially infinite in the losses it could create, whereas the gains are capped at 100%. Others may use it, but it's not for me and it is ESPECIALLY not for those new to trading. It is a ticking time bomb waiting to explode your finances and knock you out of the game, and possibly your home. To be honest, (unpopular opinion alert) if you can't afford to be trading your own money and have to borrow money to be able to trade, you probably should NOT be trading. OK, I'm done ranting.
What I am about to describe has to do with the process of how I decided to do this trade. I'm going to leave out some of the details, because
a) a trader's gotta have his "secret sauce"
b) a lot of you are new to the game and if I told you all I know about what I'm gonna do, and especially WHY, you'll take it the wrong way.
DISCLAIMER: DO NOT TRADE THIS WITH ME.
This is an unproven system. My regular system works great on long trades, but historically not that great on shorts. That's not entirely surprising since the market has a general upward bias to it. There's more reasons why, but you don't get to know those (secret sauce).
The system I'm working on for shorts did evolve out of my original system, though. I am a person who when something I try doesn't work, I have to know WHY. And I think that's good advice for traders developing a trading system (or more importantly, following someone else's fancy charts that you don't understand).
If you make a trade and it doesn't work, you should make sure you know WHY. Don't blame it on the market or the Fed, or shorts, or whoever. If a trade goes wrong, YOU potentially made a mistake somewhere. And that's ok. Sometimes they are unavoidable mistakes. But sometimes they aren't, and you owe it to yourself and your system, to understand what went wrong so you can fix it if it's fixable.
So this system I'm testing "live" in front of you, began as I tried to answer the WHY of my system not doing well on overbought calls the way it did on oversold. I noticed a curious feature of the overbought calls it made, and asked "is that consistent enough to be tradeable?" If not, I had to go back to square one. If it was, the only way I'd know for sure is to backtest it to death. And I have been, for months.
I had to tweak some things, but here we are, so obviously it passed that test. The next question became HOW to trade it. I started with a rant about margin and that's the simplest way to trade shorts, in many ways. I knew that was not for me though, so it left me two options. Pun intended.
One was inverse ETFs that move the opposite direction of the underlying stock or ETF. The problem is that not all stocks have them and the ones that do, often trend HARD and that's not good for what I'm trying to do. For some of the ETFs it works OK and I'll probably use them from time to time here as I work out the kinks of my system.
The other option is put options. Both inverse ETFs and put options do something important for shorting, and that's limit your losses. You can only lose 100% of an option or ETF, and that levels the odds out a little bit with shorting. Options, however, introduce TIME as a variable, making things much more complicated. Now, in addition to being right that the stock is going down, I have to know WHEN as well. That's why ordinarily I don't use options as much.
Sometimes the market has ideas for a stock that are VERY different from my own and trades that normally work out in a few days, end up taking much longer (see my idea on NYSE:BROS as an example of that happening).
With options, every day that trade takes costs me money because of time decay. But I'm going to use options here, because my backtesting tells me that 1) time usually shouldn't be a factor and 2) the leverage in options (in THIS case) can help minimize the effects of the times a trade doesn't go according to plan.
My backtests on ABNB and other stocks, tells me how long a trade will likely take to work out. That's important information to have when choosing WHICH put option to trade. It also affects the strike price I choose. I'll be honest when I say I'm not sure I have chosen the optimum options strategy, expiration and strike here - and that's a big reason why you shouldn't trade this with me. If I make mistakes it will cost me money. You can learn from my mistakes for free by just following along.
So for ABNB, in its albeit short entire trading history, the short calls my short system made worked out positively the vast majority of the time and the trade generally took less than a month to play out. For this reason, I chose November 15 expiration. It gives time for the trade to work out before time decay really starts costing me money, since decay accelerates closer to expiration. I could have gone out further to avoid decay, but nothing comes for free in the markets - I'd have to pay more for the option.
I chose puts as close to the current price as possible, because the trades I'm looking to make aren't 20 or 30% moves in the stock. They are relatively small gains like my long system that pay off in volume rather than size of the wins. I won't go into a full discussion of options pricing. I'm not the guy for that anyway.
The mechanics of the trade are different than my long trades. Here, only one lot will be purchased. I will hold it simply until the stock price is lower than when I originally made the trade. If it never gets lower, I could lose 100% of the money I spent on the option unless I cut the trade short - and that is a non-zero possibility that I understand going into the trade. But like my long system, the winners should collectively compensate for those and interestingly, that was part of the reason I choose options. That would be much harder to do here with just shorting the stock because the changes in price here are smaller than with my long method. They will be shorter trades as well, in most cases.
So today, at the close, I purchased the November 15 $130 put on ABNB for $6.90 ($690 dollars). As soon as ABNB stock is below 131.18 as it approaches the close, I sell it. If that's Monday, it's Monday. If it's a week from now, fine. Longer than that and I'll start getting "nervous" because if it takes longer than a week, things become a little bleaker for the trade's prospects.
So there it is. Good luck to me, not you because you're just spectating. I'll update things as the trade plays out and will do a post-trade analysis however it turns out. Enjoy your weekend!
If you have questions or comments about anything I've written here, feel free to comment and I'll answer them as soon as I can.
This is obviously market-based financial edutainment and is aggressively NOT investment advice, as I think I've made clear here. Not only do I not encourage you to trade it, but if this trade works as expected, you won't be able to successfully at this point. Just enjoy the show, everyone. 🍿🥤
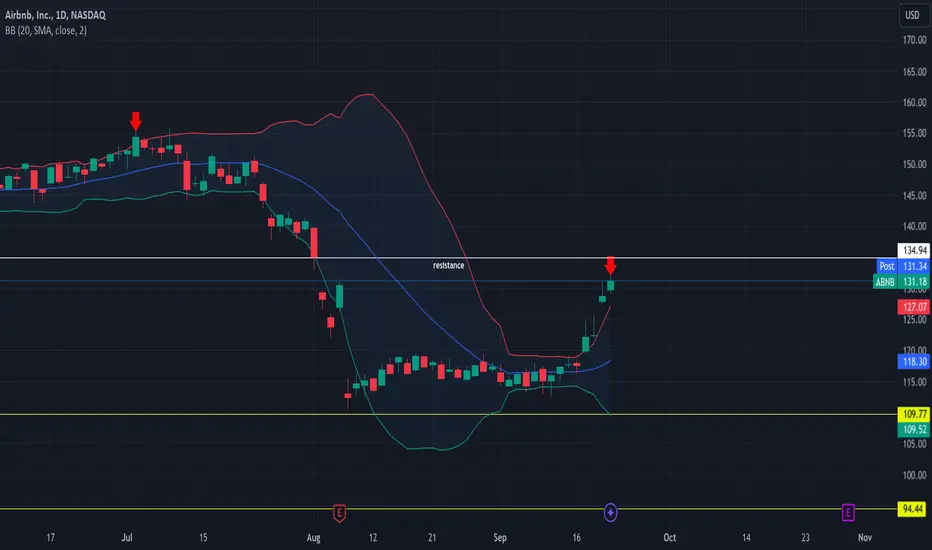
Airbnb (ABNB): Holding the line, but for how long?!After charting Airbnb one month ago, we’ve seen another slight dip, and one of our members rightly pointed out that Airbnb has reacted well to the $113.60 price level. This level has acted as support for the fourth time now, and it seems like it could hold. However, t here’s a big BUT —we’re not placing an entry just yet. Trying to catch the exact bottom of Wave 1 can be risky and extremely difficult. Instead, we are more focused on waiting for a possible short opportunity if Airbnb rises again.
Airbnb continues to struggle, and we don't want to catch this falling knife too early, risking unnecessary losses. We’ll keep monitoring the situation closely, and if we gain more confidence that this is indeed the end of Wave 1, we’ll let you know. 🫡

Airbnb (NASDAQ: ABNB) Shares Surge on Bullish SentimentShares of Airbnb (NASDAQ: ABNB) surged by 5.8% during early trading after Bernstein SocGen Research Group reiterated a 'Buy' rating on the stock. Despite recent pessimism, analysts argue that the market is undervaluing Airbnb’s potential, highlighting that revenue growth could surpass 10% with stable margins. However, after an initial jump, the stock settled at $122.08, up 3.9%, suggesting the market views the news as positive but not transformative.
Technical Outlook
From a technical standpoint, Airbnb’s stock has experienced considerable volatility over the past year, with nine moves greater than 5%. The stock recently broke out of its downward trajectory and is now in a rising trend, supported by a Relative Strength Index (RSI) of 55. This reading indicates a balanced position—neither overbought nor oversold—pointing to more potential for upward momentum.
Adding to this bullish technical setup is the broader performance of the NASDAQ Composite Index, of which Airbnb is a part, currently up 19% year-to-date. This signals a strong market environment for tech and growth stocks, giving additional tailwinds to Airbnb's potential rise.
Market sentiment is also keyed on Jerome Powell’s upcoming announcement regarding a potential interest rate cut. A favorable decision could further fuel Airbnb's momentum, making the stock more attractive to investors seeking to capitalize on lower borrowing costs.
Fundamental Drivers
While the technical outlook is promising, Airbnb’s fundamentals offer a more mixed picture. The stock is down 9.2% year-to-date, trading 27.4% below its 52-week high of $168.18. Investors who bought Airbnb shares during its IPO in December 2020 would now be looking at a 15% loss. Despite these challenges, Airbnb remains one of the most profitable tech companies globally, boasting impressive free cash flow generation and a vast network of over 8 million hosts.
However, its recent earnings call raised some red flags. The company reported a 16.6% drop in stock price after missing Wall Street’s bookings and revenue guidance expectations. Additionally, Airbnb has signaled slower revenue growth for the second half of 2024, with a slight 1% downward revision in growth projections and a softened EBIT margin outlook due to stagnant development in its take rate.
That said, CEO Brian Chesky has outlined key strategies to unlock what he calls "optionality value." This includes making hosting easier, expanding the "experiences" segment, and increasing event-based short-term rentals, like during the Paris Olympics, where Airbnb offered 150,000 homes. These initiatives could provide new avenues for growth and help the company diversify its revenue streams.
Valuation and Future Prospects
Airbnb’s current valuation sits at a fair value estimate of $120 per share, suggesting it’s slightly undervalued. However, its growth trajectory will heavily depend on its ability to successfully expand beyond its core offerings in home-sharing and capture new revenue streams, such as event hosting and cultural experiences.
The stock's potential for further growth is reinforced by its strong global presence and its position as a disruptor in the travel industry. As consumer trends shift, especially among younger generations, the "sharing economy" model that Airbnb spearheaded will likely continue to gain traction. In particular, regions like Southeast Asia and Latin America show promising user growth for accommodation-sharing platforms.
Conclusion
While Airbnb’s stock has been volatile, With solid cash flow, a robust global network of hosts, and initiatives aimed at unlocking additional value, Airbnb (NASDAQ: ABNB) is positioned to benefit from both macroeconomic trends and internal strategies. Investors should closely monitor key developments, including potential interest rate changes and the success of Airbnb’s diversification efforts, to gauge the stock’s future trajectory.
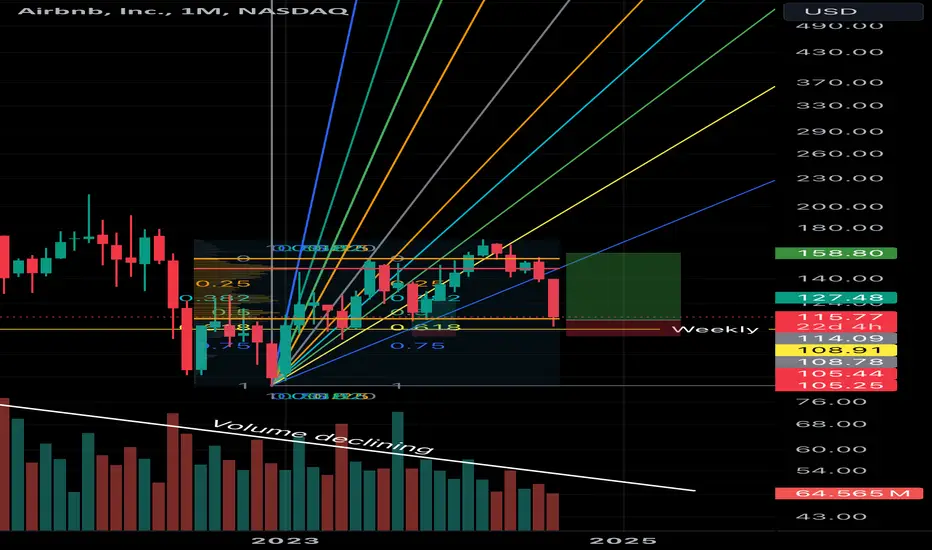
Airbnb Inc (Extended hours) | Chart & Forecast SummaryKey Indicators on Trade Set Up in General
1. Push Set Up
2. Range Set up
3. Break & Retest Set Up
Active Sessions on Relevant Range & Elemented Probabilities;
* Asian(Ranging) - London(Upwards) - NYC(Downwards)
* Weekend Crypto Session
# Trend | Time Frame Conductive | Weekly Time Frame
- General Trend
- Measurement on Session
* Support & Resistance
* Trade Area | Focus & Motion Ahead
# Position & Risk Reward | Daily Time Frame
- Measurement on Session
* Retracement | 0.5 & 0.618
* Extension | 0.786 & 1
Conclusion | Trade Plan Execution & Risk Management on Demand;
Overall Consensus | Neutral
ABNB FORECAST Reasons for execution
1)PML LIQUIDATED
2)+ChoCH
3)0.236 Fibonacci
4)+OF & +Fvg
5)1.618 Fib Expansion
Airbnb, Inc. (NASDAQ: ABNB) Airbnb's stock has shown resilience in the market, backed by steady revenue growth projections and a strong balance sheet with minimal debt. However, the company faces challenges that could affect its short-term earnings, leading to a cautious outlook from analysts.
Technical Indicators:
Relative Strength Index (RSI): The RSI stands at 36.09, indicating that the stock is approaching oversold territory. This could signal a potential buying opportunity for investors if the RSI dips further below 30.
Moving Averages: The stock is currently trading below its 50-day and 200-day moving averages, suggesting a bearish trend. However, if it manages to break above these resistance levels, it could indicate a bullish reversal.
Valuation Metrics:
Price-to-Earnings (P/E) Ratio: At 15.26, Airbnb’s P/E ratio is reasonable, suggesting that the stock is not overvalued compared to its earnings.
Price-to-Book (P/B) Ratio: A P/B ratio of 9.24 indicates that the market values Airbnb well above its book value, reflecting investor confidence in the company's growth prospects.
Price-to-Sales (P/S) Ratio: With a P/S ratio of 7.03, the stock is priced for growth, albeit at a premium.
Growth Projections:
Revenue Growth: Airbnb's revenue is projected to grow by 5.11% in 2024, with accelerated growth in the following years, reaching 28.13% by 2026.
Earnings Growth: Despite revenue growth, earnings are expected to decline by 8.84% in 2024 before recovering with a 14.81% growth in EPS by 2025.
Airbnb is a stock with both potential and risks. Investors should closely monitor its earnings reports and market conditions. For those with a long-term horizon, the stock's current levels could offer a good entry point, especially if it dips further into oversold territory.

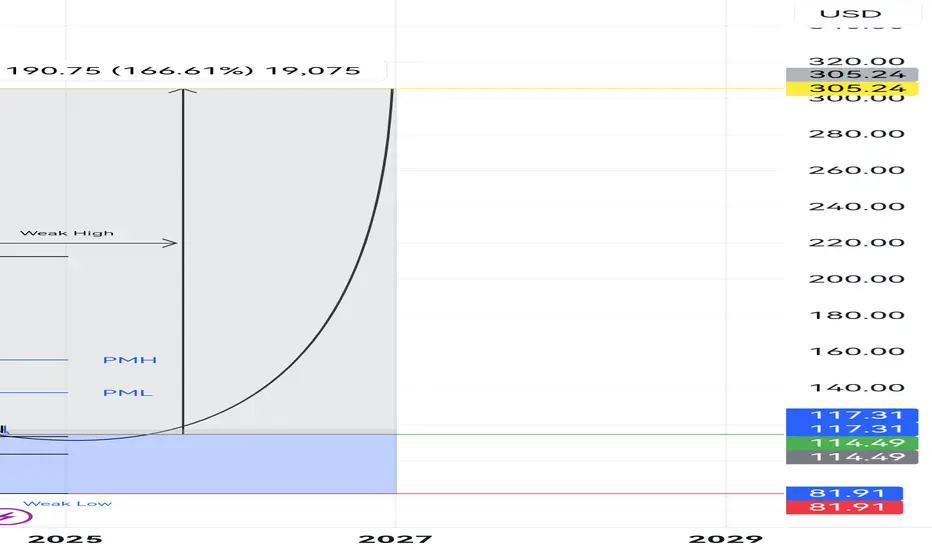
Buy opportunity coming up on AirbnbHello,
A buy opportunity is setting up on Airbnb.
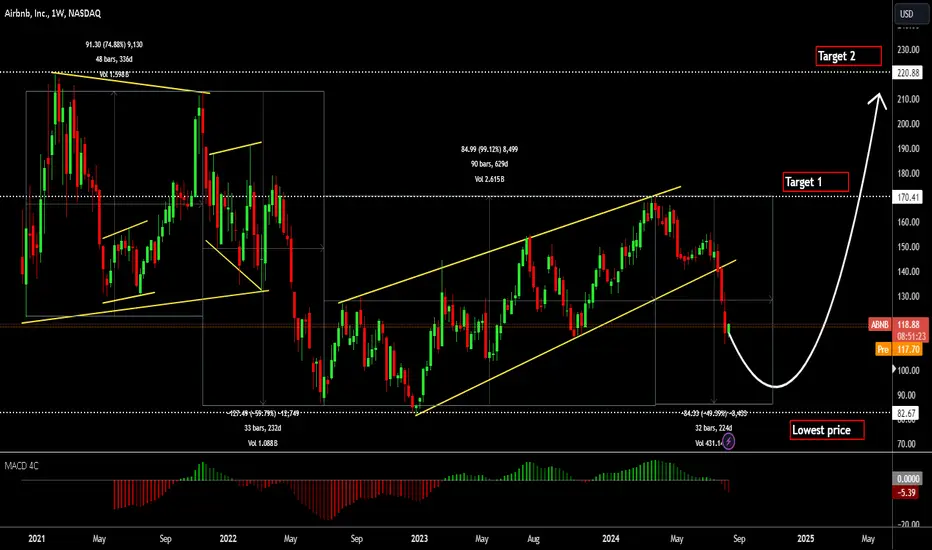
Company: Airbnb
Principal stock exchange: Nasdaq
description: Airbnb, Inc. engages in the management and operation of an online marketplace. Its marketplace model connects hosts and guests online or through mobile devices to book spaces .
Ticker symbol: ABNB
Current price: USD 118.88
Buy price: USD 100
Target price: 220.88
Outlook
Airbnb remains cautiously optimistic about future travel demand. Despite challenges in the market, Airbnb's disciplined cost management and strong brand positioning are expected to support continued profitability.
Recommendation: Hold
Current Price: USD 118.88
Buy Price: USD 100
Target Price: USD 220.88
Given the recent financial update, Airbnb presents a mixed picture. While the company has demonstrated resilience in the face of macroeconomic pressures, particularly in regions outside of APAC, the slowing growth in booking volume and the ongoing challenges in Asia Pacific suggest that the near-term upside may be limited.
Reasons to Hold:
Moderate Growth Outloo k: While Airbnb continues to grow, the deceleration in revenue and booking volume growth, coupled with macroeconomic headwinds, suggests that the stock might face some volatility in the short term.
Strong Long-Term Potential : Despite the near-term challenges, Airbnb's strong brand and dominant position in the global travel market support a positive long-term outlook. The target price of USD 220.88 reflects significant upside potential if the company can navigate current challenges and capitalize on future growth opportunities.
Profitability and Cost Management:
Airbnb's disciplined approach to cost management and its focus on profitability are encouraging. The expected adjusted EBITDA margin, although slightly compressed, still reflects a strong financial foundation that should support long-term growth.
Action:
Should the stock price decline towards the buy price of USD 100, it may present an attractive opportunity to accumulate more shares, particularly if long-term growth prospects remain intact.
Good luck!!
#ABNB on daily chart On the daily timeframe, we can observe a rebound from the demand zone identified on the weekly timeframe. Additionally, an inside bar pattern has formed, and the price has reached the lower Bollinger Band, coupled with an oversold condition on the RSI. All of these factors suggest a potential upward price reversal.

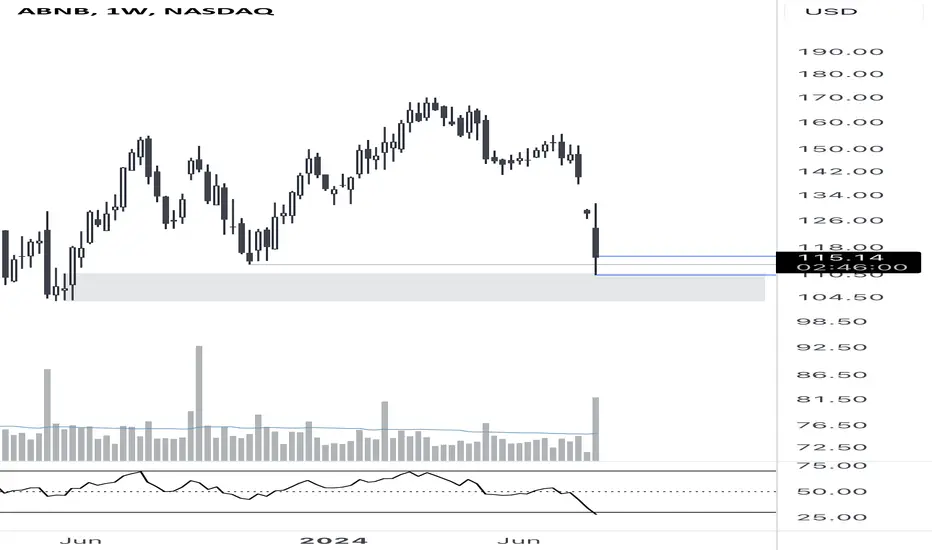
ABNB Weekly & Daily Timeframe In this analysis of #ABNB on the weekly timeframe, the price has reached the demand zone marked by the gray rectangle, indicating a potential area of buying interest. Additionally, there is a ("False Breakout") below the lower boundary of the demand zone at 113.23, where the price briefly dipped below this level before returning inside. This false breakout suggests that the recent downward movement might not be sustainable.
The trading volume has increased as the price attempts to move back above the demand zone, reinforcing the significance of this area as potential support. The RSI (Relative Strength Index) has reached an oversold area below 30, indicating that the stock may be experiencing excessive selling pressure.
See the next chart for daily analysis.
$ABNB (Potential Bullish Reversal)Aug 8, 2024: EOD price $114.63
- Monthly: the stock price has fallen 18%
- Weekly: price retraced to fib 61.8% (bullish range: 12/28/22 - 03/21/23)
- Daily: RSI is under 24, MACD is still red to the downside
- 4hr, MACD is curling up (same with RSI); inside candle, above open at $113.98
In call options: NASDAQ:ABNB $118c exp 8/16/2024 @ $1.14.
Delta: 30 | Gamma: 6.7 | Theta: -12.69 | Vega: 5.88
Entry: $114.51
Target Price (TP): $119.99 (50%+ on contract)
Stop Loss: $113 (50-60% on contract)
Reward-to-Reward: 3.42-to-1 ratio
Next Steps:
- Monitor trade tomorrow, Friday, Aug 9
- Monitor /ES & /NQ to ensure price doesn't reverse on me drastically
- Keep TP and Stop Loss

From penthouse to outhouse Beaten down heavily due to a slowdown in consumer travel. But this is a very good long term growth company that has a strong moat and good free cash flow. Not the worst place to open up a position if you’re happy to employ the dollar cost average approach.
I went long at the dip. We were at the VAL and the weekly.
Stop loss just in case it turns bearish, which is always possible given the strong downtrend.
Not financial
Advice!
Clear Buy opp ABNB (Shorterm/MidTerm) Fundamental
- Stock earnings are increasing
- Stock outlook of earnings is positive
Technical
- Stock lays on a bottom. Seems that the support is given more than earlier.
- Large Buy order is spotted in the Volume. Impact is minimal.
Macro
- Renting is places is a growing trend. With travelling back to pre-level Corona times
this could be seen as a growth opportunity for the company.
Risk
- Understanding that all over the world people protesting RBNB because of rising housing prices makes it understandable that more regulation will deduct earnings in the future. But I expect the scale to be minimal.
- New Tax rules make it harder retain current costumers in European city's -- impact is unclear.
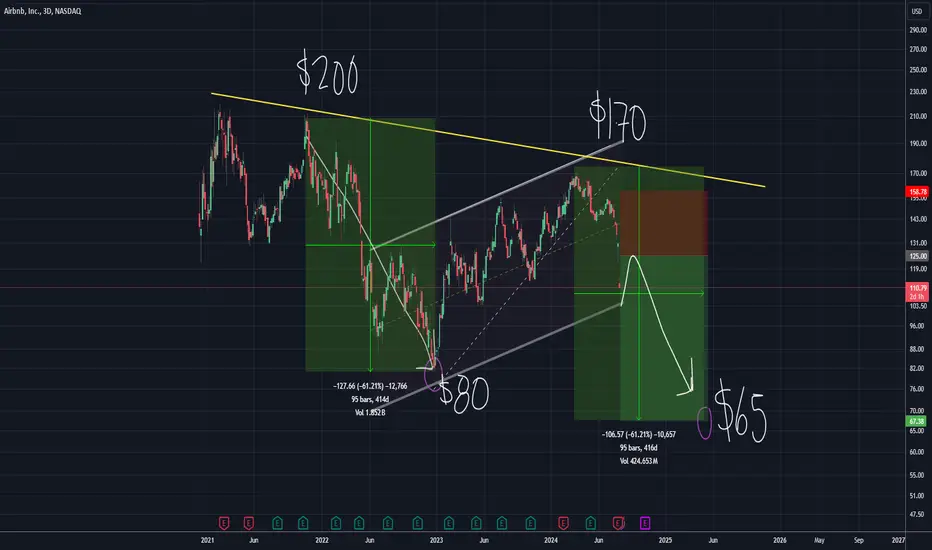
$ABNB Doomed: Stock to $50 (-50%) NASDAQ:ABNB Doomed: Stock to $50 (-50%)
Occasionally in your career, you get a really clear signal. The technicals, fundamentals, and narrative all line up perfectly.
I dislike this company, its business model, and the fact that it enables even more Boomers and private money to take family homes off the market. The hosts are adversarial, controlling, and almost certainly spying on you.
Airbnb can only thrive under the halcyon conditions of low interest rates, easy money, and consumers with disposable income. None of this is true, or likely to be true in the coming 24 months.
Americans are declaring bankruptcy at record levels, real wages haven't been lower in a lifetime, and inflation has reduced vacations and luxuries to a trip to McDonald’s. Not joking—a recent headline declared that nearly 80% of Americans consider McDonald's a luxury.
Many hosts are overburdened and overleveraged with mostly vacant properties. Unsurprisingly, hosts' profitability is sinking, and as soon as we see home prices or consumer sentiment start to shake, many of these owners are going to sell. This will fuel a spiraling doom-loop, driving the stock down to as low as $50 by next summer.
The trade: Rejection at the lower highs of '22 and '24 (in yellow) has set up the rising wedge we just broke down from. In the same way rejection at $200 in '22 saw a -60% move, I believe rejection at $170 this year has set us up for another leg down in a precipitous drop.
Short from $125 to about $65. If you're not already bearish and short, look out for a bounce and gap fill to $120ish, before brutal rejection below $100. Get some popcorn; it’s going to be wild.
Airbnb (NASDAQ: ABNB) Shares Plummet 14% on Earnings Miss Airbnb (NASDAQ: NASDAQ:ABNB ) shares experienced a significant drop of 14% in after-hours trading following the company's second-quarter earnings report, which failed to meet analysts' expectations. Additionally, the company cautioned about potential slowing demand from U.S. customers, raising concerns among investors about its future growth prospects.**
Earnings Miss and Revenue Growth
For the quarter ended June 30, Airbnb reported:
- Earnings per share (EPS): 86 cents (compared to 92 cents expected by analysts)
- Revenue: $2.75 billion (slightly above the $2.74 billion expected)
While revenue increased by 11% year-over-year, Airbnb's net income dropped to $555 million, or 86 cents per share, down 15% from $650 million, or 98 cents per share, in the same quarter last year.
Signs of Slowing Demand
Airbnb's management highlighted several areas of concern:
- The company anticipated a moderation in year-over-year growth in its key “Nights and Experiences” category.
- There were shorter booking lead times globally.
- There were signs of slowing demand from U.S. guests, a critical market for Airbnb.
Despite these warnings, the company reported that users booked 125.1 million Nights and Experiences, marking its highest second-quarter result to date.
Regional Performance and Quality Initiatives
Airbnb noted continued growth across all regions compared to Q2 2023, with Asia Pacific and Latin America leading the way. This regional growth, however, was overshadowed by the warning signs in the U.S. market.
To improve the quality of listings on its platform, Airbnb (NASDAQ: ABNB) has removed more than 200,000 low-quality listings since launching its “quality system” over a year ago. This initiative aims to enhance the user experience by ensuring higher standards for the properties listed.
Investor Concerns and Market Reactions
Investors are closely monitoring consumer behavior, especially given the Federal Reserve's stance on interest rate adjustments. The broader economic context has shown mixed signals, with companies like McDonald's reporting that consumers are feeling economic pressures, as indicated by a recent drop in same-store sales.
Airbnb’s forecast for third-quarter revenue ranges between $3.67 billion and $3.73 billion. However, the cautionary notes regarding future growth and demand have amplified investor concerns, contributing to the sharp decline in share value.
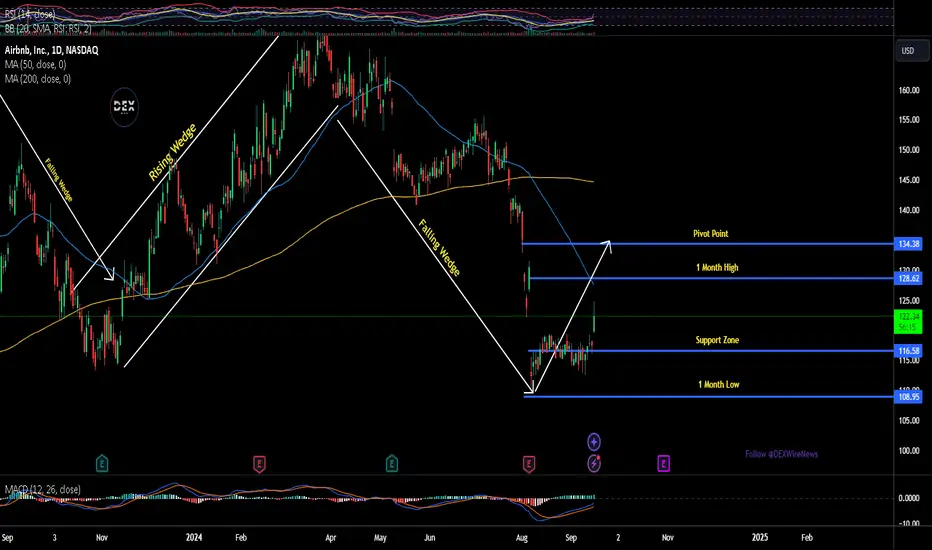
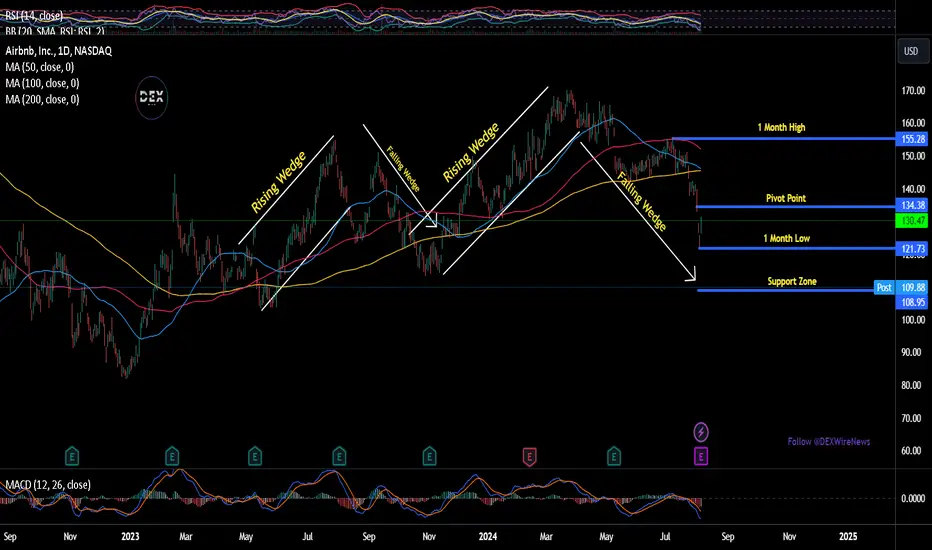
Technical Outlook
Shares of Airbnb (NASDAQ: NASDAQ:ABNB ) stock have experienced a 16% decline in after-hours trading, suggesting an impending gap down in Wednesday's trading session. The daily price chart reveals a consistent rising wedge pattern, swiftly succeeded by a falling wedge pattern, indicative of ongoing buyer-seller conflicts and offering insights into the stock's forthcoming significant milestone. Adding to the bearish sentiment surrounding NASDAQ:ABNB , the stock exhibits an after-hours Relative Strength Index (RSI) of 22, signaling unfavorable conditions for the stock's performance at the commencement of tomorrow's trading session.
Conclusion
Airbnb's second-quarter earnings report has stirred significant apprehension among investors, primarily due to its warnings of slowing demand in the U.S. market and the missed earnings expectations. While the company continues to see strong performance in regions like Asia Pacific and Latin America, the potential headwinds in its key market could pose challenges moving forward. As Airbnb navigates these complexities, the market will be keenly observing its strategic responses and any further signals of consumer sentiment.
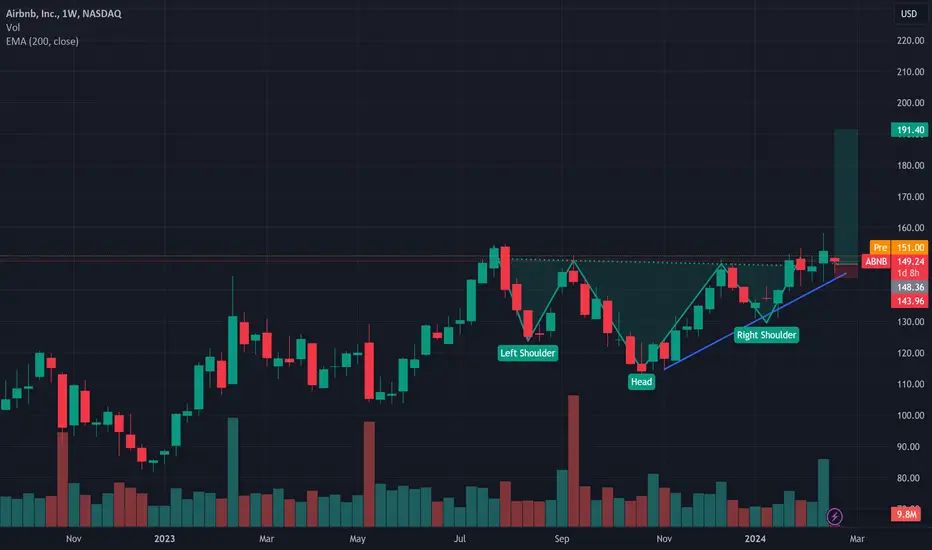
ABNB is ready to riseThere is an inverted head and shoulders pattern formed for ABNB and it should rise using the measured rule as a target
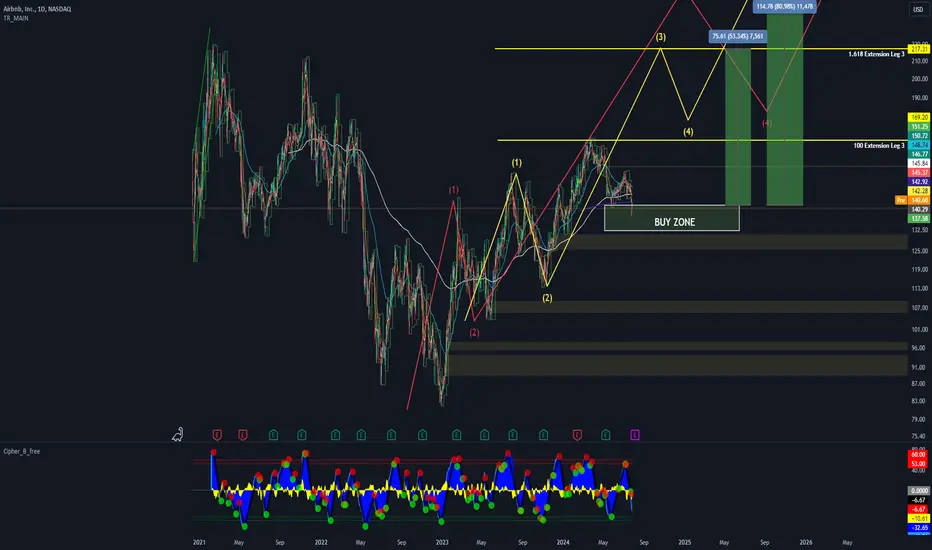
AIR BNBair bnb Buy Zone reached
LEG 3 internal structure
50% Retrace
Long Term Buy
50 - 100 % Gainer
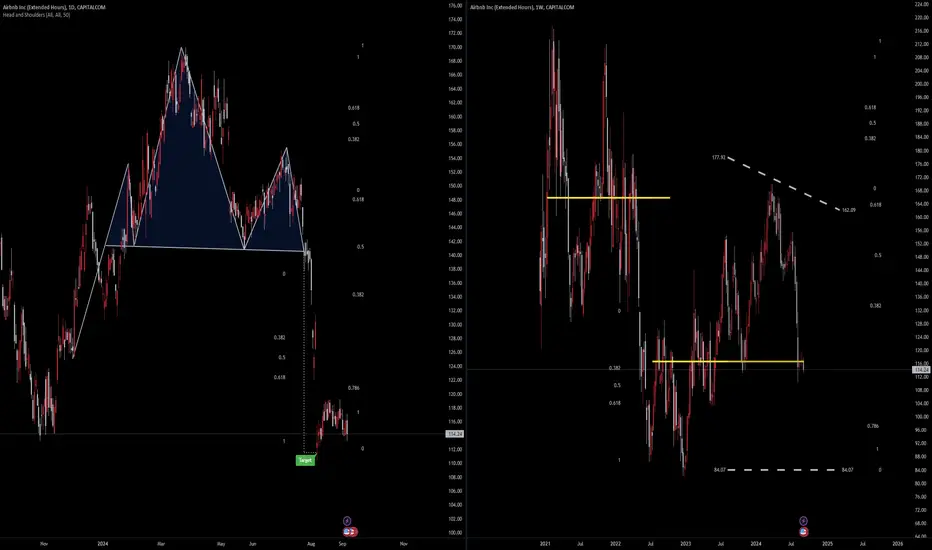
ABNB ShortWeekly head and shoulders. 1.619 retracement matches up with .50 retracement. Center of channel in a down trend
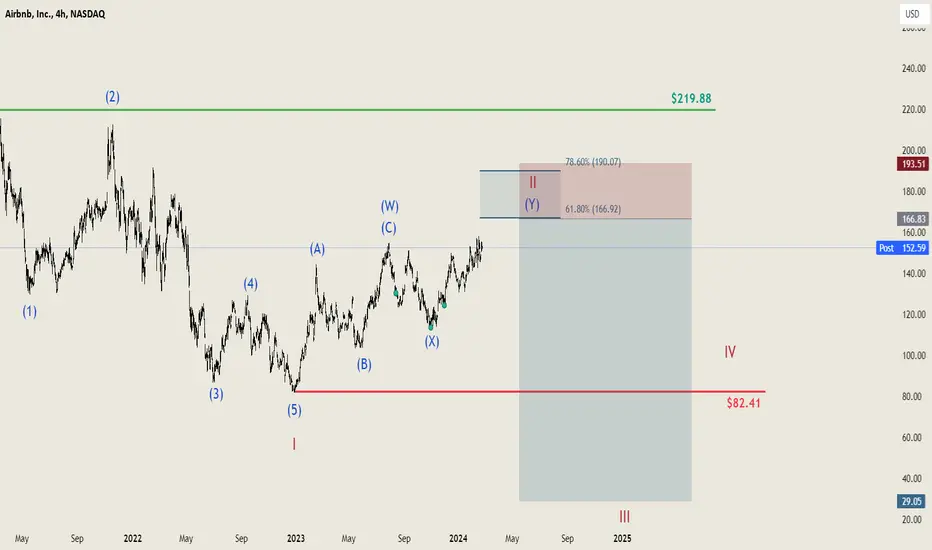
Airbnb (ABNB): Bleak Outlook or Potential Turnaround? 🏠Airbnb (ABNB): NASDAQ:ABNB
Airbnb's outlook appears quite bleak at a glance. We've experienced a break in the downtrend, and since January 2023, there has been an uptrend. However, we anticipate this might not last long as the complete cycle has not yet concluded. Since the IPO, the price initially surged to $220, then fell to $82. We now expect a rise towards a Y-Wave, or Wave II, hitting between the 61.8% and 78.6% retracement levels, equating to a range between $167 and $190. Following this, we predict Wave III will drop well below Wave 1's low of $82, potentially reaching around $30. It's important to note this is a multi-year scenario that won't unfold overnight. Still, it's crucial to be aware of the long-term perspective.
Should the price exceed the 78.6% mark, or $190, our scenario would be invalidated, indicating that the bottom was indeed found at $82.40. Until such a development, we anticipate a declining trend for Airbnb.
Airbnb (ABNB): Time to Short!I love Airbnb for vacations but this chart really isn't looking so good...
It is the only stock we are currently looking to short. Airbnb has consistently shown lower prices since its inception, despite a recent period of higher highs since hitting a low of $82. We remain confident in the continued downward trend.
The movements from point A to B and B to C align well with Fibonacci extension and retracement levels. The retracement for Wave (2) is particularly notable at the 61.8% level. We believe we are currently within Wave (3).
We want to time the short entry based on anticipated Elliott wave counts. We anticipate a further decline in the short term, followed by a potential rise in the coming weeks. We plan to place our short position during this anticipated rise in Wave 2. We will continue to monitor the price action closely and provide a detailed update with exact entry and exit points once we are ready to place the short position.

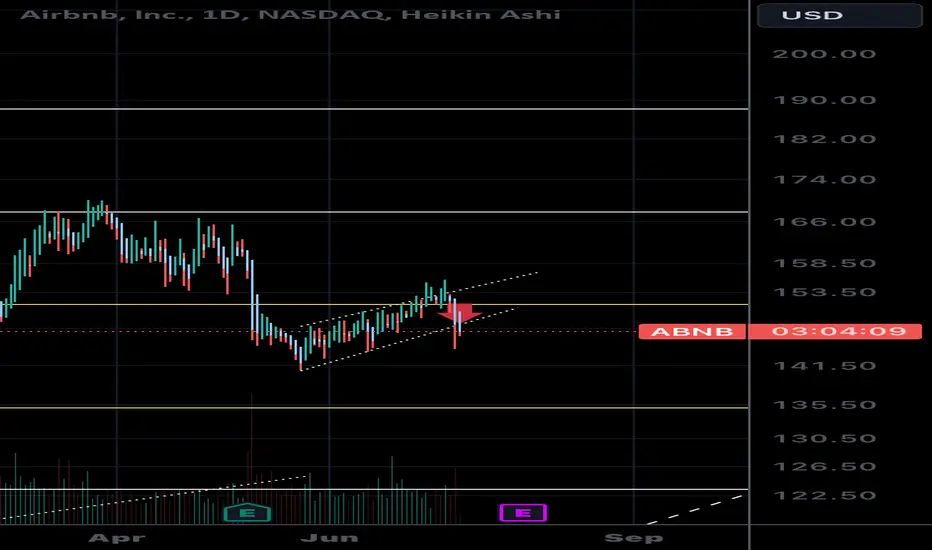
AbnbChanel breakdown around 148. Now potentially flipping into reistance. This looks like a rising channel or a bear flag. If bearflag target is 124)
Either way my exit plan is around 135 at the .618 fib support. I’m in at anything around 148 and I’ll add up to 149s
If we lose 145.60 and hold below that is another confirmation of further downside.
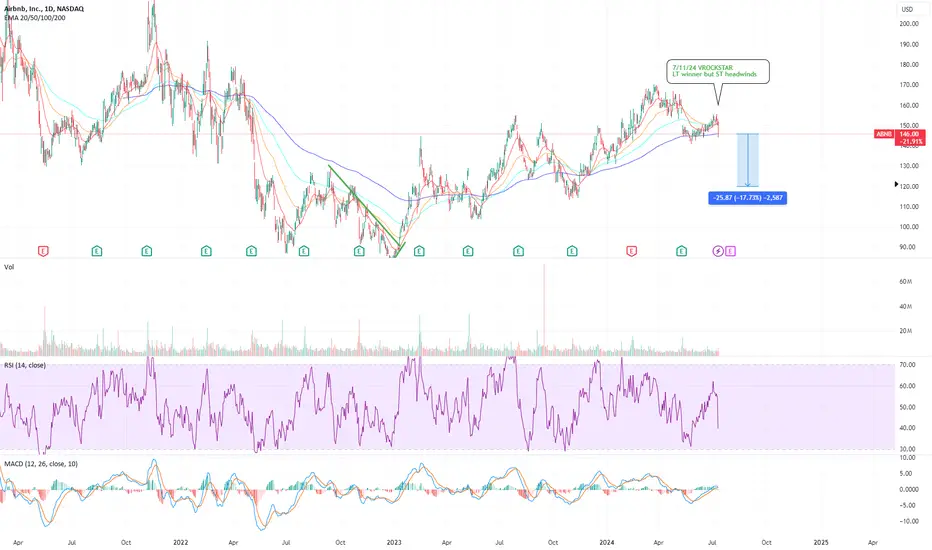
7/11/24 - $abnb - LT winner but ST headwinds7/11/24 :: VROCKSTAR :: NASDAQ:ABNB
LT winner but ST headwinds
- best in class
- generates healthy >4% fcf yield
- 30x PE (in theory) expensive - but opex leverage not normalized in this environment - PF # probably closer to mid 20s in a smoothed scenario
- size factor is ambiguous. 88 bn enterprise value not "small" (by any stretch) but also not a small cap that i tend to think r good beneficiaries of the current environment (read my take on AMEX:IWM from last night)
- even the chart showing higher lows and higher highs since the '22 low in tech stonks - that's good
- on it's equal weighted SPXEW pair looks sideways, unconvincing - this matters
- if i didn't need to own the stock i'd probably not in the current environment
- google trends are good/ not great - stalled bc of environment
trends.google.com
- i'd want to pick this up once we figure out what's happening w/ the rates picture. if this marches higher i have no problem letting it go - i don't think there's an obvious 10-15% upside here into YE w/o a lot of monitoring
- if we get some sort of risk off, this is probably a weak link esp having just dipped below the 200d EMA... last few times it did that we saw a bit more dippity dip. not my bread and butter - but i use TA as a layer to my above thinking.
- i like it more in the $120s. near $150 (like today) i'm ambivalent and see many other names that have better than low teens growth, cash generative, better GM's and trading cheaper than 8x. 6x. fine. 25x on current cons. PE. let's go.
- sidelines.
what do u think?
V