Adtran Stock Chart Fibonacci Analysis 080625Trading Idea
1) Find a FIBO slingshot
2) Check FIBO 61.80% level
3) Entry Point > 8/61.80%
Chart time frame:B
A) 15 min(1W-3M)
B) 1 hr(3M-6M)
C) 4 hr(6M-1year)
D) 1 day(1-3years)
Stock progress:C
A) Keep rising over 61.80% resistance
B) 61.80% resistance
C) 61.80% support
D) Hit the bottom
E) Hit the top
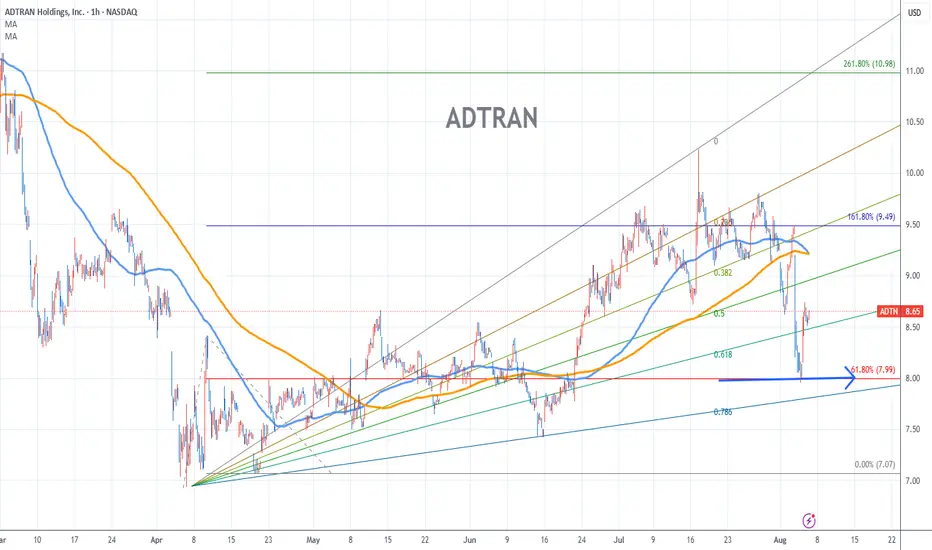
Stocks rise as they rise from support and fall from resistance. Our goal is to find a low support point and enter. It can be referred to as buying at the pullback point. The pullback point can be found with a Fibonacci extension of 61.80%. This is a step to find entry level. 1) Find a triangle (Fibonacci Speed Fan Line) that connects the high (resistance) and low (support) points of the stock in progress, where it is continuously expressed as a Slingshot, 2) and create a Fibonacci extension level for the first rising wave from the start point of slingshot pattern.
When the current price goes over 61.80% level , that can be a good entry point, especially if the SMA 100 and 200 curves are gathered together at 61.80%, it is a very good entry point.
As a great help, tradingview provides these Fibonacci speed fan lines and extension levels with ease. So if you use the Fibonacci fan line, the extension level, and the SMA 100/200 curve well, you can find an entry point for the stock market. At least you have to enter at this low point to avoid trading failure, and if you are skilled at entering this low point, with fibonacci6180 technique, your reading skill to chart will be greatly improved.
If you want to do day trading, please set the time frame to 5 minutes or 15 minutes, and you will see many of the low point of rising stocks.
If want to prefer long term range trading, you can set the time frame to 1 hr or 1 day.
ADTN trade ideas
ADTRAN (ADTN) AnalysisCompany Overview:
ADTRAN NASDAQ:ADTN is a leader in broadband access, fiber optics, and 5G technologies, providing high-speed connectivity solutions for service providers. The company is positioned to benefit from expanding fiber deployments and emerging defense and government contract opportunities.
Key Catalysts:
Enhanced Short-Term Unit (ESTU) Module ⚙️
ADTRAN’s new ESTU timing module is a game-changer for securing high-margin contracts in defense, space, and metrology. This innovation taps into a $700 million U.S. military communication market.
5G and Fiber Expansion 📶
As telecom operators accelerate fiber and 5G deployments, ADTRAN’s OSC-52v3 timing solution targets a $1.2 billion Total Addressable Market (TAM) through 2027.
Defense Contract Favorability 🛡️
Department of Defense (DoD) supply chain audits that prioritize domestic suppliers could further boost ADTRAN’s growth potential in the U.S. defense sector.
Sector Tailwinds 🌬️
The ongoing expansion of broadband infrastructure, driven by federal and private investment in fiber and high-speed networks, provides long-term tailwinds for ADTRAN’s core business.
Investment Outlook:
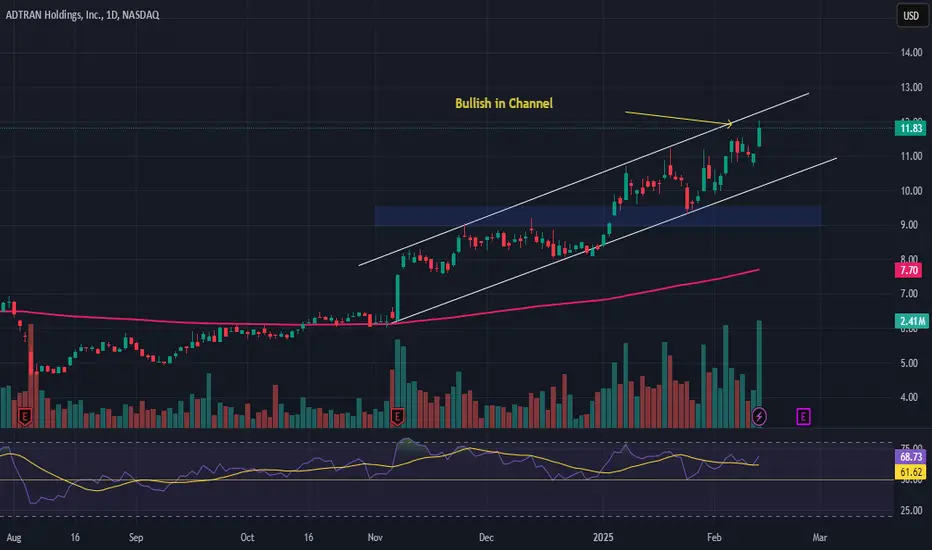
Bullish Case: We remain bullish on ADTN above the $9.00-$9.50 range, supported by product innovation, expanding defense market opportunities, and strong fiber/5G sector growth.
Upside Potential: Our price target is $16.00-$17.00, reflecting confidence in ADTRAN’s ability to leverage sector tailwinds and capitalize on defense and fiber deployment opportunities.
📢 ADTRAN—Advancing Connectivity with Fiber, 5G, and Defense Innovation. #Broadband #FiberOptics #ADTN
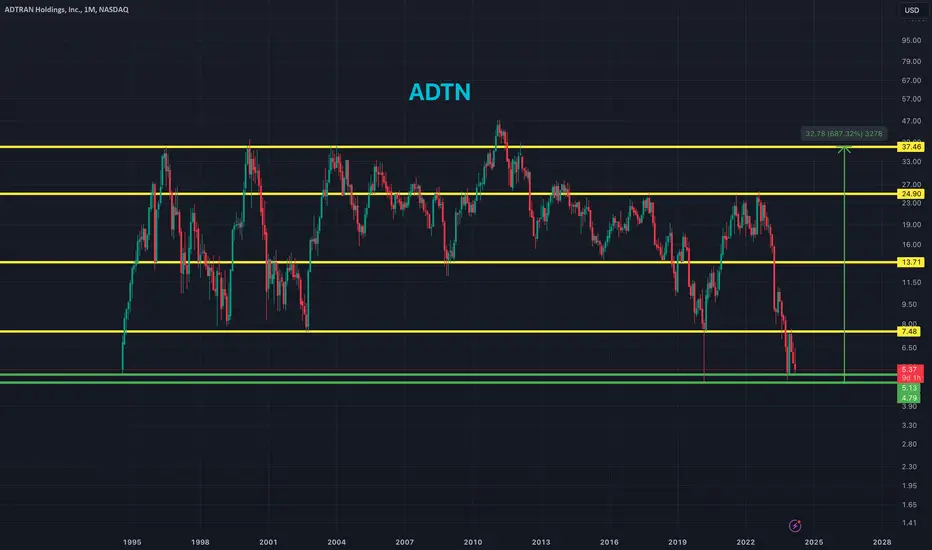
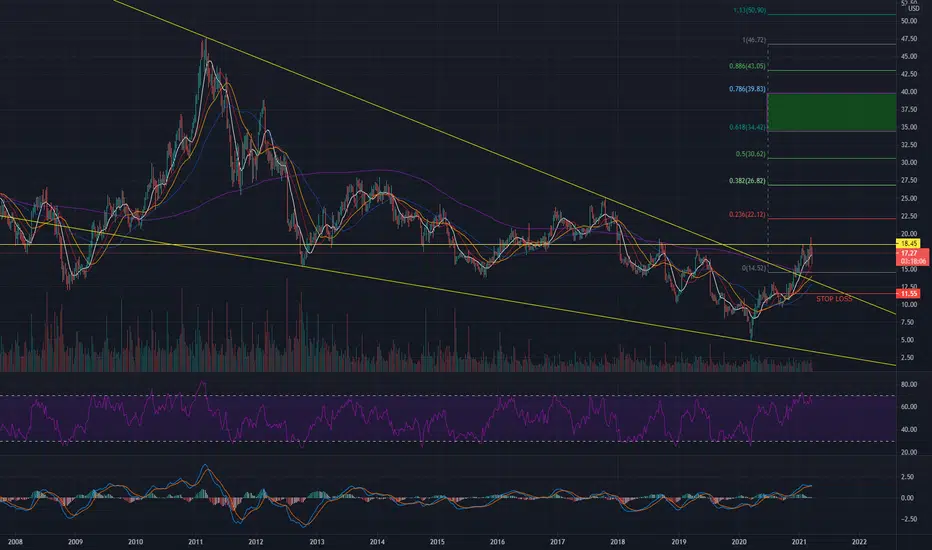
ADTN 680%+ Long-Term Trade With Risks to ConsiderADTN is approaching my buy zone between $4.79 and $5.13 near historic lows. There are four key price targets on the way up, and the highest price target gives a potential ROI of around 680% if ADTN is able to return back to previous all time highs. There are some financial risks and concerns surrounding ADTN so I recommend reading articles to better understand the situation.
Entry Price: $4.79 to $5.13
Sell Targets:
- $7.48
- $13.71
- $24.90
- $37.46
Stop Loss: $4.65
I do recommend a stop loss given the financial concerns for ADTN.
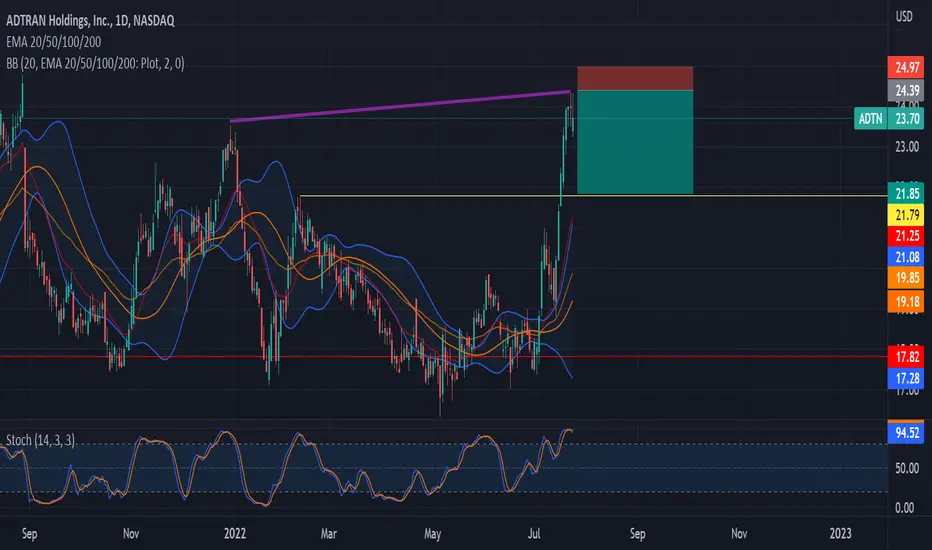
ADTN - Pullback - shortADTRAN Holdings, Inc. stock shows to be oversold on the stochastic oscillator (over 90). Moreover, We notice the presence of a bearish pin bar that is way above the Bollinger band of EMA as well as the 20 ema lagging far behind. Therefore, we anticipate that price will drop in retracement down until a potential resistance level in yellow.
Entry, stop loss... are shown in chart.
ADTN. Future Unclear. No Play.Trying to stay picky and take only the bull markets I know and love. The profitable plays are in obviously trending bull markets. When this is all said and done I will know and understand what I am trying to share with you today. Play the Trending Bull Markets.
Bull markets are always available. If you are interested in your own long term success, play the trending bull markets. Don't get suckered into the counterintuitive wise guy plays. Play the Bull Markets.
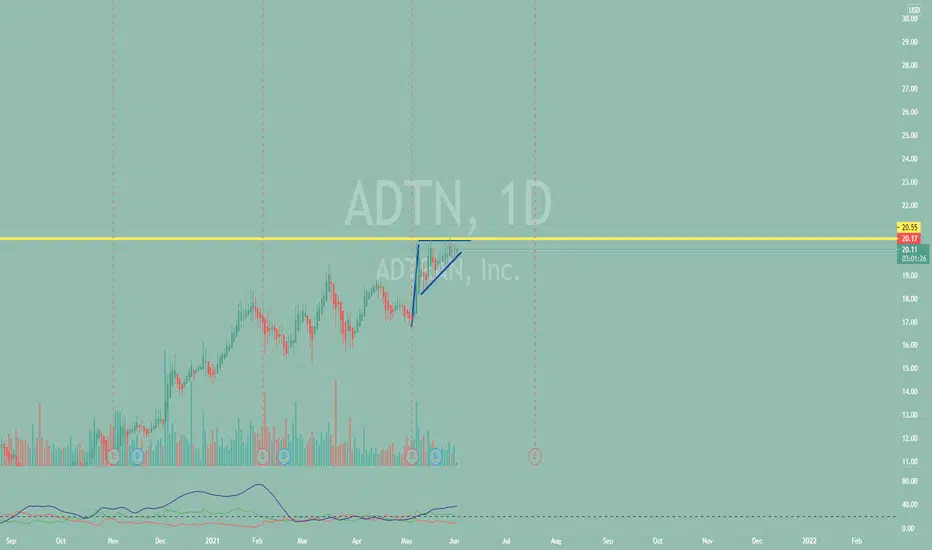
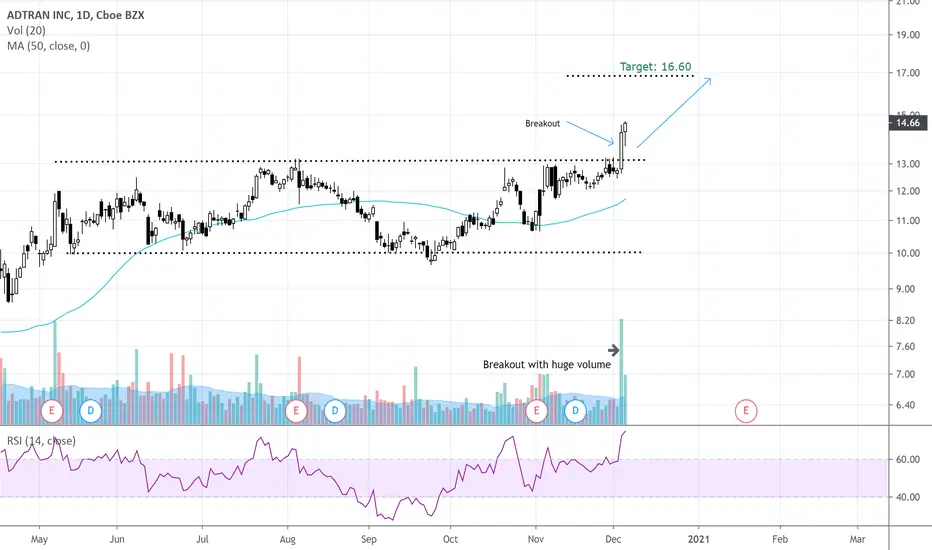
ADTN buying opportunityADTRAN, Inc has given a confirmed breakout with huge volume. This is a good candidate for fo long position.
Buy: 13.61
Stop loss: 12.46
Target: 16.60
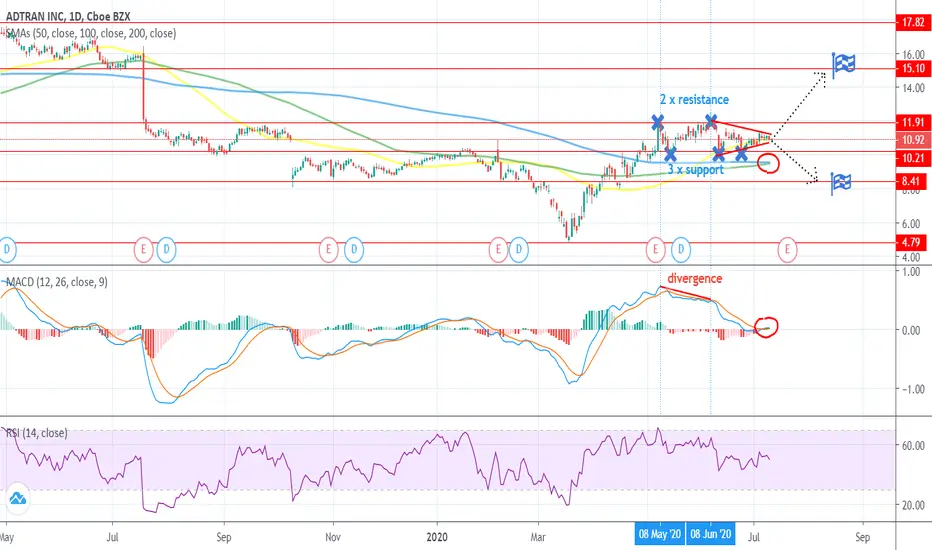
Adtran Inc. explosive breakout expected after sym. triangle!Hello Traders!
For about a month now, the price of Adtran Inc. has been moving within a symmetrical triangle. A breakout is coming nearer and nearer, especially because of the divergence pattern with the MACD. The only question is if it will be a bullish or a bearish breakout. The divergence occurred while the price was still on an uptrend, which would indicate a bearish reversal, but the MACD crossing over the 9 EMA and the 100 SMA crossing over the 200 SMA are clear and strong bullish signals. The 50 SMA and the 100 SMA are rising, indicating bullish momentum, and it seems like the 200 SMA is about to grow as well. RSI seems indecisive but very centered, so we can expect the next trend to be quite strong and to maintain momentum for a long time. All in all, I believe an emerging uptrend to be more likely, but let´s wait for the price to break out and cross the support/resistance at 11.91 or 10.21.
VF Investment cannot be held responsible for any financial damages suffered from following our well-funded but personal opinions and trading ideas.
Please, maintain proper position sizing and risk management!
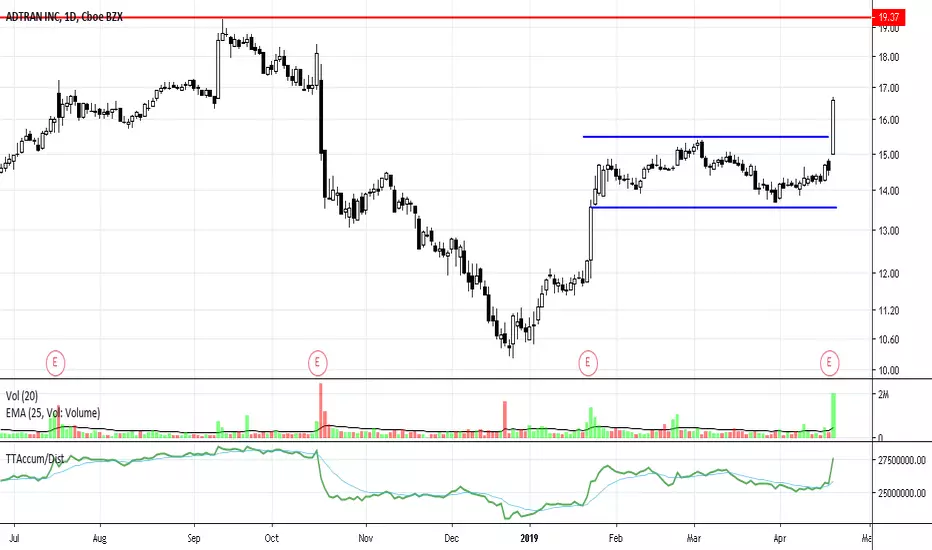
Long ADTN Jul 2019ADTN showed up on my FinViz Breakout Scanner.
Based on Earnings report transcript future is promising as it continues to show strong QoQ sales growth.
Looking to buy the open of 22nd April 2019 or 15.35 which is the previous quarter resistance level which may act as support.
Also RVOL is more than 2.
Target: 18.35
Stop Loss: 14.50
R/R: ~3.5

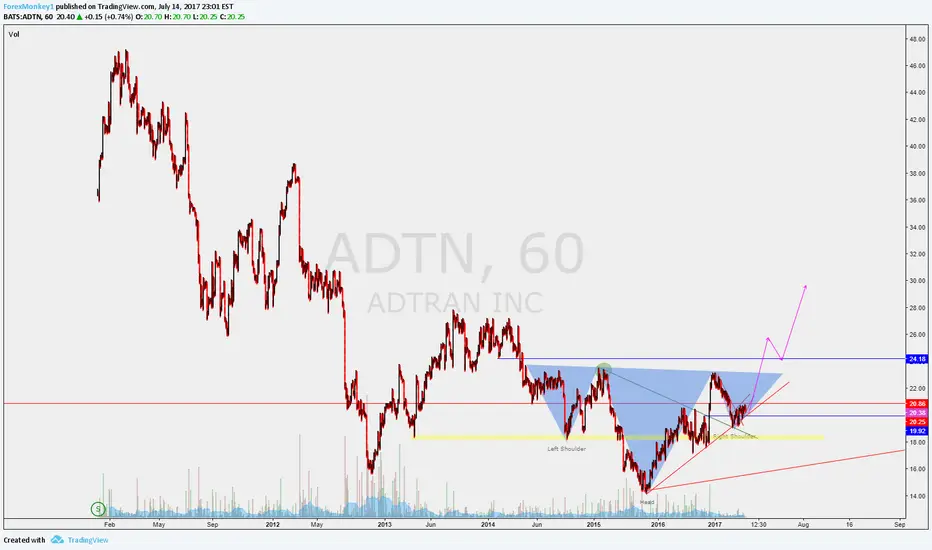
ADTN: Bottom completionADTN broke through moderate resistance to confirm a completion of its short-term bottom formation. ADTN has a previous all-time high of approximately $47.00. Profit-taking is likely as it nears the resistance from the lows of the prior sideways pattern above the current price.
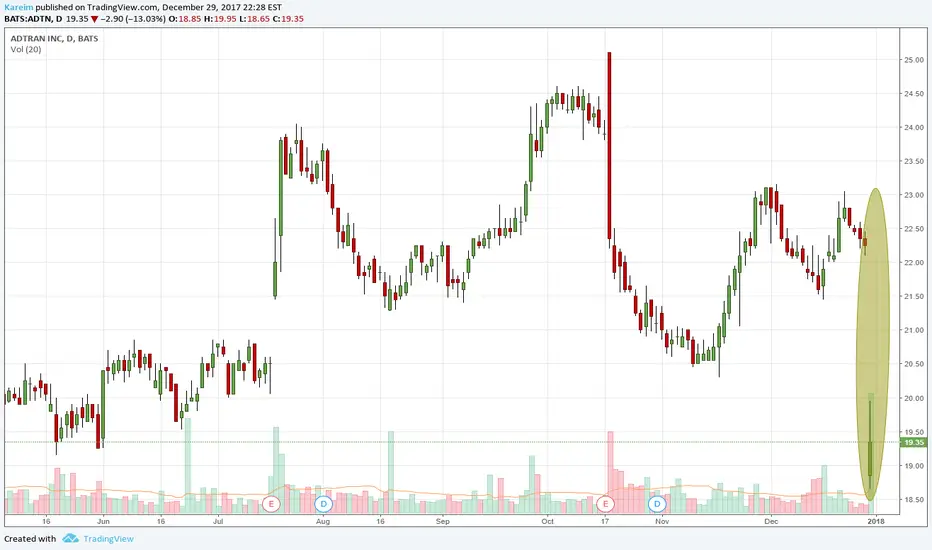
Massive Dip | Long Upper Shadow on Bull DayBears have not relented and may continue un obstructed into new year with all signals massively down. Price of $19 PUT option increased by 1,100% over two trading sessions.

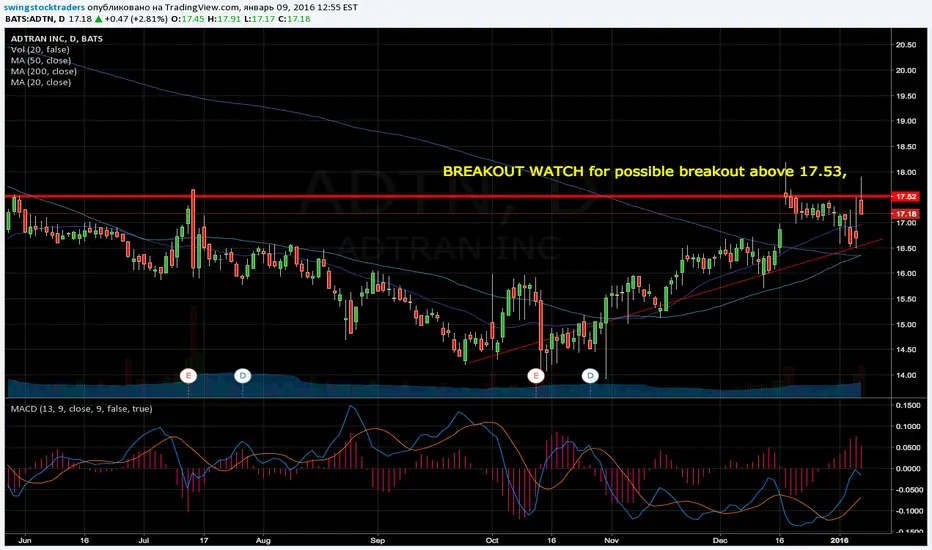
BREAKOUT WATCH for possible breakout above 17.53BREAKOUT WATCH for possible breakout above 17.53, no resistance in area just above.
Type: Continuation breakout from single resistance.
Target: 18.59, 8.2% Stop: 16.74 Loss: 2.6% P/L ratio: 3.2 : 1 - Excellent
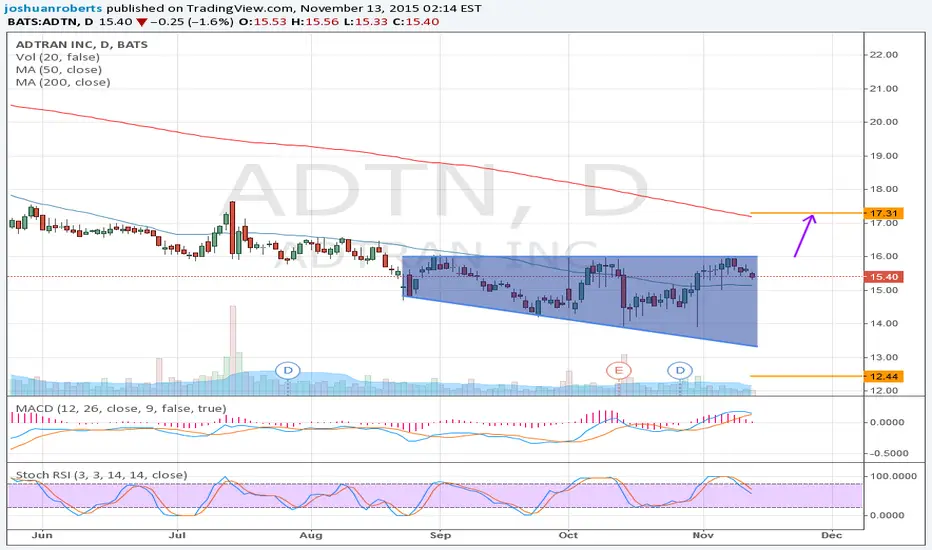
ADTN: Broadening Top, right-angled and descendingADTN
Breakout has not occured yet but for upward breakout, target price is 17.31 and downward breakout's target price is 12.44. Currently, it looks to be best setup for an upward breakout. Swing traders can short now if they want the intraformation trade and buy when it shows the reversal.
thepatternsite.com
thepatternsite.com
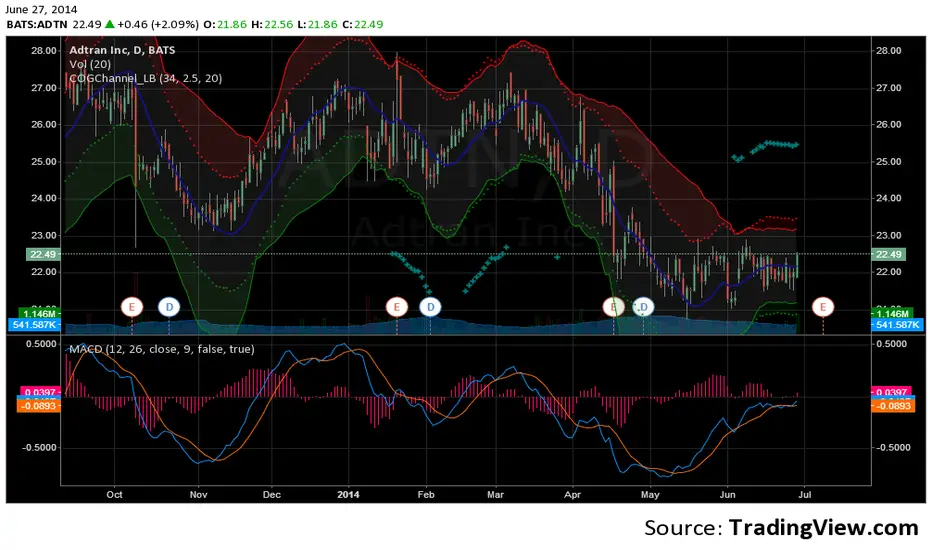
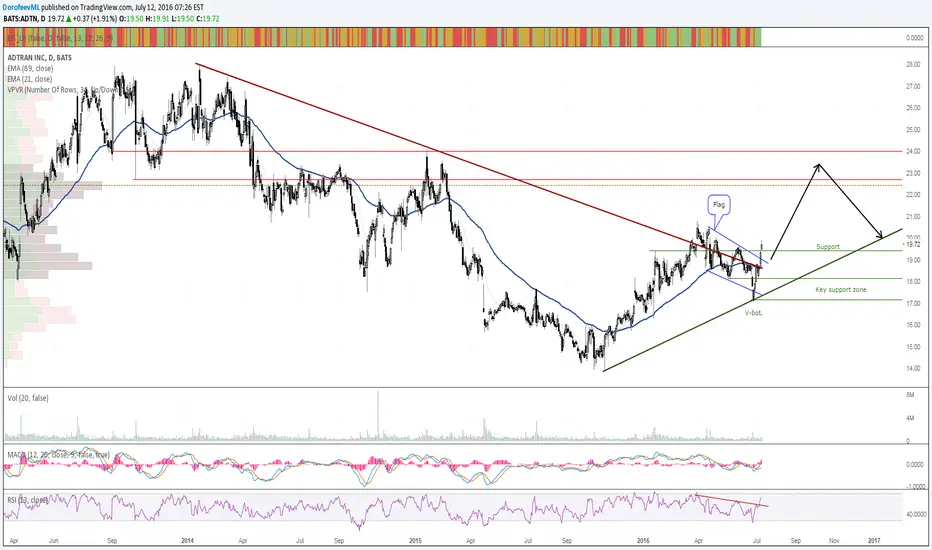
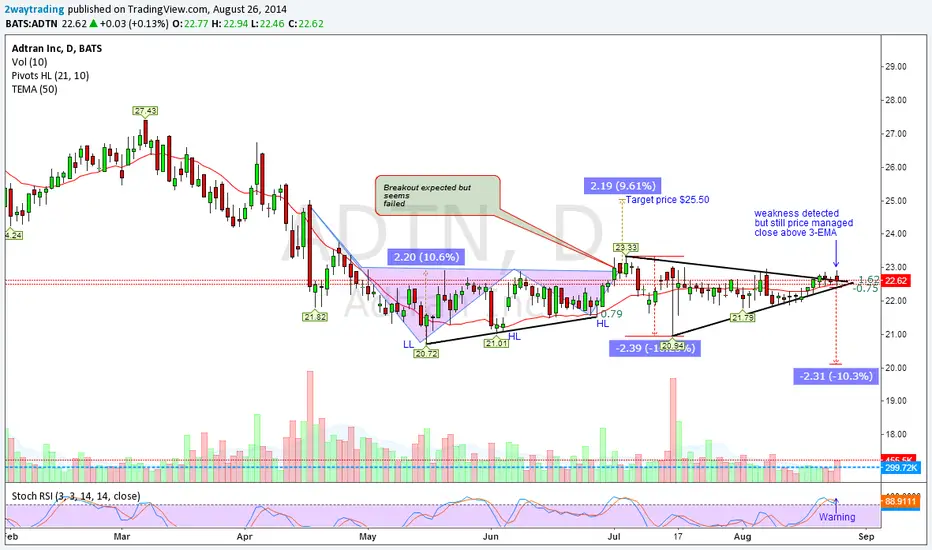
Conflicting patterns (Wait and see kind)Check details on the chart. Real time alerts checkout www.2waytrading.com
ADTN - COG Channel Indicator Indicates Squeeze Before EarningsADTN Daily chart is showing a squeeze right before earnings on July 7th...any thoughts from my more experienced brethren on which way it will break?