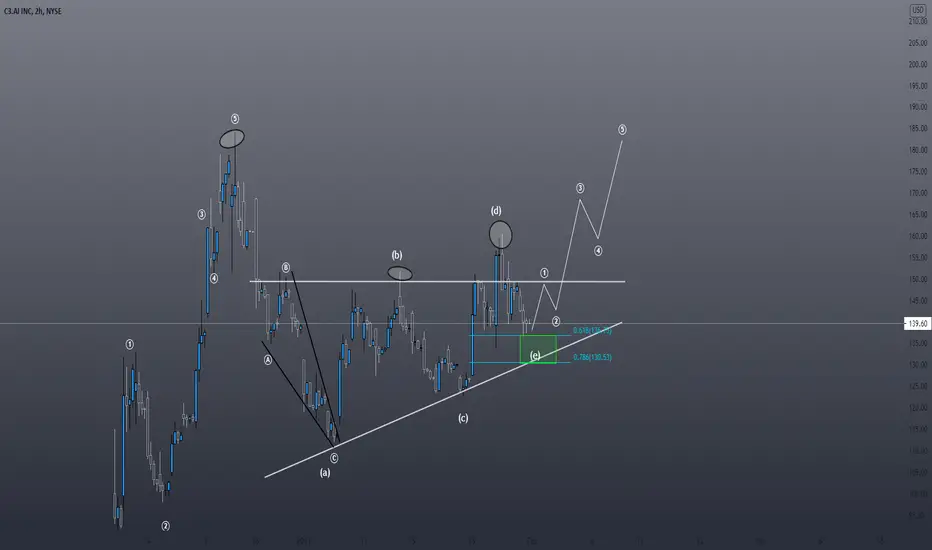
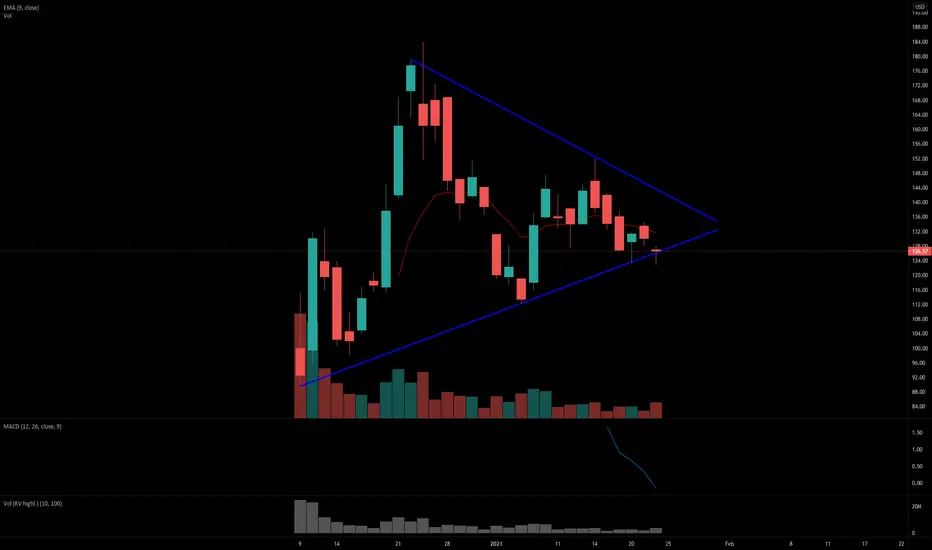
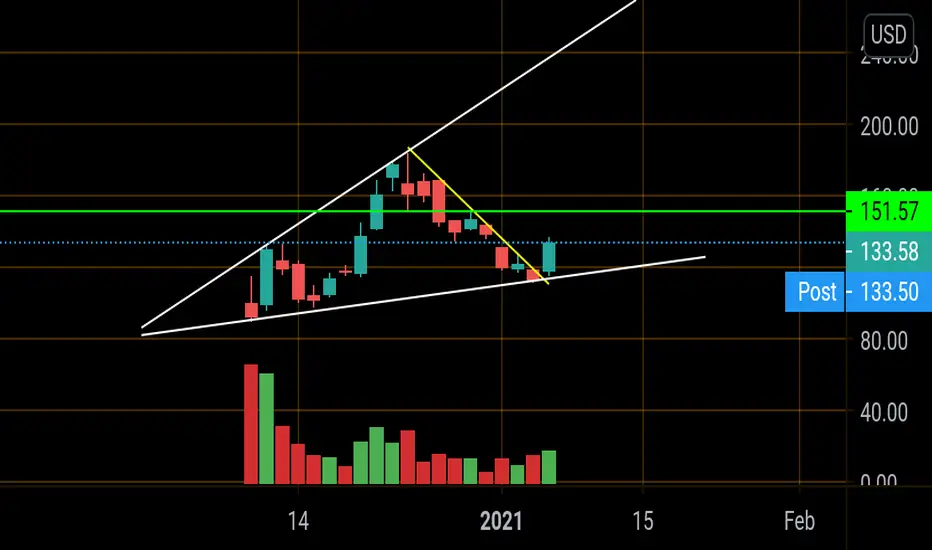
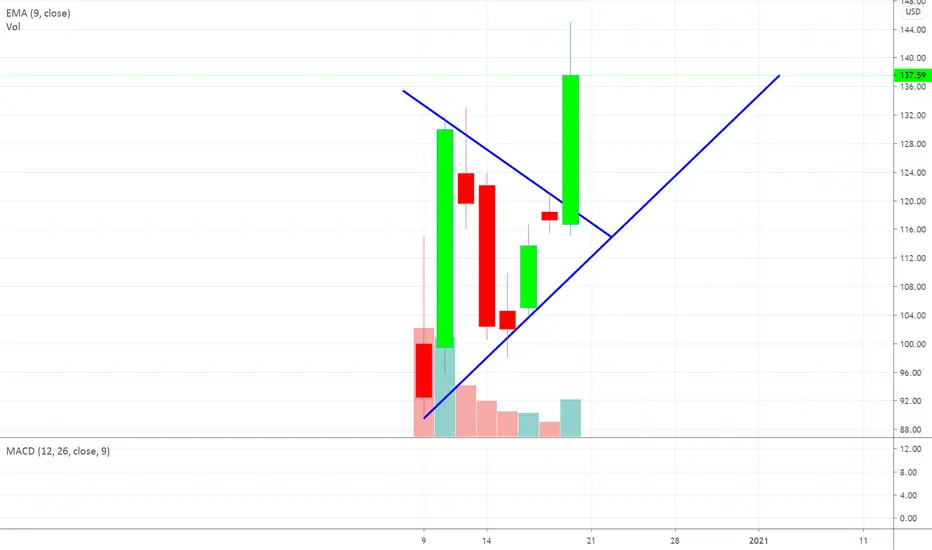
#AI Acending Triangle?- AI looks like an acending triangle with a possible abcde traingle forming although this can also be a 1,2 count.
- Depending how the market open on Monday this count can go for e making it a nice head and shoulders also playing out going down to where the .786 fib is at with with a really strong trendline as well, the cloud is also there with a strong area of support.
- This can also be a 1,2 going for a strong wave 3 all depends on your risk to reward ration but keep this one on watch for a move to the upside.
AINC trade ideas
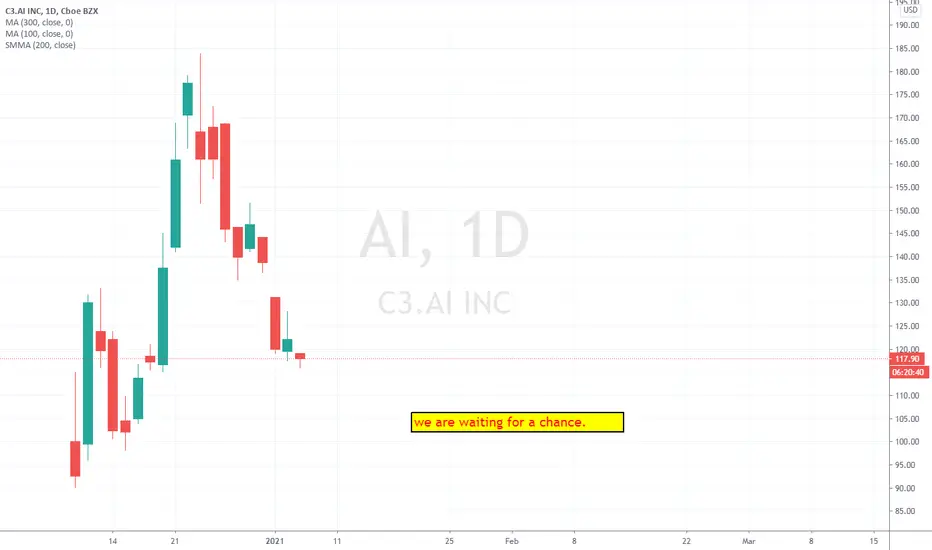
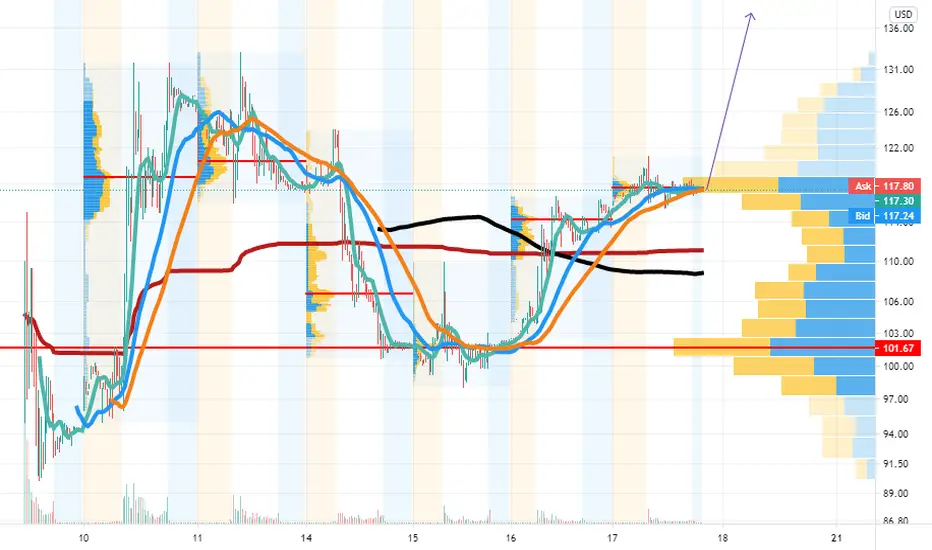
Artificial Intelligence is ready and primed$AI flashes BUY signal with 8 confirmations.
Institutional buying has resumed.
Happy Trading, from CJ -- aka the greatest FURU.
To find out more about The Ultimate Stock Indicator on Tradingview, please check my public profile.

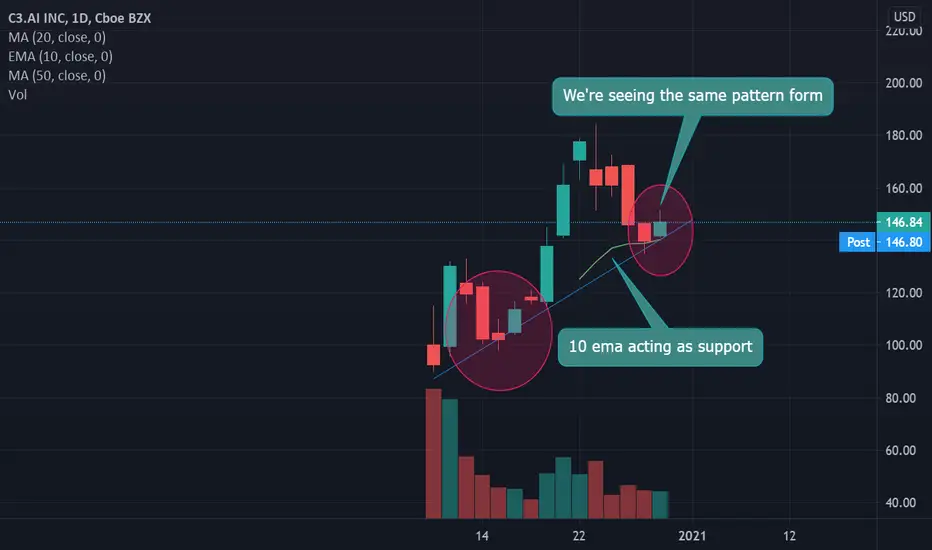
Keep it in your watchlistPotential gain:+75%
Reward/risk:>4.5
Timeframe: 4-6 wks
I always try to present the charts in a simple comprehensive format to prevent any confusion.
This is just my technical view, neither a fundamental comment,nor a recommendation to trade..!
Please review my track record and calculate the odds for yourself..!
Don't forget to like, comment, and Follow to encourage me to continue this.
I would appreciate if you share my analysis on your own social media.
You can send TradingView coins to support me publishing high quality ideas..!
Stay tuned great live stream and quality content videos coming soon..!
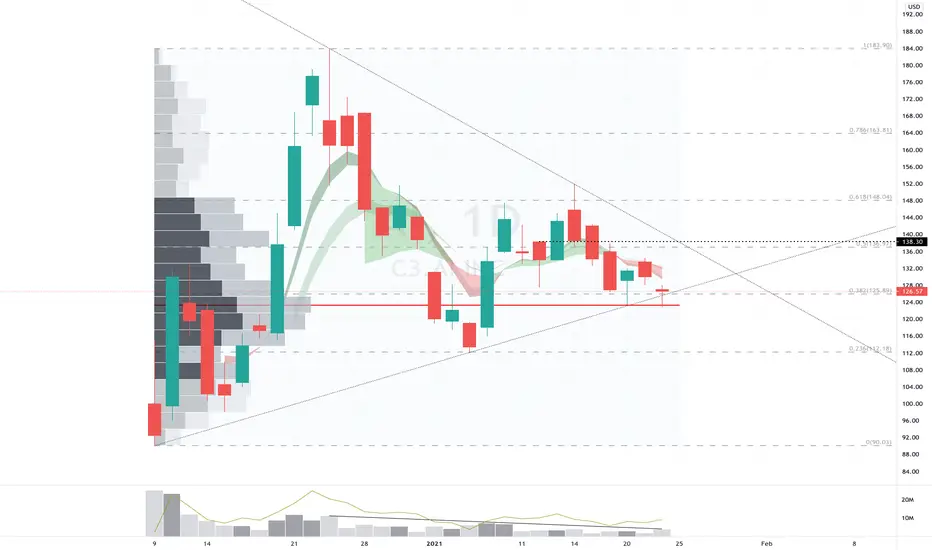
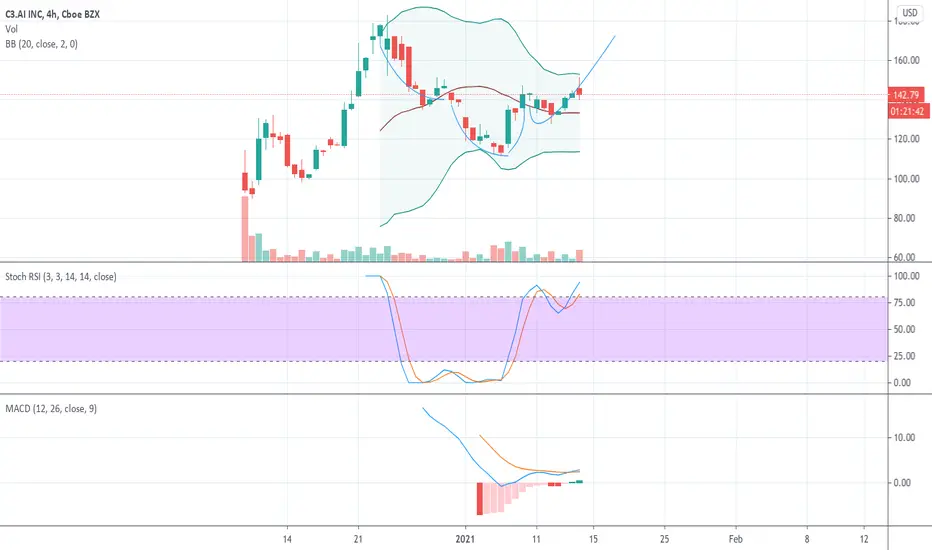
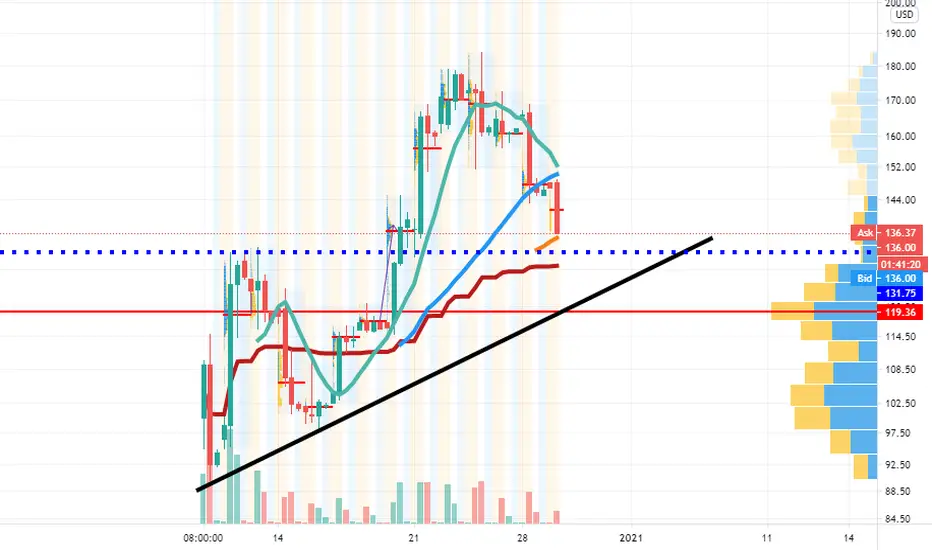
AI over 138.30C3.ai is a leading enterprise AI software provider for building enterprise-scale AI applications and accelerating digital transformation. Friday's candle on increased relative volume may be a reversal doji, bouncing off VPOC as support. Entry at 138.30, still waiting for it to confirm reversal, break out of the triangle, and break above recent closes to enter.
Another clean set up to watch Follow me for clean charts and trade ideas but we will be looking for this to make a move if we can get above this wedge no trades yet but we will watch LET THIS ONE COOK
How to trade this and my trade idea around this will be covered in tonight's free trade idea webinar hit the link to sign up us02web.zoom.us
H&S?Just last week this time I was bullish on this stock...
needs to hold bottom of the channel.. if it falls through the first target would be 113 which coincides with the double top forming in the right shoulder. second target is 92$ which would fulfill the H&S..

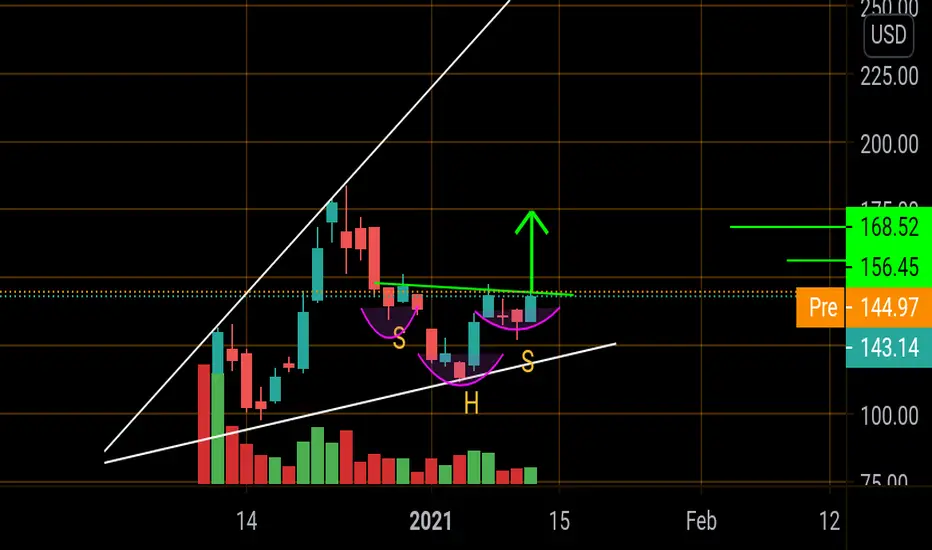
Ai, an inverse head and shoulder is forming, ready to explode!The 4 chart looks like is forming the inverse head and shoulder. There is no guaranty in trading so place your stop losses.
Inverted head and shouldersMy Favorite stock on the Russell 2k .Inverted head and shoulders forming Could move 10%.... Fibonacci Targets are Greenlines


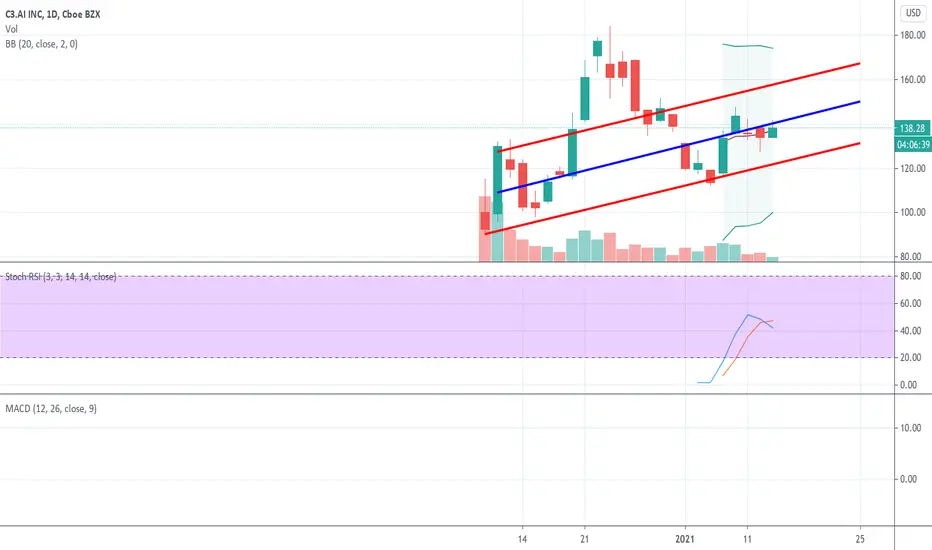
Ai Consolidating and ready to lift upIf Ai manages to cross the blue line and stay above it we are continuing the upward trend. If it can't we will continue to consolidate for a a while longer.


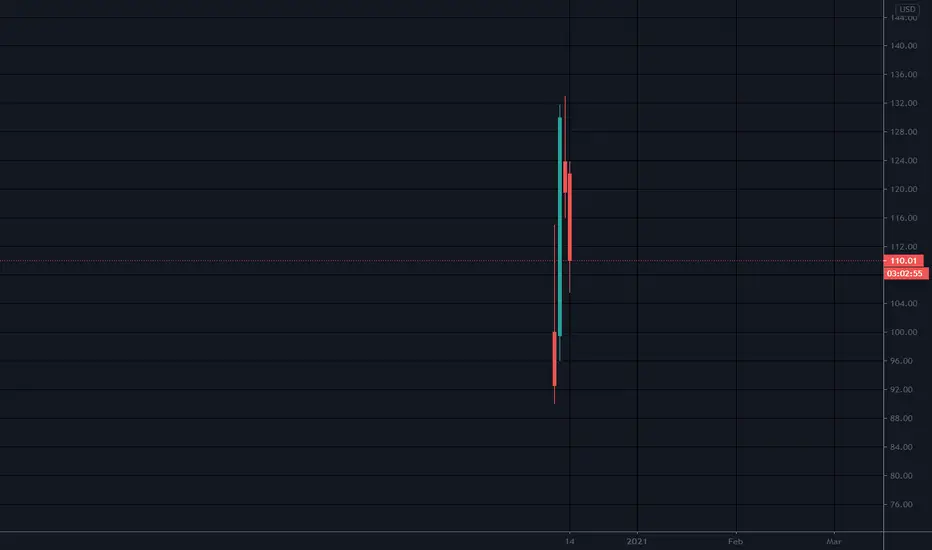
C3.AIBought a tiny position of C3.AI. This is a longterm investment on a potential high growing future stock. Tiyn risk, hughe chance. I will not trace the progress but just check on in every quarter.

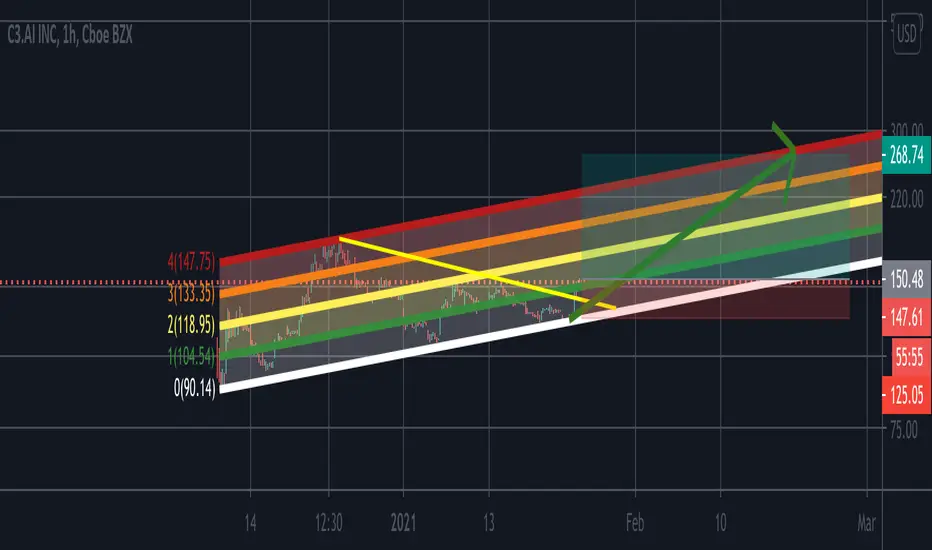
AI channel trade ideaDon't have much to work with since this IPO just listed. I caught the initial rally let's see if there's a round 2. Yellow line was the downtrend that was broken. Green line is double bottom conformation.
Fib targets are
1.139
2.148
3.156
OBV is on the verge of a bullish crossover

Healthy pullback to previous target. I like buying more here...Chart kinda speaks for itself. Volatile IPO with institutional interest, low market cap, big name clients. Gotta buy weakness in this name going forward. Here seems a good spot to do it all the way down to the trend line if we get it...
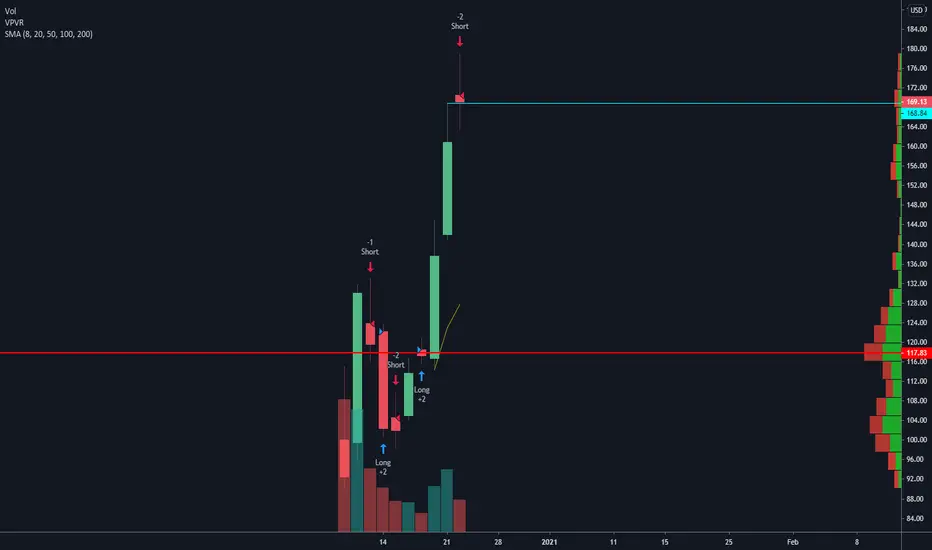
$AI Short Signal on this IPO that has Skyrocketed RecentlyShort signal alert on $AI
I have $135 puts as I expect it to revisit the 8day MA sooner than later.
Not trading advice.
Goodluck.
Cup & Handle on $AI?Should take it to $138 area. Let's see. Like this one long term, but could be a good quick trade here.
IPOsI find these very difficult to trade..lol
It is wonderful while they are going up..but when it is time to come down, there is no support and you are like..Holy Cow! Free fall!!
I look at the chart and there is nothing to catch price except possible the bottom, which does not always hold.
There is no base established. I have decided I will not touch another IPO until there is a trading base established. My new rule. Unless I want to do a momentum short term trade and sell super quick..I am out. I do not care how good it looks..lol
This has been added to my set of trading rules, or my plan.
Comments encouraged
what is your experience with trading these?