AMD about to Burst?I've been trading calls on AMD for 3 months now and have made over $45k in profit. This is my latest chart to help others gain insight into what I'm seeing. Make sure you do your own research and any news about Tariffs or rates could easily change this outlook. Always to your own research.
AMD trade ideas
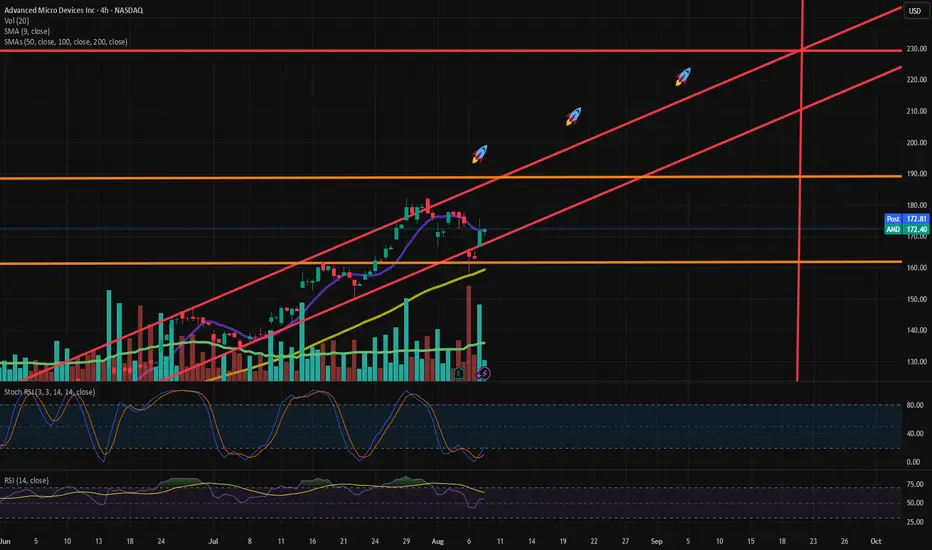
AMD Setup – Bullish Channel with Rocket Targets
Ticker: NASDAQ:AMD (Advanced Micro Devices)
Timeframe: 4H
Current Price: $129.40
Outlook: Bullish within ascending channel
🧠 Idea Summary:
AMD is trading within a well-respected ascending channel, and after a brief pullback, price is rebounding off the lower trendline support. With increased volume and momentum indicators turning up, I’m anticipating continuation to the upside — possibly targeting new highs.
📊 Technical Analysis:
🔴 Rising Channel:
The price is respecting both the upper and lower bounds of the ascending channel (highlighted in red).
Each bounce off the lower channel line has led to a strong upward move.
🟡 Support Zones:
$127.65 (9 EMA) and $117.87 (200 SMA) are serving as dynamic supports.
Horizontal support near $170 has also been tested and held.
🟠 Resistance Zones:
First major resistance at $187.75.
Further upside potential if price breaks above this level — targets align with the "rocket" icons within the channel.
📈 Volume Spike:
Strong green candle with high volume could signify institutional buying interest.
📉 Indicators:
Stoch RSI is turning upward from oversold territory.
RSI (14) is rising from 62, suggesting healthy bullish momentum.
🛫 Price Targets:
🎯 First Target: $173
🚀 Target 2: $187.75
🚀🚀 Target 3: $200+ if the channel holds and breakout occurs
🚀🚀🚀 Target 4: $230+ (aggressive bull case, upper channel extension)
⚠️ Risk Management:
A breakdown below the channel (~$127) with volume would invalidate this setup.
Use stop-loss below recent swing low (~$125) to manage risk.
📅 Key Dates:
Watch for potential catalysts in mid-to-late August (earnings, macro events, etc.)
🔔 Conclusion:
AMD is coiling for a potential breakout continuation. The structure is bullish, and the bounce off channel support with volume is a positive sign. A move above $173 could trigger a strong rally toward the $187-$200 range.
✅ Like if you find this helpful
💬 Drop your thoughts or setups in the comments!
📌 Follow for more trade setups
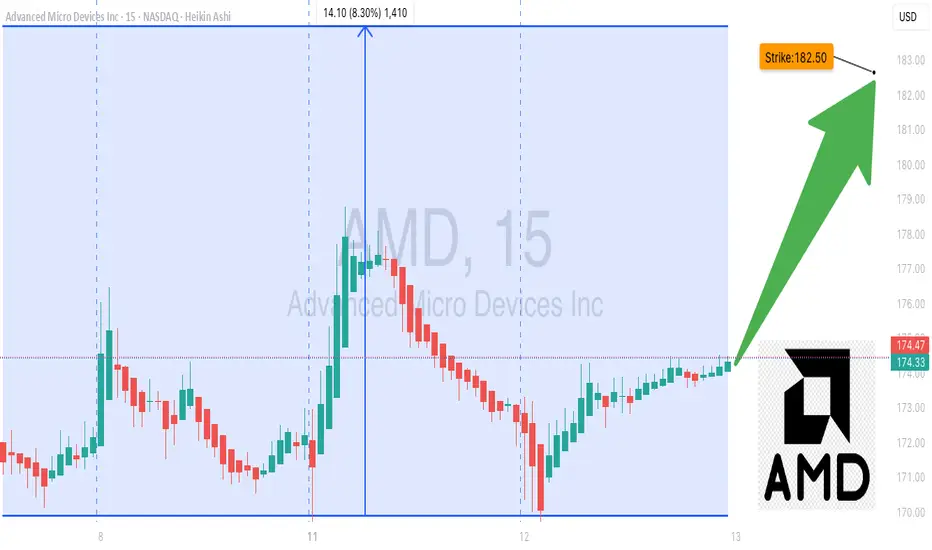
AMD Calls Flying Off the Shelves — Don’t Miss Out!🚀 AMD Weekly Options Alert (Aug 12, 2025)**
**Bias:** 🔥 **BULLISH** — Strong flow, high RSI, institutional backing
📊 **Quick Stats:**
* **Call/Put Ratio:** 2.31 → heavy call buying 📈
* **Daily RSI:** 60.4 ✅ bullish momentum
* **Weekly RSI:** 87.1 🚀 extreme strength
* **Volume:** 1.1× last week — institutional participation confirmed
* **VIX:** 15.0 → low volatility, stable premiums
* **DTE:** 3 | **Gamma Risk:** Moderate | **Time Decay:** Accelerating
💡 **Trade Setup:**
* **Type:** Naked CALL
* **Strike:** \$182.50
* **Expiry:** Aug 15, 2025
* **Entry:** \$0.69
* **PT:** \$1.38 (+100%)
* **SL:** \$0.34
* **Confidence:** 80%
⚠ **Risks:**
* 3 DTE = fast-moving gamma swings
* Semiconductor sector news could shift momentum
* RSI high — watch for intraday pullbacks
---
**📈 TL;DR:**
High RSI + bullish flow + strong volume = momentum play. Manage gamma risk, aim for quick profit.
\#AMD #OptionsTrading #CallOptions #WeeklyOptions #BullishBreakout #OptionsFlow #TradingSetup #TechnicalAnalysis #MomentumTrading #StockMarket #OptionsAlert
$AMD Ready for a Push?AMD getting tight on the daily chart. We just had some news com in as well. Also it's strong the first hour. NASDAQ:AMD CONFIRMS IT RECIEVED CHINA 🇨🇳 AI CHIP EXPORT LICENSES
AMD and NVDA: First week of August My thoughts and opinions!
Hope you find it informative and as always, safe trades!

Amd - New all time highs will follow!🪠Amd ( NASDAQ:AMD ) rallies even much further:
🔎Analysis summary:
After Amd perfectly retested a major confluence of support a couple of months ago, we saw a textbook reversal. This retest was followed by a rally of more than +100% in a short period of time. But considering all the bullish momentum, Amd is far from creating a top formation.
📝Levels to watch:
$200
SwingTraderPhil
SwingTrading.Simplified. | Investing.Simplified. | #LONGTERMVISION

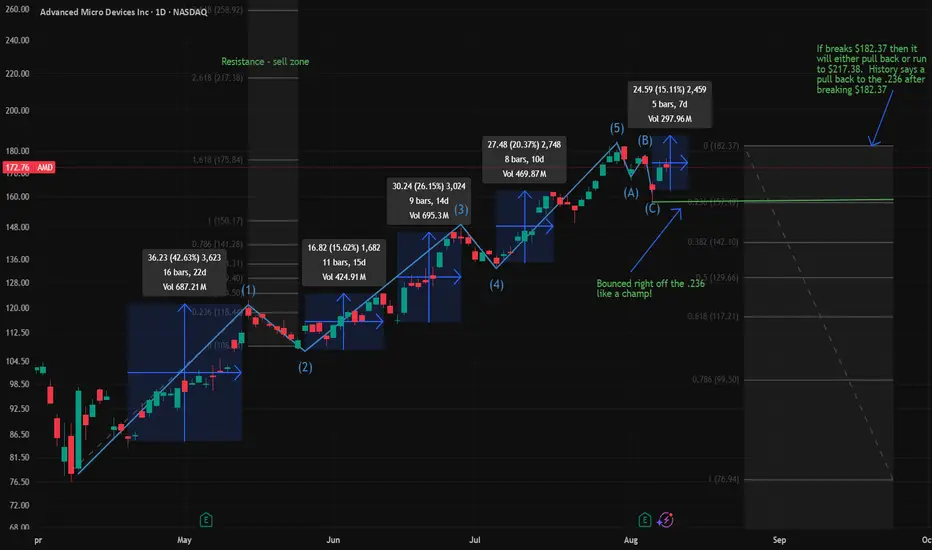
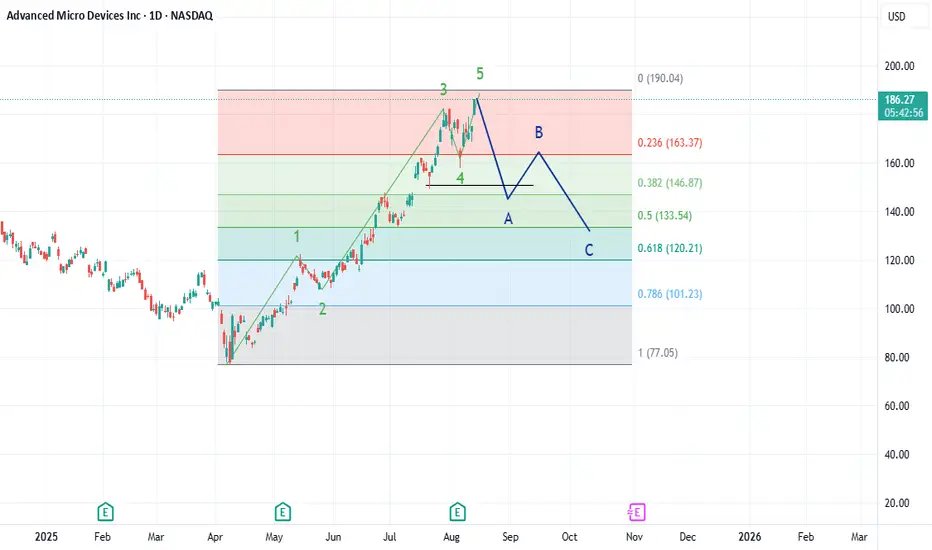
AMD: Correct ABC Wave ComingAMD is in its final wave up and expected to reach $190 by the EOW. From there, I am expecting heavy selling volume to begin sometime next week. The A wave of the ABC correction will likely bring AMD down to $163-160 range by as early as next week.
AMD | Weekly Macro Structure – Eyeing Major Fib Extensions AMD | Weekly Macro Structure – Eyeing Major Fib Extensions 🚀
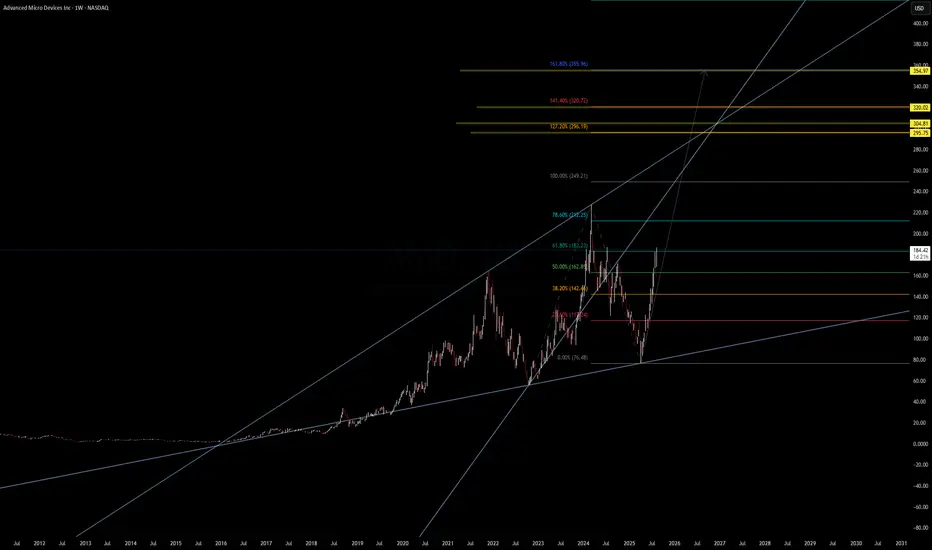
AMD has broken above the 61.8% retracement ($183.23) from its previous cycle and is pushing toward the 78.6% zone ($212.25). This breakout from the mid-channel region signals strong bullish momentum with clean room toward upper Fibonacci extensions.
Key Levels:
Fib Retracements:
61.8% – $183.23 ✅ (broken)
78.6% – $212.25 (next resistance)
Fib Extensions:
127.2% – $296.19
141.4% – $320.02
161.8% – $355.96
200% – $421.94
227.2% – $486.92
Trend Structure:
Long-term ascending channel intact since 2018.
Recent bounce from macro trendline near $76 set a higher low.
Breakout path projects a potential test of $300+ in the mid-term if momentum holds.
Macro & Catalysts:
AI/data center growth remains a key revenue driver, though export restrictions to China could slow short-term upside.
Positive sentiment from recent product launches and strong PC chip recovery.
Watch For:
Pullback retest of $183 support before continuation.
Weekly close above $212 for momentum confirmation toward $250–$320.
📊 Not financial advice. Chart for educational purposes.
AMD LongOn the AMD 15-minute chart, the broader market structure has shifted from a recent downtrend, marked by a Lower High (LH) and Lower Low (LL) sequence, into a potential reversal phase. This transition was confirmed by a Change of Character (CHoCH) at 177.98, breaking above the prior LH. That move signals that sellers have lost some control, and buyers may now be positioning for a continuation upward if they can defend nearby support.
The nearest demand zone lies between 171.00–172.00, where buyers previously stepped in with strength, creating a sharp bounce. This makes it a strong short-term support area. Above, supply is positioned at 174.50–176.00, where price previously stalled and dropped, indicating active sellers. A more significant supply cap remains at 179.00–181.00, which caused a major rejection earlier in the month and stands as a strong resistance zone.
Within the marked region, price is hovering just above the 171s demand after failing to push through the mid-supply area. The current price action suggests a likely shallow pullback into the 171.50–172.00 demand to absorb liquidity before attempting another push toward the 176.00–178.00 range.
Trade bias: Bullish
Expected direction: Higher after a pullback into demand
Invalidation level: A close below 171.00 would weaken the bullish case and open the door for a deeper drop toward 168.00
Momentum condition: Slightly favors buyers, with higher lows forming despite supply pressure
Candle behavior: Short-bodied consolidation candles above demand, indicating absorption rather than aggressive selling

Buy AMD with Confidence. Hello I am the Cafe Trader.
My goal is to help you find great pricing for your long term, and help you finesse your position the markets.
Today we are going to take a closer look at AMD.
As of right now AMD has just peeled off it's highs, gapping down. Is this where buyers are stepping in? Should you buy now? What are some short term plays that can maximize your profits?
CONTEXT
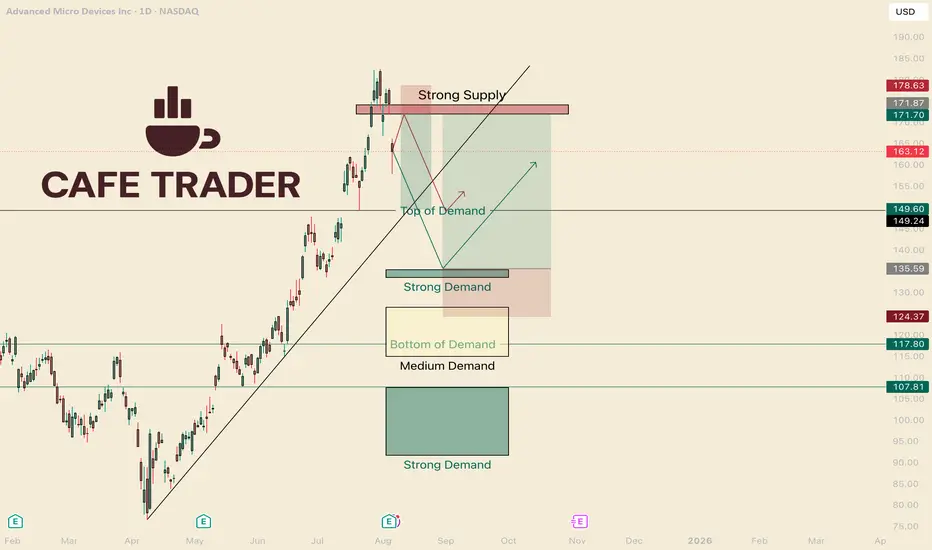
On the Chart I have labeled different levels of Demand. Knowing where the players are (buyers and sellers) can help us be surgical in price and timing.
In my opinion it is best to trade in terms of scenarios. How players react is just as important as Where they react.
For example: Say you are waiting in a long line for coffee. After some time, the line moves very slowly. We can start to ask questions, like "Why is this taking so long? How long will this take?"
"How" is an important question because we would have to examine how fast, or slow, the line is moving. We are in the dark with how big the current players are in the market.
Knowing "How" will help us position ourselves well with the other players. This lines us up for the best pricing, and helps us be able to get out of a position quick if we are wrong.
SHORT TERM
AMD had mixed earnings. This puts pressure on the buyers but they are still in control.
With a new seller inbound It's probable to hit the "Top of Demand" before breaking new highs.
Short Scenario (Red Line)
I think this will touch quick, reject, and then a few days of sideways before the real move down. You can take a Short right in this zone at 172, but if you buy puts, look to get good pricing. If we move up 4% the contracts might be too expensive to swing 3-5 days. I think after the touch, wait two days or so, and then look to get into some options.
Short (shares)
Entry 172
Stop 178.75
TP 150
Short (options)
Entry is after a test of the strong supply, wait a couple days.
Strike price: 160 Strike (or higher)
Premium: 4 to 1 R
$1.50 4-5 days TP $600
$2.50 6-10 days TP $1000
Long Scenario.
If we do not touch the strong supply before going down, This could drop aggressively. Unlike the previous scenario, I am expecting a hot reaction off the strong Demand area.
Long (shares)
Entry 135.50
Stop 124
TP 172
Long (options)
As soon as it touches, same day and next days contracts, 1 - 2 standard deviations outside the money. I think It can get to 140 minimum the same day.
Strike 136-137
Premium: 2.50-3.50 (if you get it cheaper, great!) Really this will depend on if it touches on a Monday, or a Friday lol.
TP 150% - 400%
LONG TERM
These prices should align with your own sentiment and Due Diligence of AMD.
Fair: $149.50 (Top of Demand)
Deal: $133.50 - 135.50 (Strong Demand)
Steal: anything under 108
(2nd Strong Demand)
Don't forget to Boost and follow!
More insight to come, and make sure you check out all my channels.
Much Love and Happy Trading!
@thecafetrader
Advanced Micro Devices (AMD) Stock AnalysisAdvanced Micro Devices (AMD) Stock Analysis
AMD, listed on NASDAQ, has generally been on an upward trend. However, last week, the stock experienced a brief flash downturn, dropping to around the $157 level.
Since then, it has recovered and is currently trading at approximately $172 per share.
Outlook:
I remain bullish on AMD and anticipate a potential move toward the $200 level, with a longer-term target around its all-time high near $226.
For my entry strategy, I have added positions at different levels, with an initial entry around $160 and another at the current level.
This gives me a total of three buy entries, positioning for a mid- to long-term hold.
Let’s see how it unfolds! If you have any insights or thoughts, please share them in the comments. I’d love to connect with you. Don’t forget to follow, share, and subscribe. Thank you.
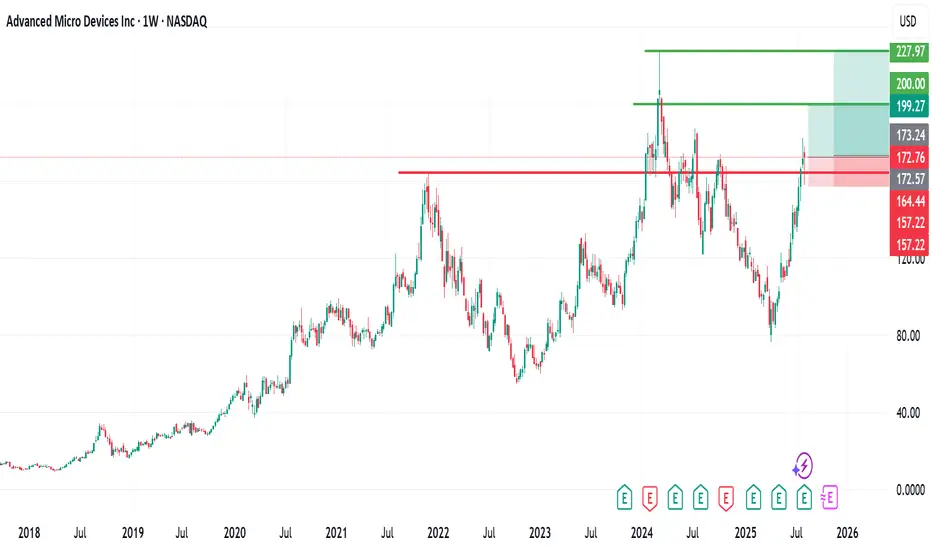
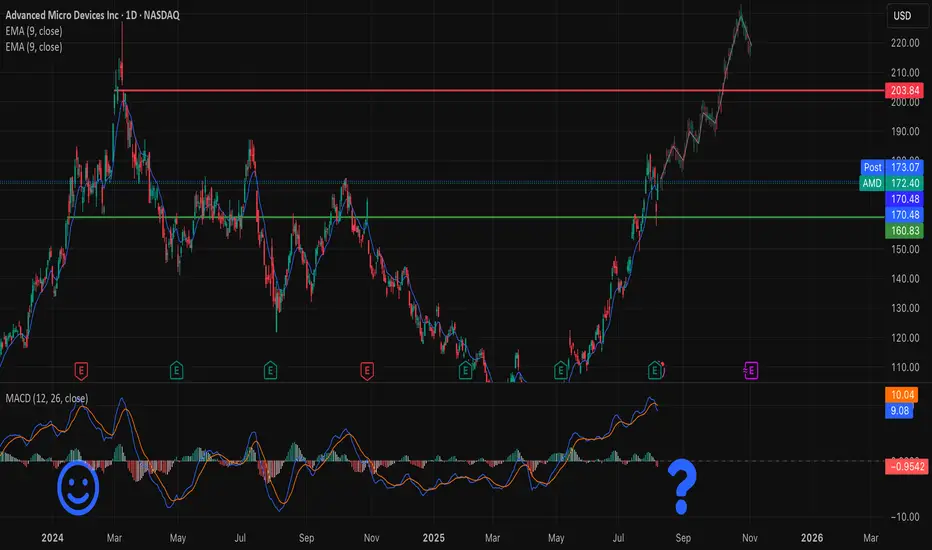
$AMD — Is history repeating itself?NASDAQ:AMD The chart is showing a pattern strikingly similar to previous highs — a strong rally after a long accumulation, followed by a pullback on news.
📰 Q2 2025 Earnings:
• Record revenue: $7.7B (+32% YoY)
• Strong sales in Ryzen CPUs and Radeon GPUs
• Q3 outlook: $8.7B revenue, ~54% margin
What’s holding it back:
• Export restrictions on MI308 to China hit margins and investor sentiment
• Short-term profit taking after a powerful rally
Reasons for optimism:
• Upcoming AI products MI350 and MI400 could be major growth drivers
• Expected demand from data centers and AI infrastructure
Technical view:
• EMA 9 remains above key support levels (170, 160)
• MACD is close to a potential bearish crossover — worth watching
• Past highs show that sharp corrections in AMD often set the stage for the next wave up
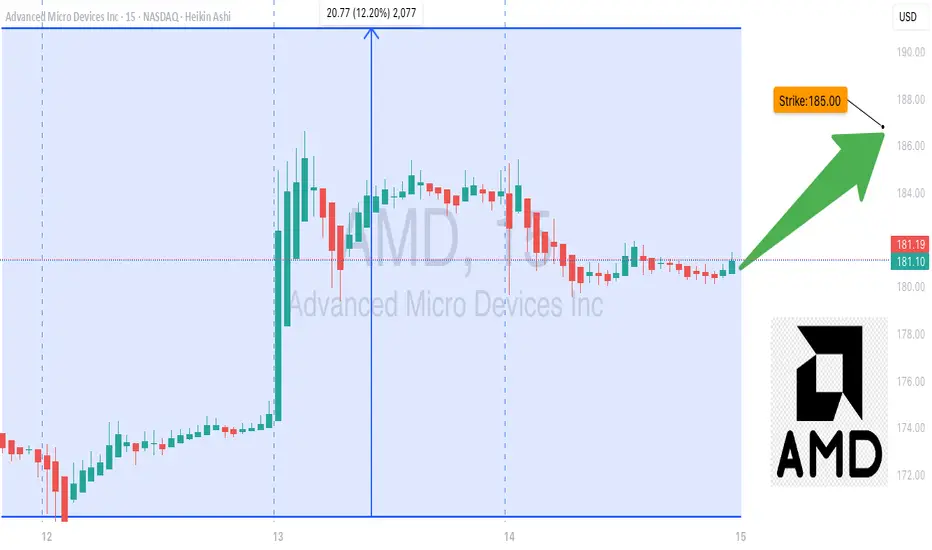
AMD One-Day Call Opportunity – Quick Gains Ahead!🚀 AMD \$185 Call – One-Day Bullish Sprint
**Sentiment:** 🟢 *Strong Short-Term Bullish*
* **Daily RSI:** 64.2 📈
* **Weekly RSI:** 88.4 📈
* **Call/Put Volume:** Favoring calls strongly
* **Volume:** Weak (0.8× last week) → watch for support
* **Gamma Risk:** HIGH ⚡ — 1-day expiry
---
### 📊 **Consensus Snapshot**
✅ Majority of models: bullish momentum
⚠️ Weak volume + high gamma → strict risk management required
💡 Entry timing and discipline are critical
---
### 🎯 **Trade Setup**
* **Type:** CALL (Single-leg)
* **Strike:** \$185.00
* **Expiry:** 2025-08-15
* **Entry:** \$2.61 (mid-market)
* **Profit Target:** \$3.90 (+50%)
* **Stop Loss:** \$1.30 (–50%)
* **Confidence:** 70%
* **Trade Size:** 1 contract
* **Entry Timing:** Market open
---
💬 *High-momentum, short-term expiry play — monitor volume and be ready to exit quickly.*
📌 *Not financial advice. DYOR.*
---
**#AMD #OptionsTrading #CallOptions #DayTrading #StocksToWatch #GammaRisk #OptionsFlow #TradingSignals**
AMD: 172.28 Bullish Entry: 180.00/184.00 Stop 178.50 Target 182.00/184.00
Bearish Entry: 172.00/170.00 Stop 173.20 Target 170.00/168.00...double top zone at 182.00

AMD Long for Aug 2025 Week2?Retested the scene of crime around 160,
and now heading to 200, will go long if it crosses
175.

AMD Is Up 100%+ Since April. Here's What Its Chart SaysAdvanced Micro Devices NASDAQ:AMD has been on a roll recently, rising more than 100% in less than four months after losing nearly 60% of its value between a February 2024 intraday peak and an April 2025 session low. What does technical and fundamental analysis say as the chip giant prepares to report Q2 earnings on Tuesday?
Let's take a look:
AMD's Fundamental Analysis
AMD has risen amid several seemingly positive recent catalysts.
First, the Trump administration eased as part of the recent Washington-Beijing temporary trade truce some restrictions on advanced-chip sales to China by AMD and Nvidia.
Published reports also speculate that AMD might raise prices on its Instinct MI350 AI accelerator chips to $25,000 from an earlier $15,000 estimate. The Instinct MI350 is supposedly a realistic rival to Nvidia's high-end Blackwell B200 chips.
Wells Fargo analyst Aaron Rakers (who gets a five-star rating out of a possible five by TipRanks) also recently speculated that AMD will be able to charge around $30,000 for its next generation MI355X chip.
Rakers has a "Buy" rating on AMD and a $185 target price vs. Friday's $171.70 close. (Full disclosure: I am also long AMD.)
The chip giant will release Q2 results after the bell Tuesday, with the Street looking for $0.48 in adjusted earnings per share on about $7.4 billion of revenue.
At first blush, that doesn't compare well to the $0.69 in adjusted EPS that AMD reported in Q2 2024. But investors should understand that the firm is exporting more freely to China again, while demand for its newer products is pushing both prices and AMD's operating margin higher.
Note as well that the $7.4 billion revenue print that analysts expect for the company's latest quarter would represent more than 27% year-over-year growth.
That said, 27 of the 39 sell-side analysts that I can find who follow AMD have revised their earnings estimates lower since the quarter began. Just five have increased their estimates, while seven have left things unchanged.
AMD's Technical Analysis
Next, let's look at AMD's chart going back some six months and running through Thursday afternoon:
Readers will see that AMD blasted out of what's called an "inverted head-and-shoulders pattern" of bullish reversal in early June with a $127 pivot (marked with jagged line and red-orange shading in the chart above).
Since then, the stock has developed two consecutive "bull-flag" patterns at the chart's right. These are historically what's known as "patterns of continuance," meaning that after a short consolidation period, a stock continues with its trend -- re-energized by the pause.
The bull-flag patterns put AMD's current upside pivot at $162, suggesting that perhaps as the stock approaches earnings, it could have more in the tank.
Of course, that might depend on how CEO Lisa Su handles this week's earnings call and what kind of forward guidance the firm issues.
Meanwhile, AMD's Relative Strength Index (the gray line at the chart's top) is more than robust. In fact, it's technically overbought and has been for most of July.
Similarly, AMD's daily Moving Average Convergence Divergence indicator (or "MACD," marked with black and gold lines and blue bars at the chart's bottom) is extremely bullish-looking.
The histogram of the stock's 9-day Exponential Moving Average (or "EMA," denoted with blue bars) is well above zero and has been since early July. That's historically bullish.
The 12-day EMA (marked with black line) is also well above AMD's 26-day EMA (the gold line), with both of them above zero. Again, that's a technically bullish sign.
(Moomoo Technologies Inc. Markets Commentator Stephen “Sarge” Guilfoyle was long AMD at the time of writing this column.)
This article discusses technical analysis, other approaches, including fundamental analysis, may offer very different views. The examples provided are for illustrative purposes only and are not intended to be reflective of the results you can expect to achieve. Specific security charts used are for illustrative purposes only and are not a recommendation, offer to sell, or a solicitation of an offer to buy any security. Past investment performance does not indicate or guarantee future success. Returns will vary, and all investments carry risks, including loss of principal. This content is also not a research report and is not intended to serve as the basis for any investment decision. The information contained in this article does not purport to be a complete description of the securities, markets, or developments referred to in this material. Moomoo and its affiliates make no representation or warranty as to the article's adequacy, completeness, accuracy or timeliness for any particular purpose of the above content. Furthermore, there is no guarantee that any statements, estimates, price targets, opinions or forecasts provided herein will prove to be correct.
The Analyst Ratings feature comes from TipRanks, an independent third party. The accuracy, completeness, or reliability cannot be guaranteed and should not be relied upon as a primary basis for any investment decision. The target prices are intended for informational purposes only, not recommendations, and are also not guarantees of future results. show less
Moomoo is a financial information and trading app offered by Moomoo Technologies Inc. In the U.S., investment products and services on Moomoo are offered by Moomoo Financial Inc., Member FINRA/SIPC.
TradingView is an independent third party not affiliated with Moomoo Financial Inc., Moomoo Technologies Inc., or its affiliates. Moomoo Financial Inc. and its affiliates do not endorse, represent or warrant the completeness and accuracy of the data and information available on the TradingView platform and are not responsible for any services provided by the third-party platform.

AMD eyes on $178: Serious Resistance zone that may give a DIPAMD bouncing back from market wide dump last week.
Approaching a significant resistance at $177.79-178.59
Look for a Dip-to-Fib ideally to green at $163.30-163.61

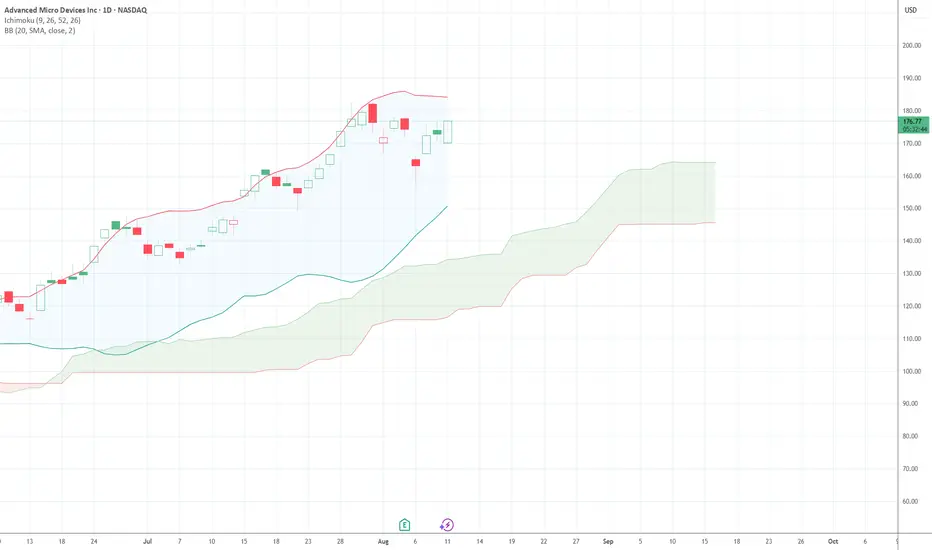
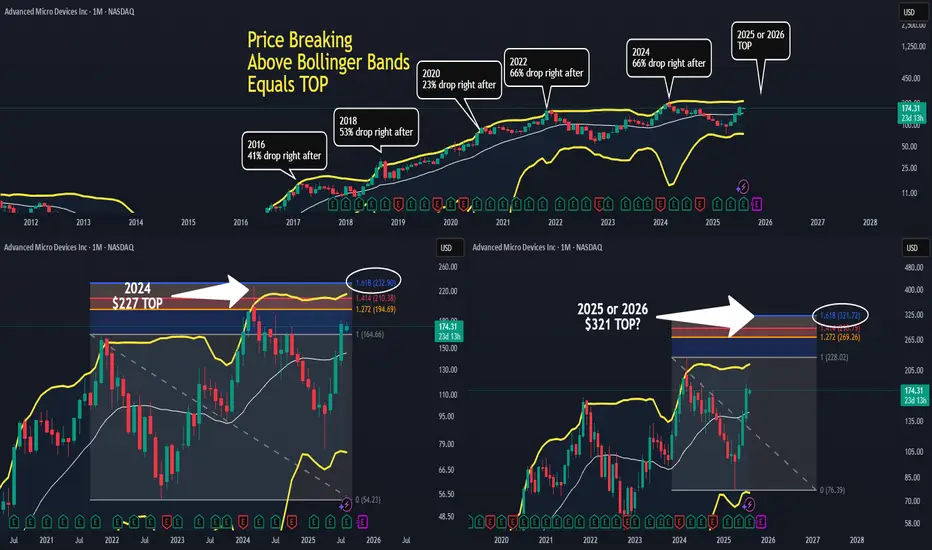
AMD - Finding Market TopAMD on the Monthly Chart using Bollinger Bands.
The Top Chart is a brief history of AMD's market tops.
Whenever price broke above the Bollinger Band (Yellow Band) that marked the top.
Bottom Left Chart is the 2024 market top.
Price broke above the Bollinger Band and headed towards the 1.618 Fibonacci.
It didn't hit the $232 exactly, but got very close.
Priced topped at $227.
Roughly a $5 difference.
Bottom Right Chart is the current price action.
The market cycle top should hit sometime in 2025 or 2026.
If the chart plays out like the previous pattern, then the 1.618 Fibonacci should be
the near target for the market cycle top.
This target is $321.
Will the market top hit $321 exactly?
I doubt it, but you never know.
But being honest, I did create a limit sell for $309.
We'll see how accurate I am.
I need to see price break above the Bollinger Band, then see how price
reacts to the Fibonacci ratios of 1.272, 1.414 and 1.618.
Fibonacci 1.272 is listed as $269, and Fibonacci 1.414 is at $290.
I could set limit sells at these three Fibonacci levels to better scale out of my positions.
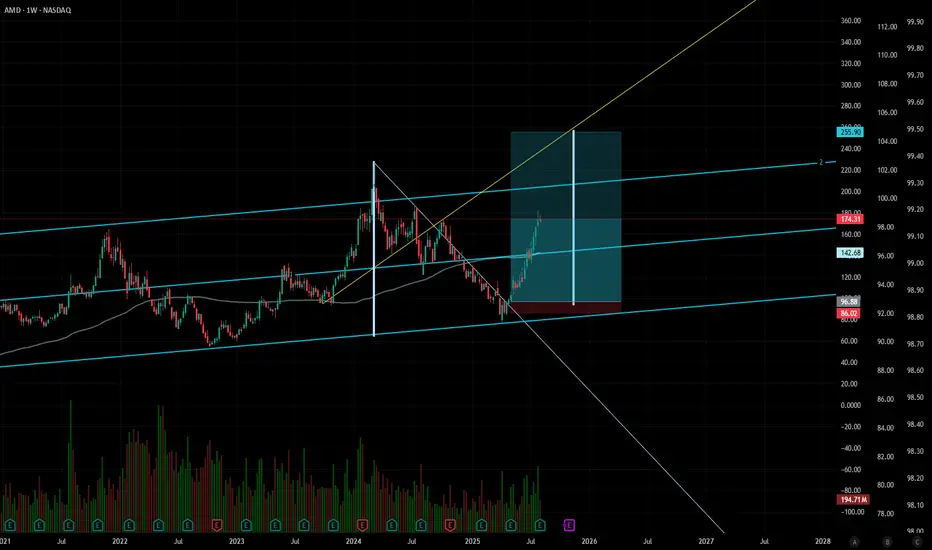
Half way thereAMD Triangle Convergence Breakout - 1:1 Target Analysis
📈 Technical Setup:
- Triangle convergence pattern successfully broken to the upside
- Clear breakout with strong momentum
- 1:1 risk-reward ratio maintained
🎯 Target Analysis:
- Using ray projection from previous high points
- Target zone identified based on technical structure
- Currently halfway to target level
✅ Progress Update:
- 50% of the move completed
- Maintaining bullish structure
- Next resistance level in focus
Risk management and position sizing remain crucial. This analysis is for educational purposes only.
#AMD #TechnicalAnalysis #TriangleBreakout #StockTrading
AMD will soar and POP $200. Analyst bang big on rival productAMD datacenter products are better than during 2023-24. It can now rival NVDA to grab global datacenter and entreprise datacenter market share. Analysts are upgrading to 200-210 target.
Trump recent lifting chip restrictions for export to china, boost AMD and NVDA market reach
AMD recent 800million inventory write off suddenly became instant cash as ban is lifted.
AMD is of the number 2 after NVDA to grab Trump's mega American datacenter plan, in the medium term, long players will see AMD break 200 to 350 easily.
AMD is like the younger NVDA few years back, going to 1 trillion is a set on course.
Are you really for the opportunity to grasp ?

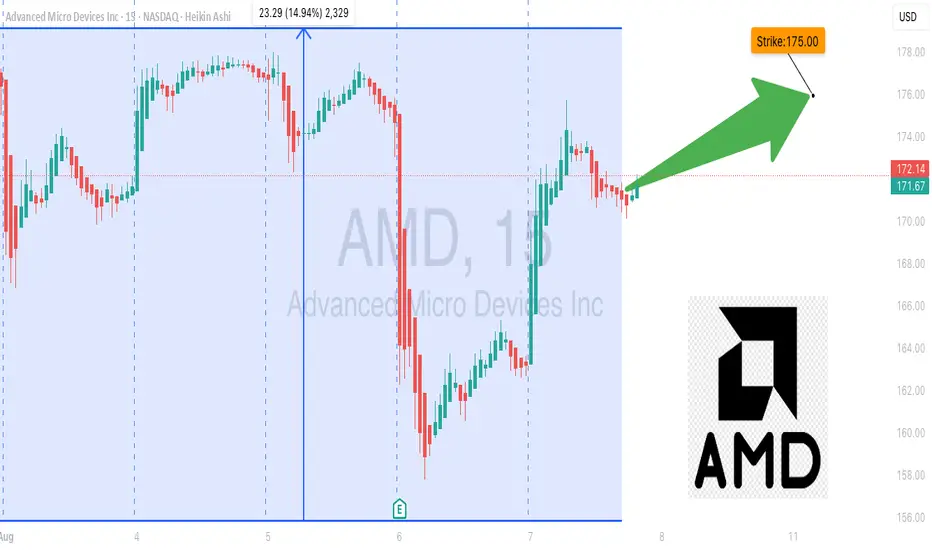
AMD Gamma Squeeze Potential?### 🚀 AMD Bulls or Trap? | \$175C Trade Setup Before Expiry!
**⚠️ High Gamma, Mixed Sentiment – Time-Sensitive Play**
📉 **Weekly RSI**: 70.4 (falling)
📈 **C/P Ratio**: 2.07 (bullish bias)
🔁 **Volume**: 1.2x weekly avg
📊 **Model Sentiment**:
* **Grok/xAI**: Bullish (Call accumulation 📈)
* **Claude/DeepSeek**: Bearish (Institutional selling 🚨)
* **Gemini**: Cautious Bearish
* **Llama**: Neutral / Wait & See
📌 **Suggested Trade**
🔵 **Call**: AMD \$175C (Aug 8 Exp.)
🎯 **Entry**: \$0.66
🛑 **Stop**: \$0.33
💰 **Target**: \$1.25
📆 **DTE**: 1
🔥 **Gamma Risk**: High – requires fast execution
🧠 **Confidence**: 65%
🧠 Watch for sharp moves. Mixed model sentiment = **great volatility** = **great opportunity** (with tight risk mgmt).
💬 *Would you take this trade?*
👇 Drop your thoughts in the comments!
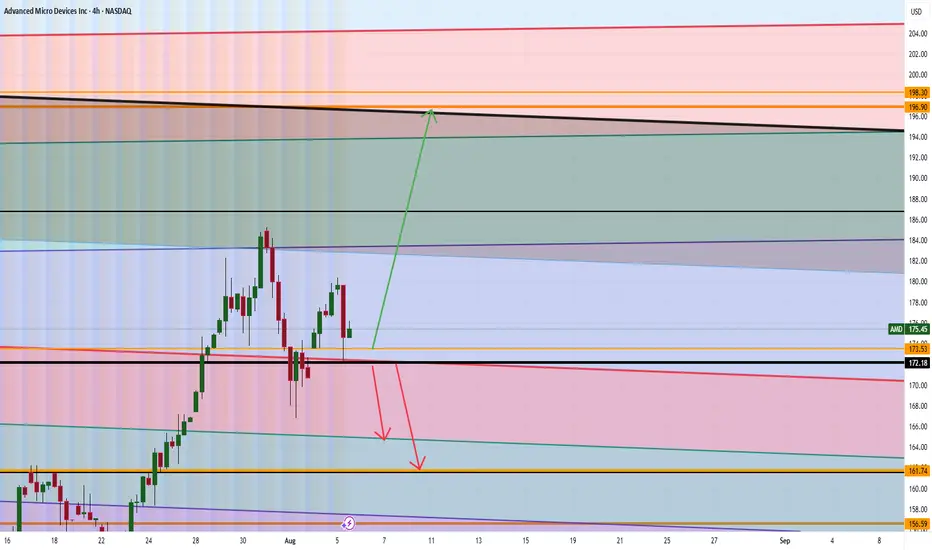
AMD Analysis Are WE GOING TO $199? Good morning trading fam
Currently we a strong bull run for AMD on the Monthly time frame.
Currently if we can hold above 172 then we will see a nice run up to 196-199 territory or higher.
If we break below the 172 we can a quick short down to the orange level we marked out.
Happy Trading
Trade Smarter Live Better
Kris
AMD Shares Decline Despite Strong Earnings ReportAMD Shares Decline Despite Strong Earnings Report
Yesterday, following the close of the stock market, Advanced Micro Devices released a strong quarterly earnings report:
→ Earnings per share came in at $0.48 (roughly in line with forecasts);
→ Revenue reached $7.68 billion (versus expectations of $7.41 billion).
At the same time, CEO Lisa Su stated: “We’re well positioned to deliver significant growth in the second half.”
However, despite the solid performance and optimistic outlook, AMD shares declined in after-hours trading, falling below $165.
The decline in AMD’s share price following a strong report may be attributed to excessively high expectations and the stock's overbought condition ahead of the announcement.
Technical Analysis of the AMD Stock Chart
Since April 2025, price fluctuations have formed an ascending channel (highlighted in blue). In July:
→ the price broke above the upper boundary of this channel, moving sharply higher (marked in purple);
→ the RSI indicator remained above the 50 level throughout.
We can assume that investors were following the meteoric rise of Nvidia (NVDA) shares and were betting that the ongoing AI boom would enable AMD to deliver extraordinary results. However, these hopes were not fully realised — the classic case of "buy the rumour, sell the fact".
As a result, AMD shares may open today with a bearish gap. From a technical standpoint, this suggests that the price is returning to the limits of the blue ascending channel, where the midline and lower boundary may act as support levels. The psychological support level at $150 also appears significant.
This move may be interpreted as a correction — and once the excessive optimism accumulated in July dissipates, bulls may attempt to resume the upward trend, supported by fundamentally strong data.
This article represents the opinion of the Companies operating under the FXOpen brand only. It is not to be construed as an offer, solicitation, or recommendation with respect to products and services provided by the Companies operating under the FXOpen brand, nor is it to be considered financial advice.
