AMD trade ideas
AMD: 172.28 Bullish Entry: 180.00/184.00 Stop 178.50 Target 182.00/184.00
Bearish Entry: 172.00/170.00 Stop 173.20 Target 170.00/168.00...double top zone at 182.00

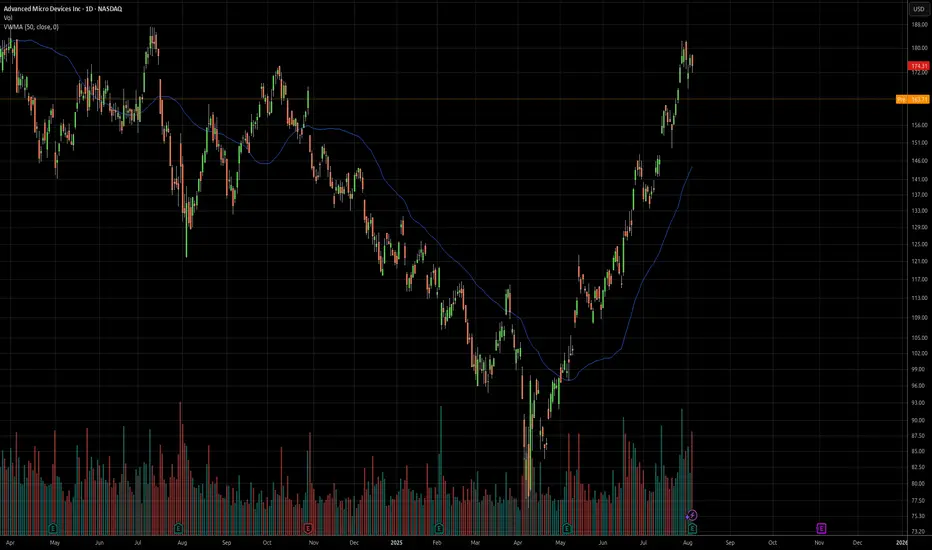
AMD stock up over 20% off the lows- outperform NVidia?AMD is still cheap relative to its growth and still way down from all time highs.
Seeking alpha analysts expect 25-30% annual growth in earnings yearly. The stock is still in the low 20s PE. Stock can double and still be a good business worth owning for the long term and let compounding earnings work.
Low rsi and bollinger bands gave us the signal to buy, we bought with leverage, now we are in the shares unlevered.
Target would be all time highs over the next 2-3 years.

AMD: 172.76 4:41PM 8/11/25 For mondayBullish Entry: 178.00 / 180.00 Bullish Stop: 176.00 Bullish Target: 180.00 / 182.00
Bearish Entry: 170.00 / 168.00 Bearish Stop: 172.00 Bearish Target: 168.00 / 166.00

AMD Post-Earnings: Sharp Drop Despite Solid RevenueDisclaimer:
This content is for informational and educational purposes only and does not constitute financial, investment, or trading advice. All opinions expressed are based on current market conditions and are subject to change without notice. You are solely responsible for your own trading decisions. Always conduct your own research and consult with a licensed financial advisor before making any investment decisions. Trading involves significant risk of loss and is not suitable for all investors.
---
AMD reported Q2 2025 revenue of $7.7B (↑32% YoY, beat est.), but shares fell >5% after hours. EPS met expectations at $0.48, yet margins were hit by an $800M China-related inventory charge.
Data center growth disappointed at +14%, missing high AI-driven expectations. Despite strong Q3 guidance ($8.7B rev), investors reacted to lack of MI308 revenue from China and slower AI chip ramp.
Forward view: All eyes on MI350 deployment, MI400 launch, and export license clarity. Execution must now justify elevated valuation. Until then, volatility likely persists.
---
I'm looking at these 4 trading ideas based on AMD's current setup post-earnings:
1. Short-Term Reversal Play (Swing Long)
Setup: AMD dropped >5% on earnings despite solid guidance.
Idea: Enter long near $165–168 support zone (post-earnings low) for a rebound to the $175–178 gap fill.
Risk: Tight stop under $163.
Catalyst: Oversold bounce + dip-buyers reacting to bullish Q3 outlook.
2. Gap-Fill Fade (Short-Term Short)
Setup: If AMD rallies into $177–179 to fill the earnings gap.
Idea: Enter short into resistance if volume fades or rejection confirms.
Target: $168–170.
Risk: Stop above $180.
Catalyst: Sell-the-news flow, especially if macro/headwinds persist.
3. Mid-Term Accumulation (AI Growth Thesis)
Setup: Valuation reset + long-term AI roadmap (MI350 → MI400).
Idea: Gradual long build on dips below $170, targeting $200+ by H1 2026.
Timeframe: 6–12 months.
Catalyst: China export resolution, MI400 launch, AI GPU traction.
4. Options Strategy: Neutral-to-Bullish Bias
Setup: IV remains elevated post-earnings, possible consolidation ahead.
Idea: Sell cash-secured puts at $160–165 or deploy bull put spreads (e.g., Sep $165/$155).
Objective: Profit from time decay if AMD holds range.
Catalyst: Theta income with defined risk while waiting for next trend.
AMD: 171.70Bullish Entry: 170.00 / 174.00 Stop 168.00 Bullish Target: 176.00 / 178.00 Stop 170.50
Bearish Entry: 170.00 / 166.00 Stop 170.50 Bearish Target: 164.00 / 162.00

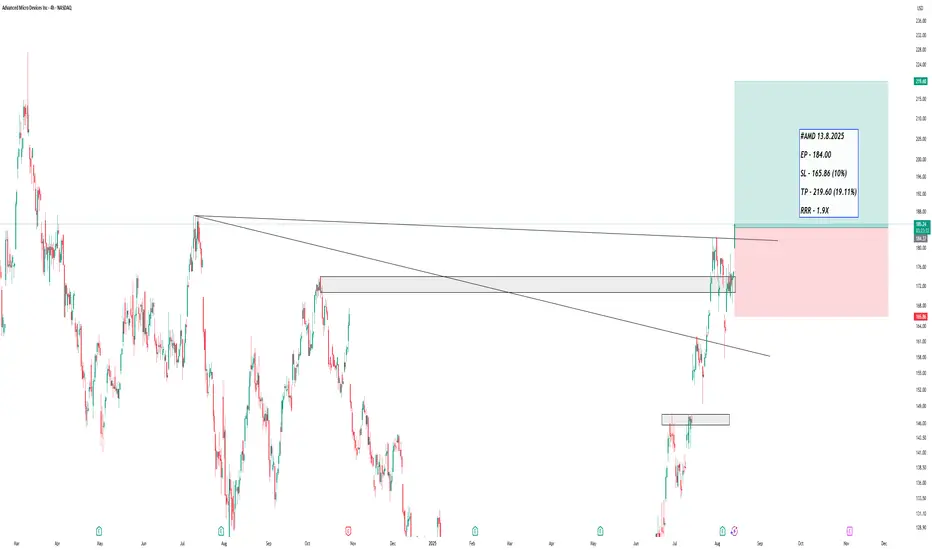
AMD Projection and Entry PointThis is speculation just like before, which played out very well so this is me having another shot at it.
Going off of the prior cycle AMD went through and comparing it to the one it's currently in, you can see a lot of similarities.
Learning from it's past and seeing how it likes to react to certain Fib levels, you can see that the 76.40% has been respected as a major level of resistance which resulted in its short retracement back in June '23 , It also acts as a very strong level of support as shown in August '24.
Assuming AMD rejects at the current 76.40% level again, using the prior 76.40% you can see it aligns perfectly with the golden ratio I have setup as my buy entry.
It all lines up too perfectly that in my mind, I'm certain it will play out. But of course it's all speculation, and the markets do as they please.
AMD WEEKLY TRADE SIGNAL (7/31/25)
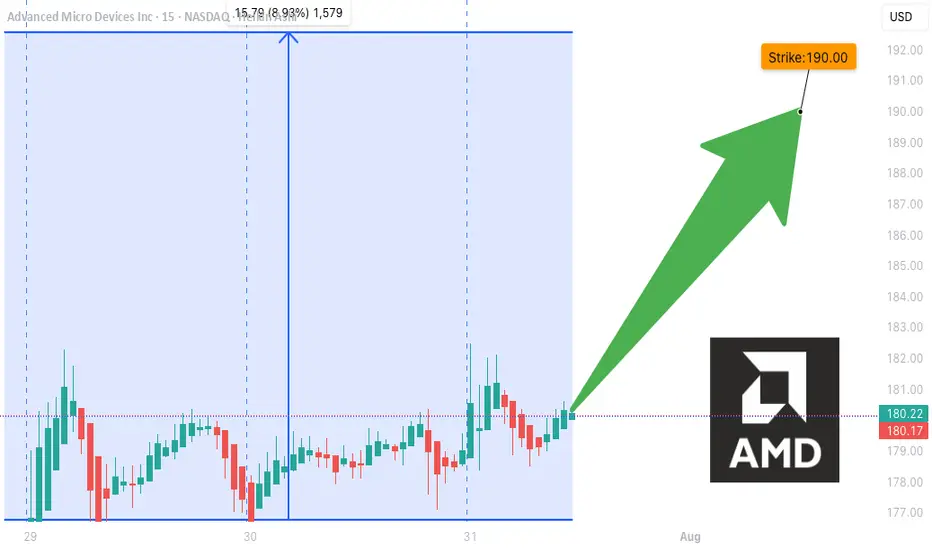
### 🚀 AMD WEEKLY TRADE SIGNAL (7/31/25)
📈 **MARKET SNAPSHOT**
🟢 Daily RSI: **86.0** 🔥
🟢 Weekly RSI: **80.4**
📊 Volume: 🔺 1.5x (Institutional surge)
💬 Call/Put Ratio: **1.90**
🌪 Gamma Risk: **HIGH (1DTE)**
🧠 Sentiment: **Extremely Bullish** across all models
---
💥 **TRADE IDEA**
📍 Ticker: **\ NASDAQ:AMD **
📈 Direction: **CALL (LONG)**
🎯 Strike: **\$190.00**
💵 Entry: **\$0.51**
🎯 Target: **\$0.90** (+75%)
🛑 Stop Loss: **\$0.30**
📆 Expiry: **Aug 1 (Friday)**
📊 Confidence: **85%**
⏰ Entry: Market Open (Time-sensitive!)
---
🧠 **STRATEGY CONTEXT**
✅ Bullish momentum from AI sector hype
✅ Institutional call buying volume spiking
⚠️ 1DTE = High Gamma Risk = TRADE FAST OR DON’T TRADE
⚠️ Manage decay & exit early if momentum stalls
---
📌 Signal Posted: 2025-07-31 @ 12:17 PM ET
\#AMD #OptionsAlert #AITrade #WeeklyOptions #TradingViewViral #1DTE #GammaSqueeze
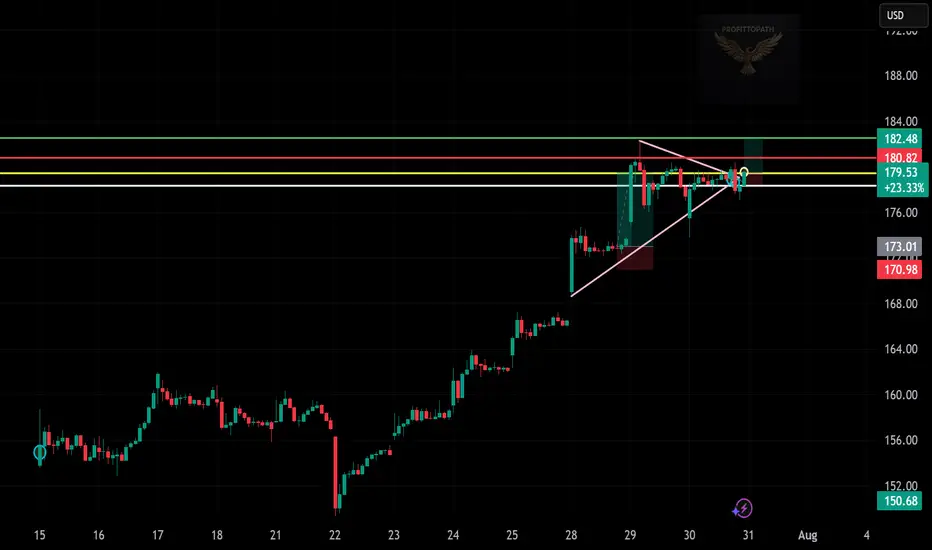
“AMD Breaks Out — Triangle Setup in Action”
📈 Trade Snapshot:
AMD breaks a tight triangle range with momentum. A clean move above $180.82 puts $182.48 in sight.
🎯 Plan:
→ Entry: $179.53
→ SL: ~$173.00
→ Target: $182.48
📌 Clear structure, low-risk entry, breakout confirmed. Let it run.
📋 Hashtags:
#AMD #BreakoutTrade #ChartSetup #TechnicalAnalysis #ProfittoPath #SwingTrade #PriceAction #SmartMoney
AMD Short AMD has the potential to fall from the $200 level within the Fair Value Gap (FVG) zone, and based on the Cypher pattern, it is aiming to reach a lower FVG zone as the next target.

Quick draw upI did quick and simple T/A and in my opinion seems to be the likely outcome. EMA lines are about to cross, it has made a lower low, which has now flipped the Fibonacci and likely to get rejected at the 61.80% - 50% range. The path lines aren't placed specific to the timeframes so ignore that it stretches way into 2025.

New Highs Will Be DelayedThis is how it's going to be. You can disagree and be against it all you want, but much more consolidation in price will occur first over the long term, before a proper bull run returns.

AMD: Potential Mid-Term Reversal from Macro SupportPrice has reached ideal macro support zone: 90-70 within proper proportion and structure for at least a first wave correction to be finished.
Weekly
As long as price is holding above this week lows, odds to me are moving towards continuation of the uptrend in coming weeks (and even years).
1h timeframe:
Thank you for attention and best of luck to your trading!
AMD Weekly Trade Alert (2025-07-29)
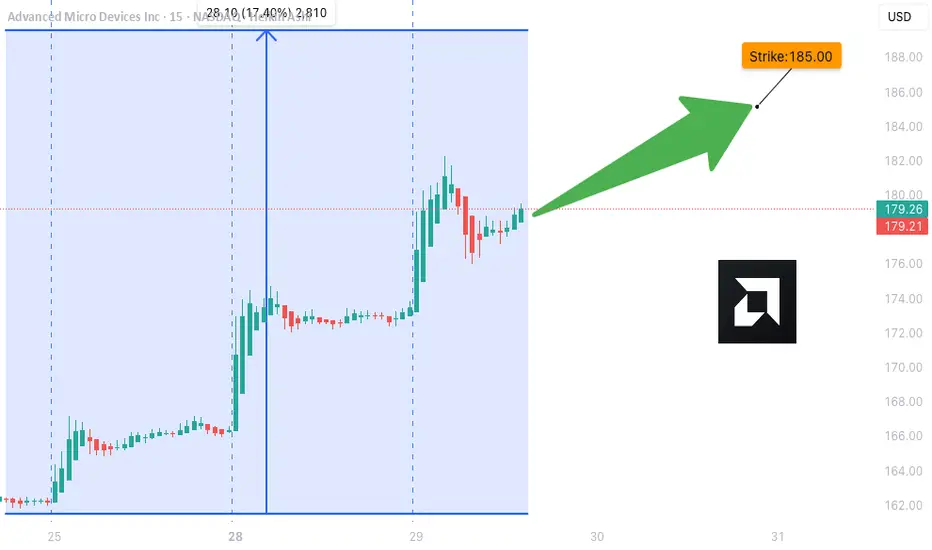
**🔥 AMD Weekly Trade Alert (2025-07-29) 🔥**
💹 *Momentum Confirmed. Calls Loaded. Let’s Ride.*
📈 **Key Bullish Signals**
✔️ Daily RSI: **83.2** (Rising)
✔️ Weekly RSI: **79.9** (Rising)
✔️ Call/Put Ratio: **2.03** 🧨
✔️ Volatility: Low (VIX = 15.2)
⚠️ Volume Weak (0.9x) – But not a dealbreaker.
---
**🎯 TRADE SETUP**
🔹 **Ticker**: \ NASDAQ:AMD
🔹 **Strategy**: Weekly Naked Call
🔹 **Strike**: \$185C
🔹 **Entry**: \$0.66
🔹 **Profit Target**: \$1.32 (100%)
🔹 **Stop Loss**: \$0.33
🔹 **Expiry**: 2025-08-01
🔹 **Size**: 3 Contracts
🔹 **Confidence**: 75%
---
**🧠 WHY THIS WORKS**
🔋 Momentum → STRONG
💰 Institutions are loading up calls
🧘 VIX = calm
⚡ Short gamma risk = fast payoff or cut
---
📢 **Watchlist it. Trade it. Exit fast.**
💬 Comment “🔥AMD” if you’re in.
🔁 Repost if you see \$190 coming.
\#AMD #OptionsTrading #CallOptions #TradingView #WeeklySetup #MomentumPlay #BullishSignal #MarketMomentum
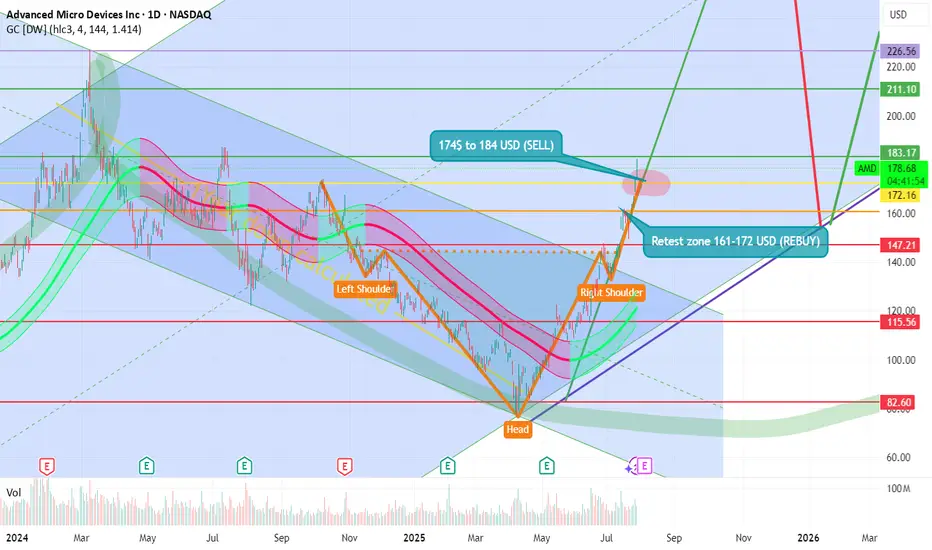
AMD we have made it at 170 USD guys! TSXGANG! 📊 AMD Stock Technical Analysis
🧠 Head and Shoulders Pattern
- This chart shows a classic head and shoulders formation:
- Left Shoulder: First peak around ~$172
- Head: Highest peak near ~$183
- Right Shoulder: Second peak returning to ~$178
🔎 This pattern often signals a potential reversal in an uptrend—investors might expect selling pressure ahead if confirmed.
📉 Sell Zone 📍
- 💸 Highlighted zone: $174–$184 USD
- 🚨 Considered an overbought region—ideal for profit-taking or short positions
Current price: $178.82 USD 📌 (+$5.16 / +2.97%)
This price lands right in the sell zone, suggesting caution as upside might be limited short-term.
🔄 Retest Zone (Support) 📍
- 🛡️ Marked between $161–$172 USD
- 🤝 A potential buy zone where price could stabilize or rebound
If AMD pulls back, this is where buyers might re-enter the market for long positions.
🧪 Trend Indicators & Sentiment
- 📈 Recent bullish move (+2.97%) shows strength—but could also be testing resistance
- 🔁 Watch for confirmation of either a breakout above $184 or a pullback to retest support
- 🧭 Overall sentiment looks cautiously optimistic but technically fragile near the upper resistance
🧠 Final Thoughts 💬
This chart analysis suggests AMD may be approaching a turning point. Traders should keep an eye on volume, macro tech trends, and market reactions in the coming sessions.
The information and publications are not meant to be, and do not constitute, financial, investment, trading, or other types of advice or recommendations.
Thank you!
Subcribe to TSXGanG! 🧠🎯
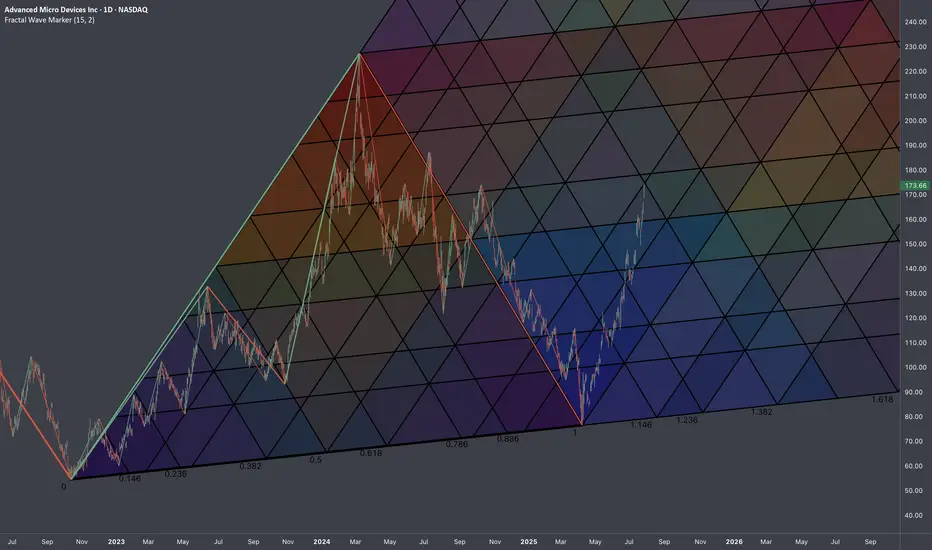
$AMD: Fractal Geometry (Cycle 2022-2025)🏛️ Research Notes
3 Coordinates used for base L-H-L
Fragmented with color spectrum fibs:
Extending structure with same scaling laws:
The chart intended to show objective structure covering unfolding progressions within cycles.
AMD - Will Buyers Show Up at Longterm VAL???With the markets getting oversold, does AMD, who has been in a long downtrend, finally find buyers at its longterm VAL? This is the area to see if buyers finally show up in my opinion.

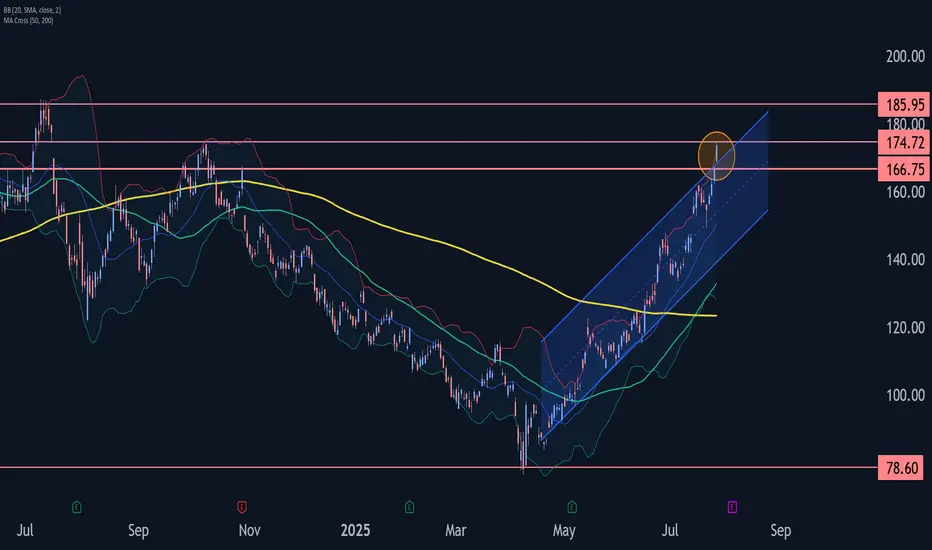
AMD Wave Analysis – 28 July 2025
- AMD broke resistance zone
- Likely to rise to resistance level 185.95
AMD recently broke the resistance zone between the resistance level 166.75 and the upper resistance trendline of the daily up channel from April.
The breakout of this resistance zone accelerated the active impulse waves 3 and (3).
Given the overriding daily uptrend, AMD can be expected to rise to the next resistance level 185.95 (former multi-month high from July of 2024).
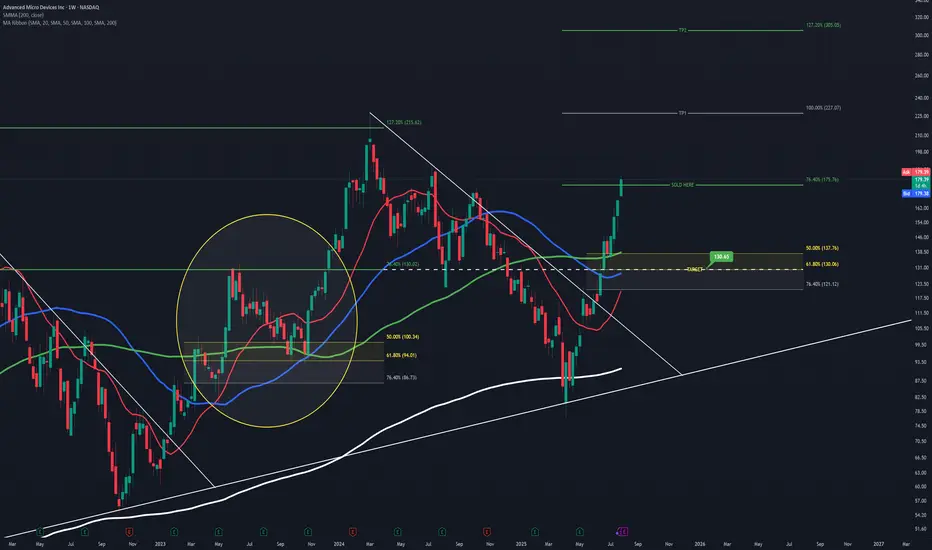
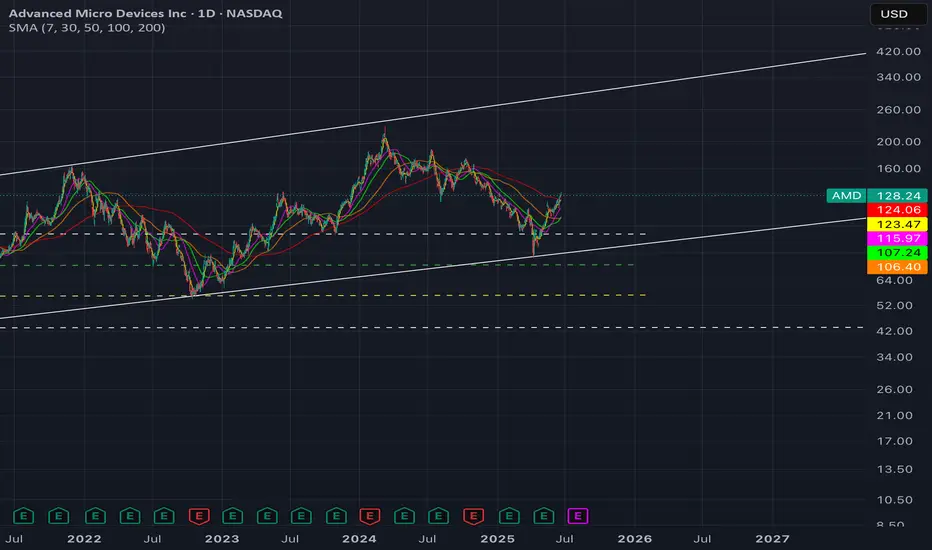
AMDthe weekly price action of Advanced Micro Devices Inc (AMD):The stock is trading near a critical resistance zone marked with a rectangular box just below $180.In the past, this area acted as a rejection point, evident from prior pullbacks when the stock neared these levels.
The chart reflects a larger declining channel. Current price action shows AMD approaching the upper boundary of this channel, which may act as dynamic resistance.
If AMD breaks above the $180 resistance convincingly, there’s potential for the stock to aim for higher targets, such as the next major zone ($240).
Failure to break above $180 may lead to a retest of lower levels, potentially near $140 or the breakout zone ($100-$120).

$AMD supercycle ; PT $300-350 by 2027- NASDAQ:AMD has likely entered a supercycle and we have entered Agentic AI world where inferencing is the main area of investment.
- Model Training is still important but we have entered a stage where lot of open source models and many proprietary vendors are close to each other when it comes to performance.
- Companies are trying to monetize their investments and one critical thing is model inference i.e making predictions.
- NASDAQ:AMD is poised for the agentic ai boom and therefore next 2 years are golden years for $AMD.
AMD coiling to $148-160 range by post-earnings- NASDAQ:AMD is one of the beaten down names. It's not too cheap at the current valuation but it's growth for upcoming 2-3 years are promising which deserves a higher multiple.
- 25%+ growth rate when revenue is in billions is a big deal unlike NASDAQ:PLTR which has high 20s % growth rate on a revenue of 250 mil a quarter.
- Technical supports strong rebound to 148-160 range to test 200 SMA. Good setup for Q1 2025.
- Downside risk is to 94-105 if it continues to meltdown.

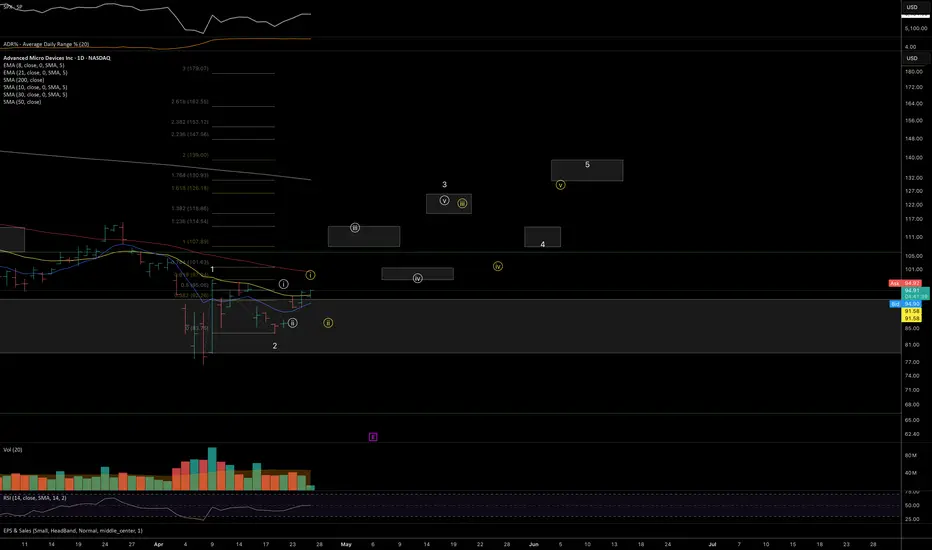
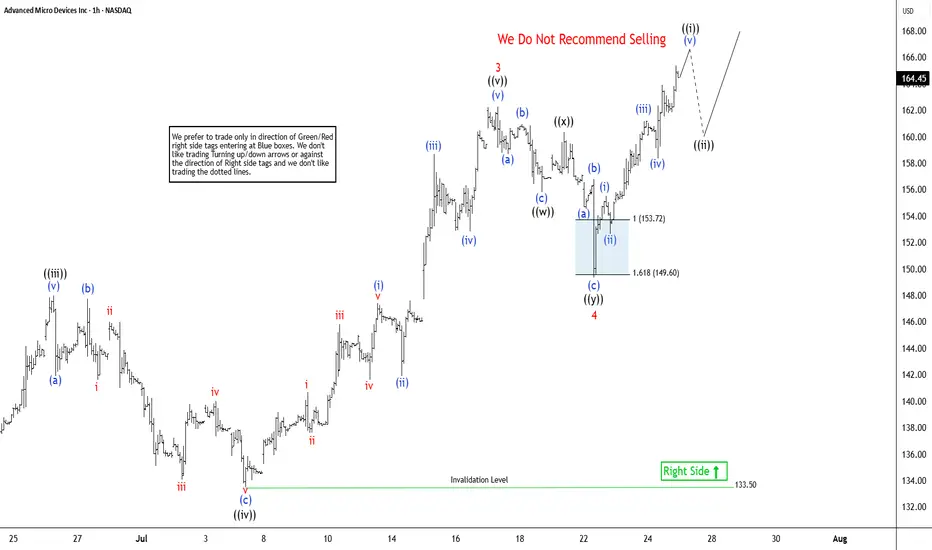
Elliott Wave Outlook: AMD Expects Pullback Soon Before RallyThe Advanced Micro Devices Inc., (AMD) favors rally in impulse Elliott Wave sequence from 4.09.2025 low & expect upside in to 168.36 – 190.36 to finish it. Impulse sequence unfolds in 5, 9, 13, 17…., swings & ends with momentum divergence. In daily, it ended pullback in 3 swings at 75.22 low in blue box area from March-2024 high. It is trading higher in nest & expect 13 swings to finish the impulse ((1)) before correcting next. Currently, it favors rally in 7th swing in daily & expect end soon in to 165.63 – 179.16 area before correcting in (4) as 8th swing. In 4-hour, it ended (1) of ((1)) at 97.91 high, (2) at 83.75 low in 4.21.2025 & favors rally in (3) as extended wave. Within (3), it placed 1 at 122.52 high, 2 at 107.09 low, 3 at 162.36 high, 4 at 149.34 low of 7.22.2025 & favors rally in 5. It is showing higher high since April-2025 low.
Below 3 high of 162.36, it ended 4 pullback in double three correction at 149.34 low. It ended ((w)) at 155.81 low, ((x)) at 160.34 high & ((y)) at 149.34 low. Above 4 low, it favors rally in ((i)) of 5 in to 165.44 – 170.43 before correcting next. Within ((i)), it ended (i) at 155.53 high, (ii) at 152.66 low, (iii) at 161.20 high, (iv) at 158.36 low & favor higher in (v). It appears three swings in (v) & expect pullback before final push above 161.52 low before correcting in ((ii)). Alternatively, the current cycle from 4 low can be 5 of (3) before it corrects in (4). In either the case, the next pullback should remain supported. In 4-hour, it is trading in 11th swing & expect pullback in 12th swings later before final rally. We like to buy the pullback in 3, 7 or 11 swings at extreme area for the upside in ((1)).
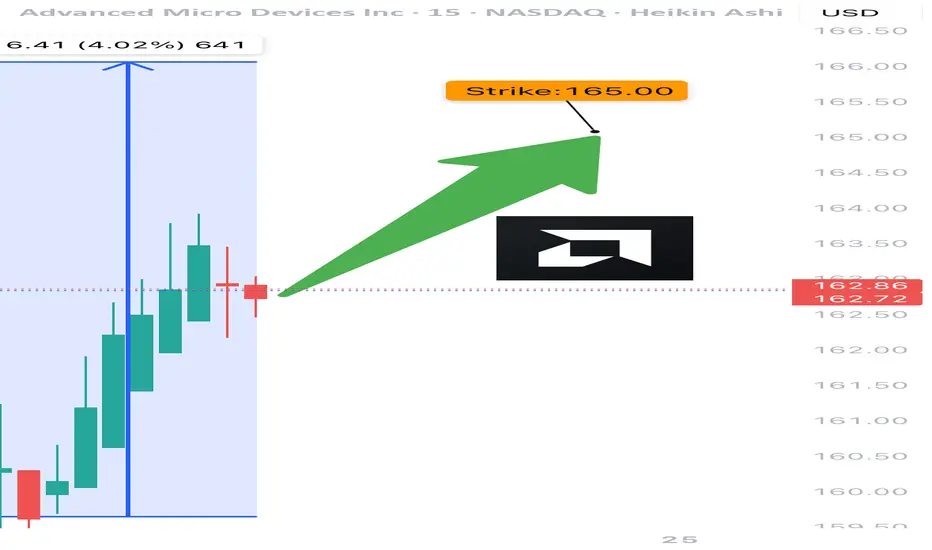
AMD TRADE ALERT (07/24)
🚨 AMD TRADE ALERT (07/24) 🚨
Options flow is screaming bullish 📈
🧠 Key Insights:
• Call/Put Ratio: 1.80 (🔥 heavy call bias)
• RSI: Daily 75.5 / Weekly 77.2 = strong momentum
• Volume = weak ⚠️ but sentiment remains bullish
• High gamma risk = explosive potential near expiry
💥 TRADE IDEA
🟢 Buy AMD $165 Call exp 7/25
💰 Entry: $0.80
🎯 Target: $1.60
🛑 Stop: $0.48
📊 Confidence: 75%
⚠️ Quick expiry = fast moves. Monitor closely.
#AMD #OptionsFlow #UnusualOptionsActivity #TradingView #OptionsTrading #BullishSetup #TechStocks #DayTrading #GammaSqueeze #OptionAlerts