BRKA trade ideas
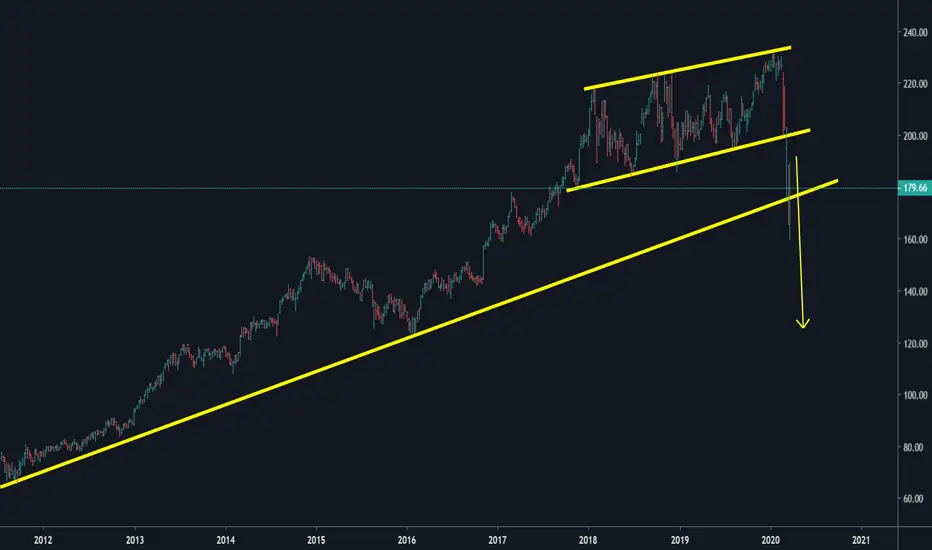
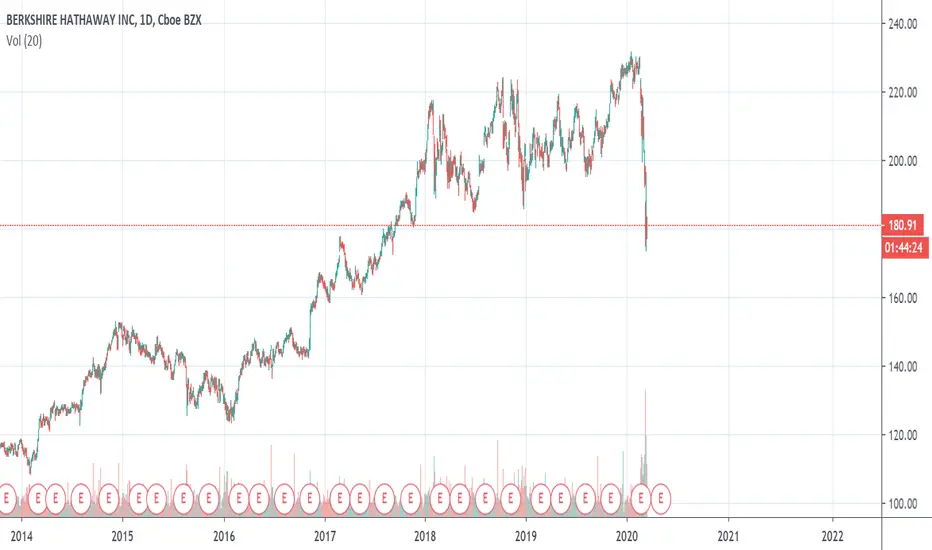
BRK.B - Going downHello everyone, we are currently in a financial crysis so given the fact how much the previous crysis were for around 1.5-2 years, around March-May we should expect the price to be at around 100$ and then rise back up. Right now we will most likely see some retracement, but it won't be for long.
BRK B, ARE WE GOING TO INVEST OR SPECULATE?(More in description)Hi, traders.
My name is Lukas and I am a beginner in trading, respectively, I only trade 6 months. But that means I have to do the necessary analyzes without it I can't trade. I want to show you how I work on myself and document my beginnings. I use Vix and my strategy is built on to return to average. I highlight the important support levels and resistances that flow from the volume profile, all drawn on graph. These zones determine the ability to respond in some way to the market from 1 to 3, with 1 being the largest.
Short description of analysis:
We're probably waking up to the next sucking Monday. At such times, technical analyzes are unnecessary. You ask why? because of sentiment and panic in the market. You can see this in my previous analyzes. That is why I have decided to focus on investing in BRK B. I have written many times in analyzes that we need to focus on a long period of time because the market panic is high. VIX shows us the values almost as we experienced in 2008. What is unbelievable as we look at how dangerous COVID-19 is (I don't take anything lightly), but the panic associated with COVID-19 is not relevant. Furthermore, the effects of the panic, the cooling of the economy are already felt, but we do not yet have Q1 results, while the expectations are very negative. That is, in the short term, with full seriousness short (if you have a large account where you can afford such speculation - there are potentially nice profits). In case you don't have a lot of experience opt for investment (make your own rules how much you are willing to invest - never go ALL IN !, break your investments into the zones where you buy) persistent and responsible. Of course, my analysis does not serve like market forecasts and I am not responsible for your trades if you use my analysis for your own trades.

Stocks are Crashing so will Berkshire HathawayStocks are Crashing so will Berkshire Hathaway, unless Warren Buffet will go into CRYPTO :-D
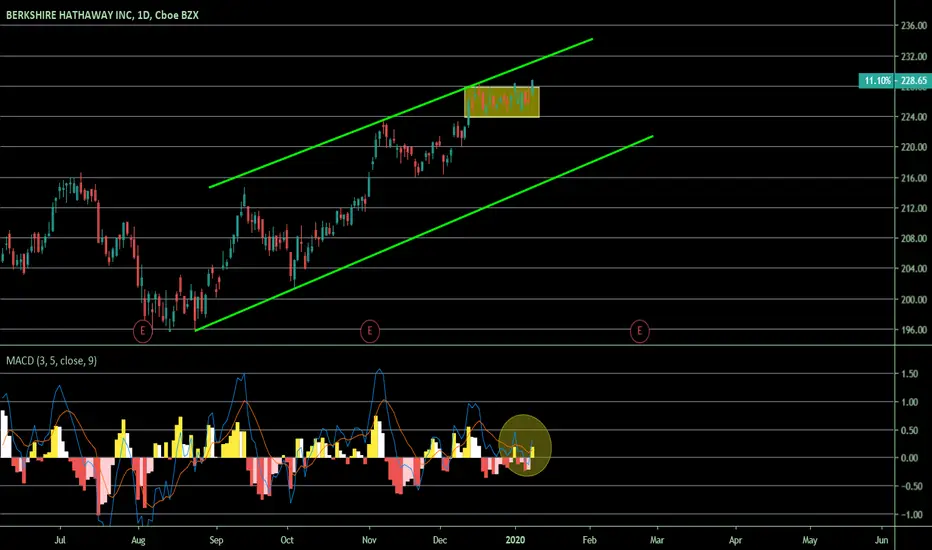
Back to the bottom of the channel
***************************************
THIS IS NOT A TRADING ADVICE
***************************************
For recession winners, look at cash-rich companies with low debtBerkshire Hathaway is famous for sitting on a huge pile of cash. In fact, Morgan Stanley complained just last year that Berkshire hadn't been "aggressive" enough with its cash. Well, now Berkshire's cash pile is looking pretty good as the market heads into a major downturn and buyers have lots of opportunity to snatch up assets on the cheap.
In addition to Berkshire, other cash-rich companies with low debt include Alibaba, Baidu, Alphabet, Cisco, and Facebook. These companies have additional tailwinds from the fact that they're heavily involved in ecommerce and the digital space. Facebook use may increase as people spend time at home, and Cisco offers products for remote workers. Expect these giants to initiate share buybacks or mergers and acquisitions as the market finds a bottom later this year.
Berkshire Hathaway entries looking amazing!! BRK.B Hey traders, here is another great opportunity to purchase a great company with record high cash balances. Current cash balance = $125 Billion USD
For more than a year, markets were perplexed by the abnormal cash balance of Berkshire Hathaway Inc. NYSE:BRK.A NYSE:BRK.B and whether Buffett would ever get a chance to complete a large acquisition with that money, as there seemed to be no way that markets would enter bear territory any time soon.
However, what many considered impossible has happened, and both the S&P 500 Index and the Dow are trading more than 20% below their recent highs, according to Bloomberg data. This has improved the prospects for a large acquisition, and successfully completing one could be a catalyst that drives the share price of the conglomerate higher.
So lets get straight to the fun stuff!!
Before entering a trade three types of analysis should be performed.
Fundamental Analysis = The study of financial statements and economic news. (Overall Trend)
Technical Analysis = The study of chart history. (Entry & Exit Strategies)
Sentimental Analysis = The study of the markets current psychology and traders psychology.(Instinct)
After performing the three analysis below are my results:
NYSE:BRK.B
Fundamental Analysis = LONG-TERM (BUYING)
Technical Analysis = SHORT-TERM (SELLING)
Sentimental Analysis = Market fears currently higher than confidence.
To better explain:
This means that right now momentum is headed downwards technically but the overall trend is up fundamentally.
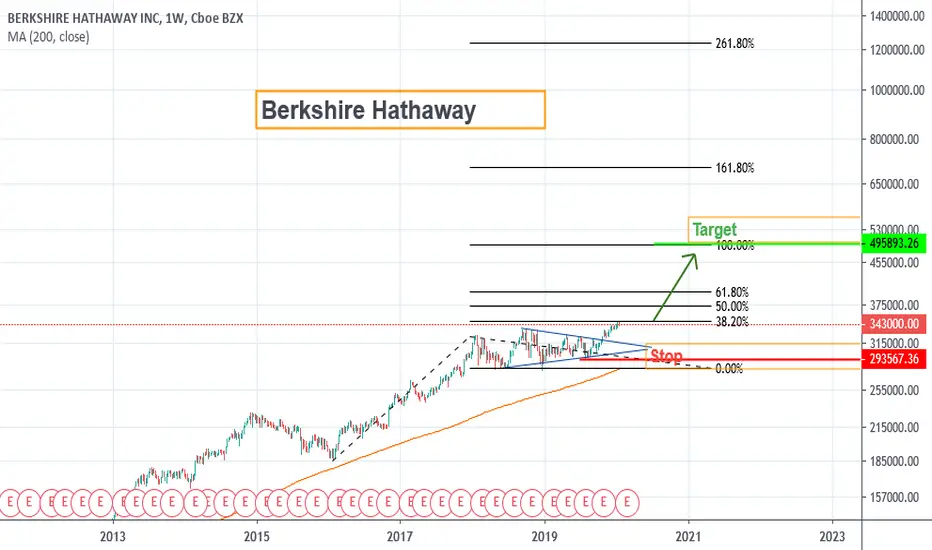
So since we know the overall trend is upwards but we are currently headed downwards it creates the perfect timing to use our Fibonacci Retracement tool. A tool that is used to find important entry and exit levels in a trending market. Which is traditionally applied to the low & high of a trend. Here were my results:
As you can see in the chart above we have already retraced with a spike below the 38.2% level at $190.02. Markets are still showing downwards momentum that is headed towards the 50% level - 61.8% level.
MY SUGGESTION:
Place LONG orders totaling anywhere from 1-5% of your total trading capital on each retracement level below:
23.6% = $205.81 (BUY)
38.2% = $190.02 (BUY)
50.0% = $177.26 (Great trade opportunity) (BUY)
61.8% = $164.50 (What I consider the PERFECT IDEAL TRADE) (BUY)
78.6% = $146.34 (ABSOLUTE BARGAIN!!) (BUY)
Take profit: $231.61 at the previous ATH . (All Time High) Be patient and trust the process. This monster of a stock will most definitely return to break more records in the upcoming months when the continuation wave arrives and aligns with the fundamentals.
If you enjoy these quick signals/tips make sure to FOLLOW ME & show support by leaving a LIKE!!

BERKSHIRE HATHAWAY(BRK.B) | Long-term Investment "Plan".Hi,
Berkshire Hathaway Inc. is an American multinational conglomerate holding company headquartered in Omaha.
The company is known for its control and leadership by Warren Buffett, who serves as chairman and chief executive, and Charlie Munger, the company's vice-chairman. In the early part of his career at Berkshire, Buffett focused on long-term investments in publicly traded companies, but more recently he has more frequently bought whole companies. Berkshire now owns a diverse range of businesses including confectionery, retail, railroads, home furnishings, encyclopedias, manufacturers of vacuum cleaners, jewelry sales, newspaper publishing, manufacture and distribution of uniforms, and several regional electric and gas utilities.
According to the Forbes Global 2000 list and formula, Berkshire Hathaway is the third-largest public company in the world, the tenth-largest conglomerate by revenue and the largest financial services company by revenue in the world.
As of February 2019, Berkshire is the fifth-largest company in the S&P 500 Index by market capitalization and is famous for having the most expensive share price in history with Class A shares costing around $300,000 each. This is because there has never been a stock split in its Class A shares and Buffett stated in a 1984 letter to shareholders that he does not intend to split the stock.
One of the strongest companies in the world has started to reach good buy zones, technically. Yes, those kinds of market situations are scary but remind yourself of your long-term investment strategies! Firstly, do you like sales? Yes, you like sales, then you have to buy when the streets are bloody. It could be risky, actually, it IS risky but still, you have to have a plan!
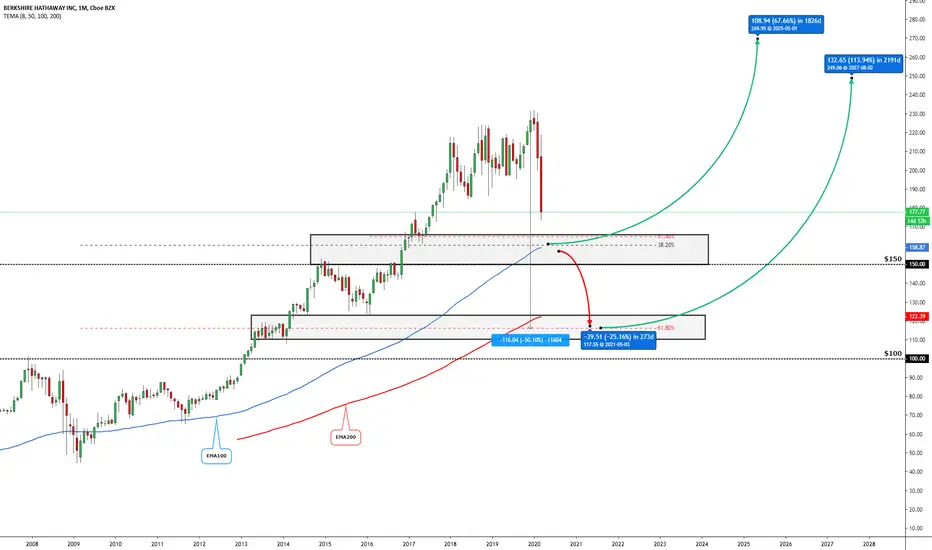
At the moment, I have a plan with Berkshire and it consists of two areas 150-160(1), 110-120(2):
1) Probably, I start to add my positions around $150. There are pretty good criteria which all should act as support levels - different Fibonacci retracement levels, Monthly EMA100, the mid-number itself $150, previously worked support and resistance levels. It should be strong enough for buying a bit for long-term bias in mind.
Now it depends on the market, what does it start to show us. If it doesn't show anything, panic continues and Berkshire stock price starts to fall lower, below my first support area, then I don't want to panic sell my shares, I act as Peter Lynch:
2) “If you can’t convince yourself “When I’m down 25 percent, I’m a buyer” and banish forever the fatal thought “When I’m down 25 percent, I’m a seller,” then you’ll never make a decent profit in stocks!”
So, I have a long-term vision and investment plan, my research about Berkshire is strong, then those sales are just great opportunities to buy it from lower prices (those purchases have to be technically good!!). As he has said, if the price drops 25% from your initial prices then you are a buyer, not a seller, keep in mind!
...and luckily, exactly 25% (obviously, it doesn't have to exactly 25 percent but hopefully you get that point!) down from my first buying area is another strong support level - Monthly EMA200, long-term Fibonacci retracement 62%, 50% drop from the all-time high, previously worked support and resistance level AND if the SP500 drops to where I see it goes (1500-1700) then it would be a massive criterion for my lower buying zone for Berkshire, ALL IN!! :D
"Why can't I wait for this lower buying zone right now?" Yes, you can! ;)
As said, do your own fundamental research and if this matching with my technical analysis viewpoints then you are ready to go! If it doesn't match then...SKIP IT!!
Regards,
Vaido
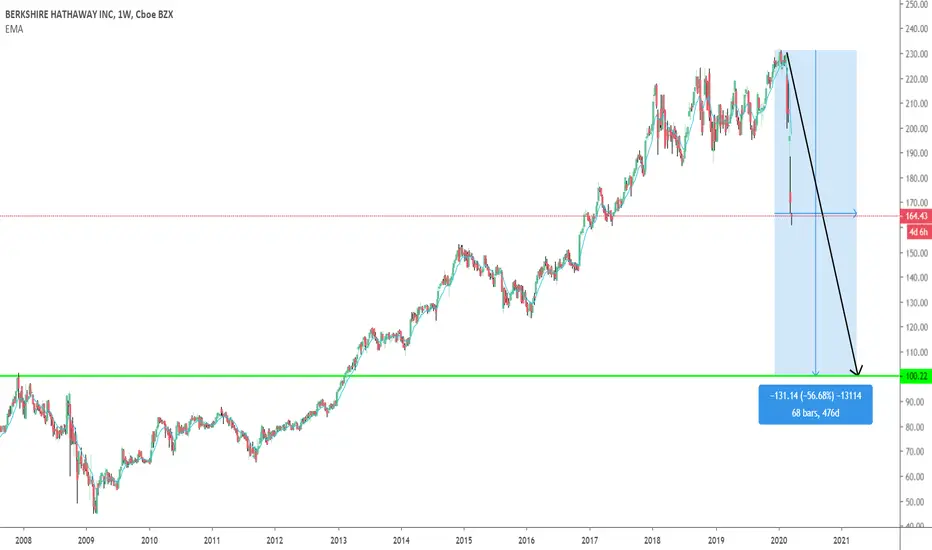
Follow-Up: Protecting Your Income At Age 70-Chart Number 2This is a follow-up of a chart I published at the end of July, 2019.
Basic Trading Techniques Explained (For This Example I Charted-Berkshire Hathaway on July 30th, 2019).
To those of you who follow my published charts, thank you. I have not been writing for quite some time. This is because in September of 2018 I became very ill. I had a severe infection that caused me to have Bell’s palsy. This affected my equilibrium and sight; I was bed-ridden for 7 months and virtually blind. I am slowly getting better, very slowly. What I wrote in July, 2019, still applies:
For those of you investing in wealth management mutual funds I have chosen to show you-BRK.B-(Berkshire-Hathaway). If you are young, in your 20’s or 30’s, I feel-BRK.B is an excellent choice. If you are in your 60’s or 70’s, I feel differently. If you need the income, I feel a 2.75% or 3.0% FDIC or NCUA insured bank or credit union CD is a very wise choice. Why? When the P/E-multiple of the-S&P 500-is above 20 to 25 times earnings, this is very high by any historical standard. The norm is 13 to 15. Last July I believed stocks were extremely over-priced and would fall.
I believe BRK .B-is a fund that will continue down. I have prepared this tutorial for you for two reasons: to keep you from continuing to losing money in a weak position, and to allow you to set up a chart of your own. Then, when you see a "hot tip" on TV, you can determine if the financial asset is worth YOUR MONEY.
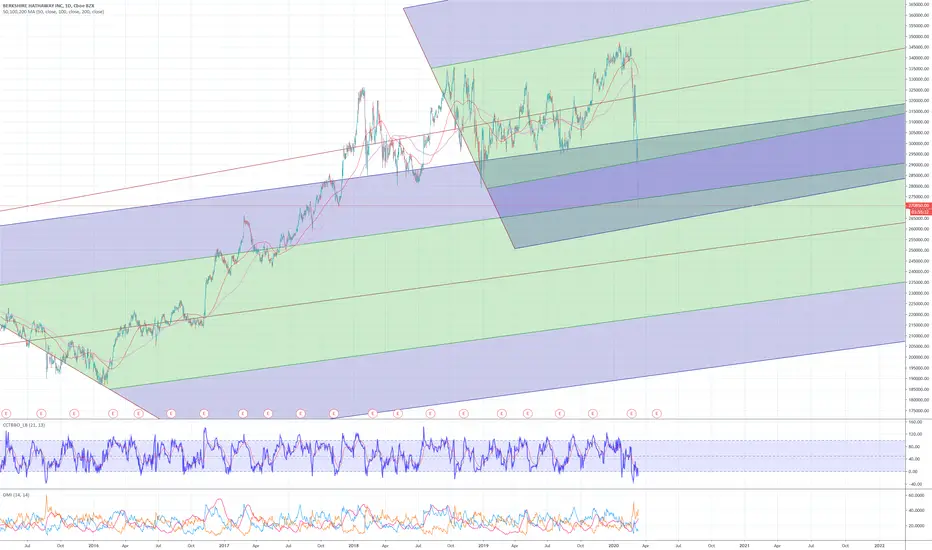
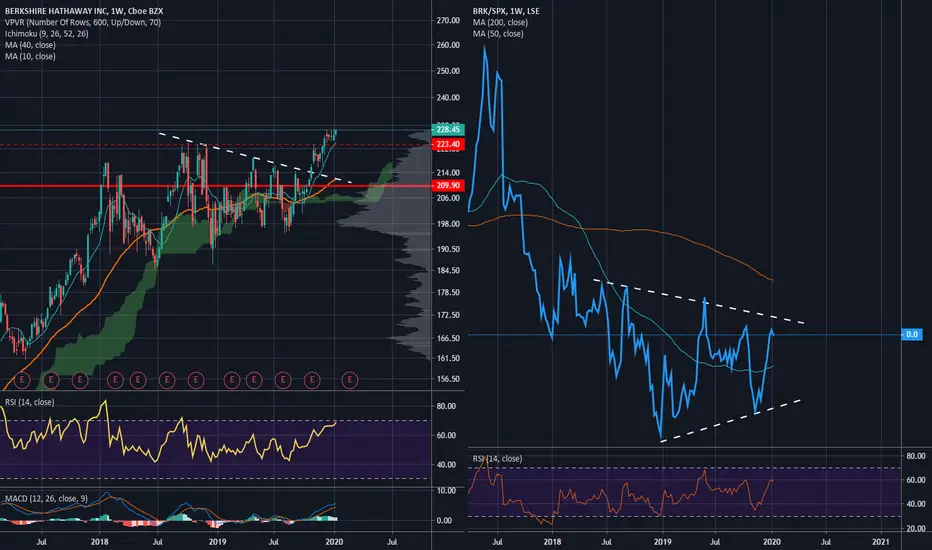
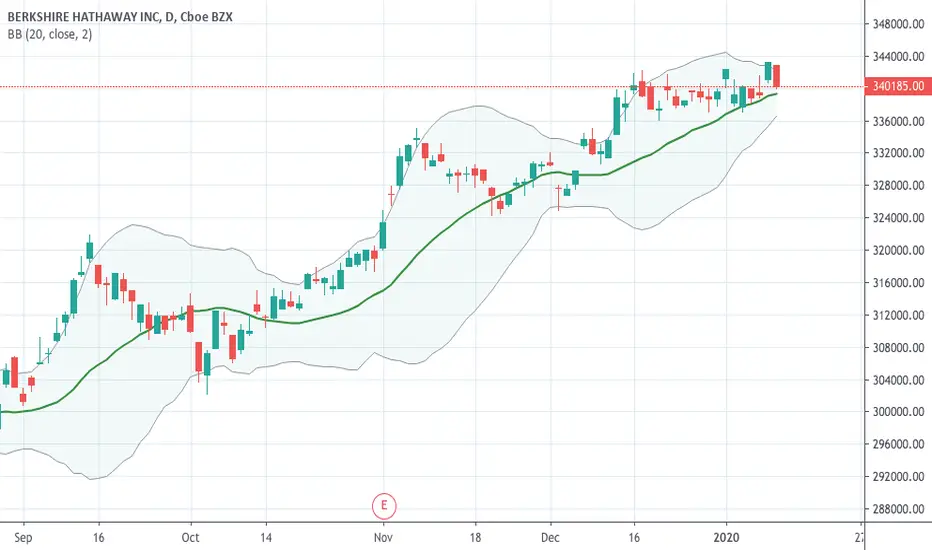
1. Establish the direction of the trend. An effective way to do this is to use a 150 to 180 point regression line. This can be weekly, daily hourly (any time duration you wish to trade). Nevertheless, a 15-minute chart is not nearly as strong as a daily or weekly period . You can base the regression line on the close, but I like open, high, low, close divided by four.
2. Use a price channel, two if possible. Most trending stocks repeat within a channel. I like a 20-day channel, and I have found that if a 20-day channel is violated on the low side, this triggers “sell stops” from traders. The next channel is a 50 day. If this fails on the low side, the established trend may reverse.
3. Ichimoku Cloud . This is a great indicator and I recommend that you use it. If the cloud is red-this is a caution sign.
4. Mean reversion. If you study financial instruments, in this case stocks, they tend to oscillate up and down around the “mean”, or the regression trendline . If a stock is at the upper band of a 20-day price channel , do not chase it, because it is likely to “revert to the mean”. Better yet, if you have an up-trending stock, let it fall (at least) to the lower band of the 20 day price channel . Why? Because the price will tend to “revert to the mean”.
5. ADX . The ADX is a green line, red line, and black line. If the green line is on top, the trend is up. If the red line is on top, the trend is down. The black line indicates the strength of the trend. For example, if the black line is rising, the trend (up or down) is getting stronger. Always use some form of trend quality indicator. Another such “trend quality” indicator is “Aroon”.
6. RSI or Stochastics RSI . These indicators will guide you in the “mean reversion” you plot. For example, the RSI at 80 will tell you that what you are plotting is “over-bought”. Caution: an RSI indicator, in something that is “breaking out to the upside”, can remain over-bought for long periods. You should use some of your other indicators, such as the “Awesome Oscillator”, to guide you on trend reversal. The "AO" is a series of green and red horizontal bars that show you strength and weakness in a stock.
7. The Choppiness Index (CHOP) is an indicator designed to determine if the market is choppy (trading sideways) or not choppy (trading within a trend in either direction). CHOP is not meant to predict future market direction; it is an indicator to be used to for defining the stock’s trendiness only. Higher values equal more choppiness , while lower values indicate directional trending. This is used with….chop zone.
8. I use a chop zone indicator that is green for up-trend, red for downtrend, and white for no trend. If you combine this color-coded format with #7 above ( choppiness ), a green color with a “chop” indicator line that is falling would indicate a strong trend. If the chop line breaks below the lower band, this indicates a statistically significant event (up for green, or down for red). This will tell you that the trend is very strong.
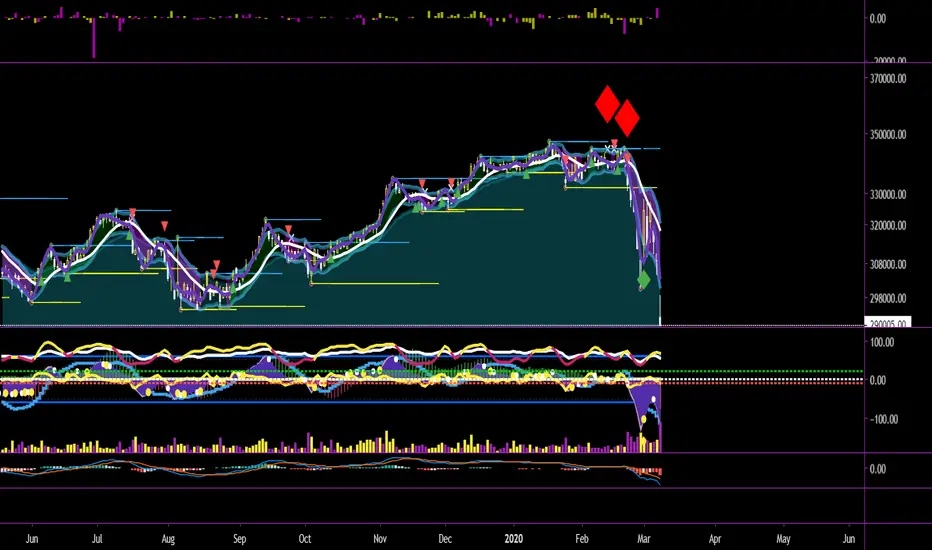
On the above chart there were multiple sell signals at the end of February, 2020. Study them. You may avoid losses in the future.
Remember : Stocks often "over-shoot" on the upside and on the down-side. Wait for a "double bottom" or "head and shoulders bottom" rather than a "V" bottom. Why? A double bottom will demonstrate a possible "retest of the lows". Then, look for a "cup and handle" formation to detect a possible reversal off the bottom. Always wait for a bottom to form, - do not try to catch a falling knife (the stock market) with butter. I hope these trading tips help you.
May all of your trades go well. Don.

BRK.B, SUPPORT AND RESISTENSE ANALYZE, 4.3.2020 Hi, traders.
My name is Lukas and I am a beginner in trading, respectively, I only trade 6 months. But that means I have to do the necessary analyzes without it I can't trade. I want to show you how I work on myself and document my beginnings. I use Vix and my strategy is built on to return to average. I highlight the important support levels and resistances that flow from the volume profile, all drawn on graph. These zones determine the ability to respond in some way to the market from 1 to 3, with 1 being the largest.
Short description of analysis:
At the moment, we are still haunted by the corona virus. Sentiment is set to go downward, but we must not be pulled down by the crowd, because various other fundamental indicators do not show what the market is currently showing. Focus on longer-term deals (6 months). Therefore, I also decided to choose BRK.B. Think rationally.Of course, my analysis does not serve like market forecasts and I am not responsible for your trades if you use my analysis for your own trades.


Buffet's the King of the Bag HoldersI think Buffet is a smart dude that was born at the correct time. Unfortunately, his investment ideals used by someone starts investing in more recent times is likely to results in large losses. This will probably also be reflected in Berkshire itself.
The stock current trades at important resistance levels and has the formation of a butterfly top. This gives good shorting opportunities.

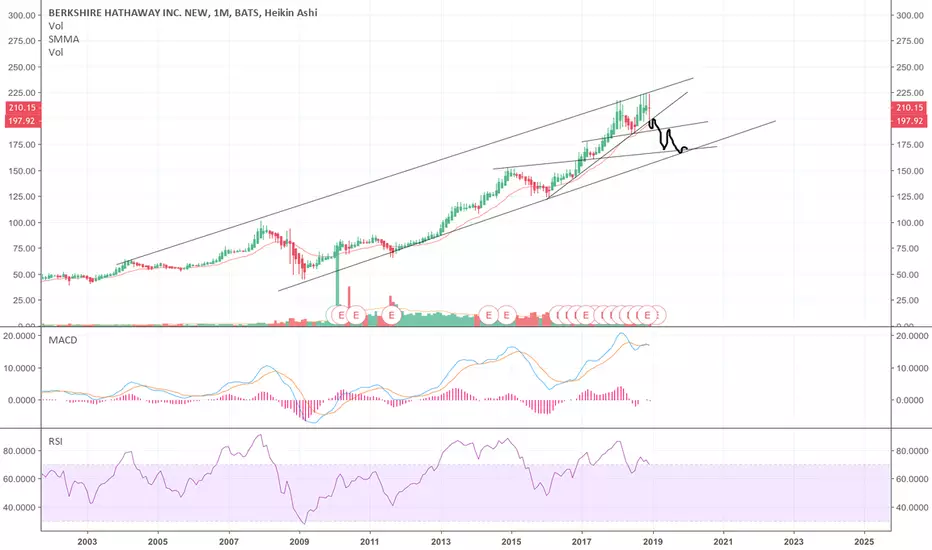
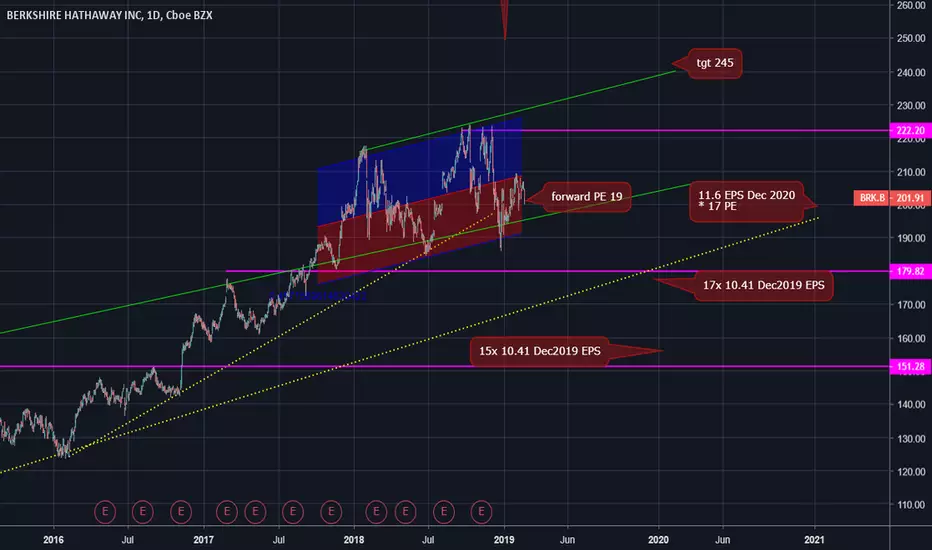
BRK.b valuationAt over 19x forward earnings it would appear BRK.b stock isn't exactly cheap right now. In fact, a fair valuation model (DCF) suggests it could be valued at this price by year end 2020 based on long term earnings growth estimates of 7%.
Looking at earnings estimates for 2019 gives projections for 10.40 EPS. A long term average market multiple of 17x suggests $177 valuation. The 2020 EPS estimate of 11.6 at a market mulitiple of 17x would imply a valuation around 200 by year end 2020.
With no dividend yield investors are not 'getting paid to wait'. Holding this stock is all about making capital gains. Meanwhile the downside volatility doesn't do the long investor any favors.
I'm sure the theory is Berkshire can reinvest earnings better for long term growth rather than returning earnings to shareholders in div yields. But this week Buffett admits he's sitting on billions in idle cash because market valuation has been too high to justify making any new large acquisitions.
What do you think? At 19x forward earnings is BRK.b a good investment right now to buy and hold for the next few years?
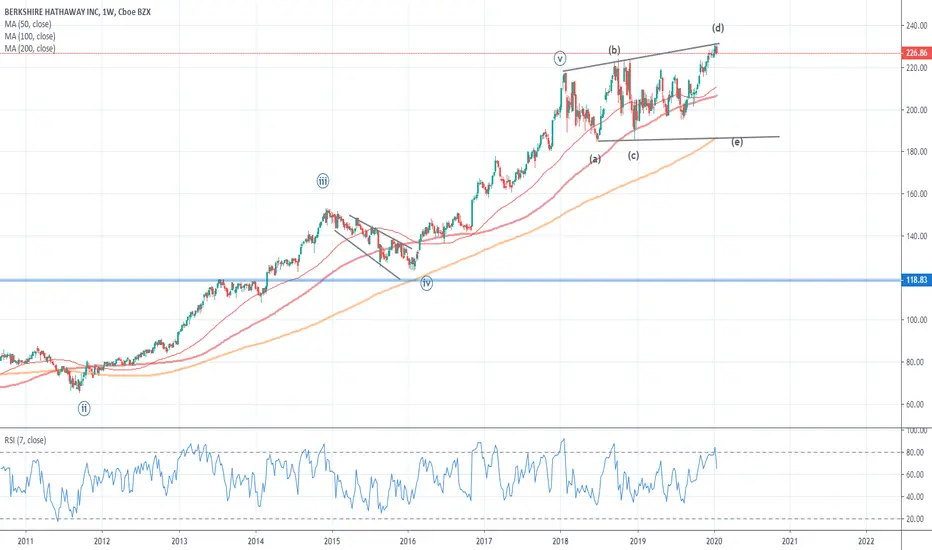
Shorting BuffetI am correcting my previous chart because abcde can only be a triangle (here it is expanding).
BRK long IdeaDear investor,
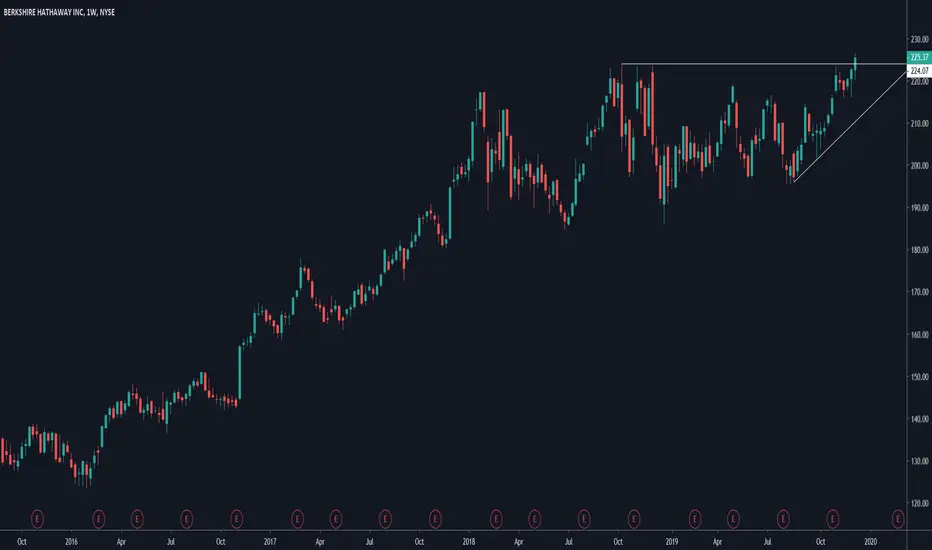
BRK.A seems that broke out the previous resistance zone on the weekly chart after a period of accumulation and possibly will repeat at least the previous high leg.
Please, support this idea with your comment or with you like. Your feedback is really important for us.
Best regards, Sandro and Gustavo.

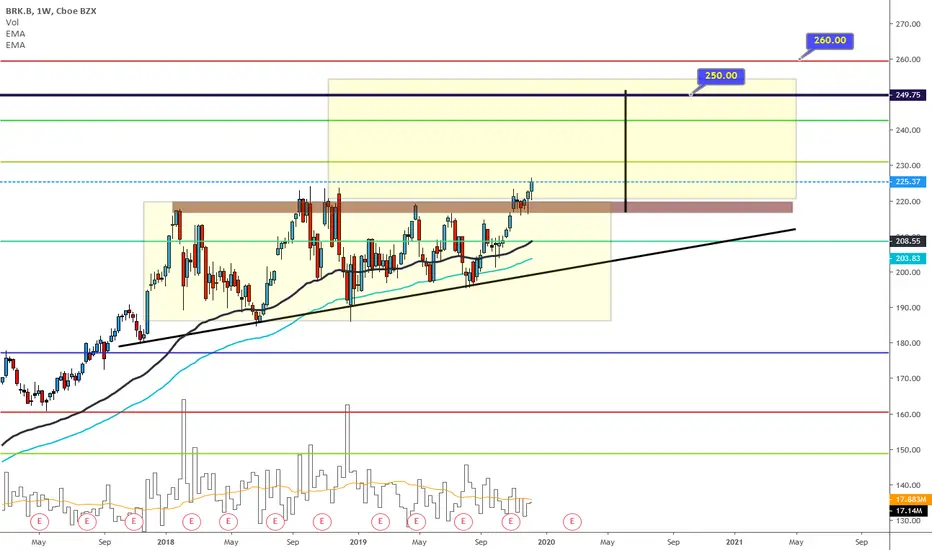
Buy Berkshire shares as best way to play a catchup in valueUS equities are at all time highs, but this is largely driven by bluechip tech stocks ( AAPL , MSFT , GOOG etc...), which indicates investors are still cautious going for the safe bets or passive index investing. Further improvement in sentiment should support value shares.
Berkshire shares is probably the best single way to play it. The stock broke out after range trading over teh past 2 years. Relative strength vs the SPX shows sign of bottoming. A move back below 210 invalidates the bull case.
uncle warren <3warren buffet is just smarter than us. why not join him for the ride?
if it gets 233 its at 240
apple
amzn
oxy
some companies that are showing incredible strength where uncle warren has serious positions.
also $xtn (spdr transportation etf) showing some moxy as well
in which uncle warren has a great stake in transpo stocks.
BRK.B Finally Breaking OutThis stock has been going sideways for the last two years, and Berkshire is finally joining the SPY breakout with its recent price action. I'm looking at calls dated spring 2020 to hold until New Years.
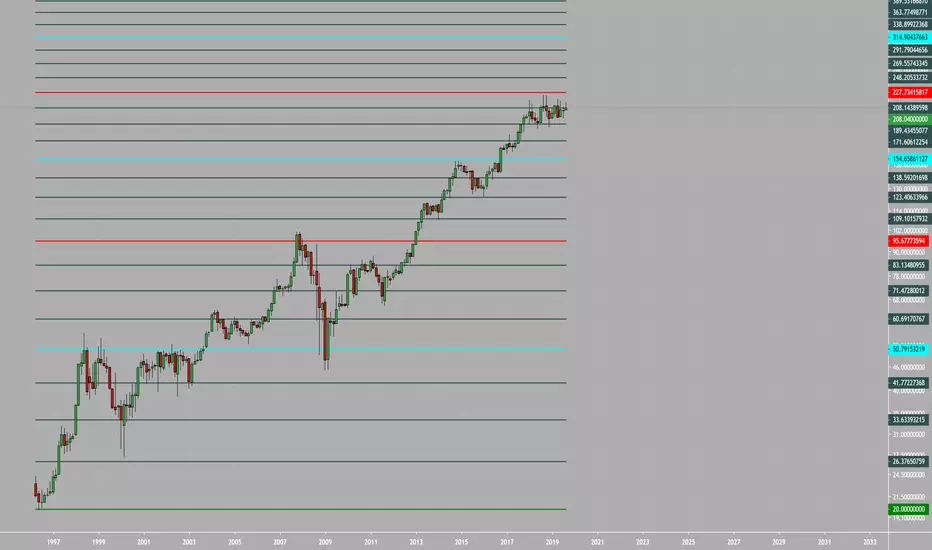
BRK.B Gann ProjectionsUse the low of 20; use the high of 55.9; project out from there and these critical levels present themselves
acknowledge the strength of these gann levels
manage your own risk
gl hf
xoxo
snoop