Caterpillar Breaks Long-Term DowntrendIndustrial stocks remain underperformers thanks to the coronavirus recession. However, a few companies struggling before the crisis have started breaking out.
One of them was Deere . The animal spirits have also been at work in Caterpillar.
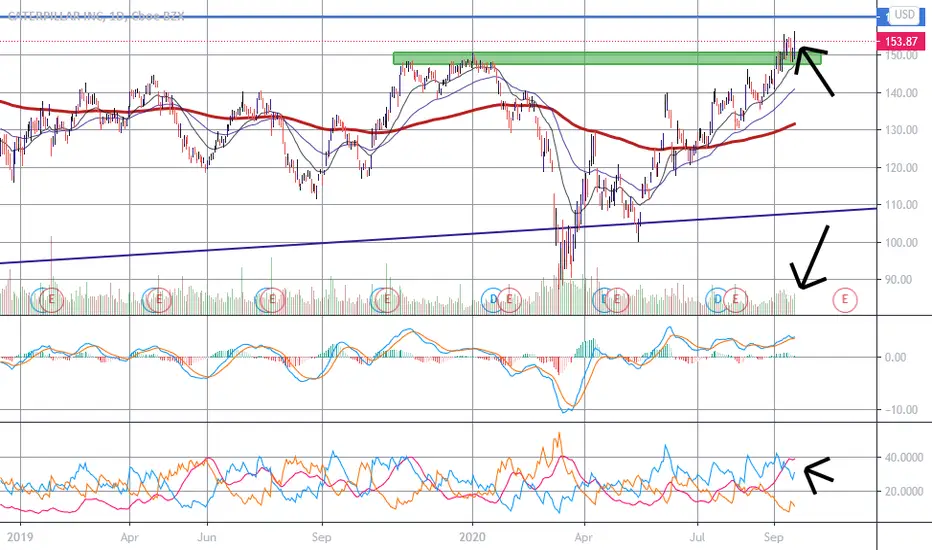
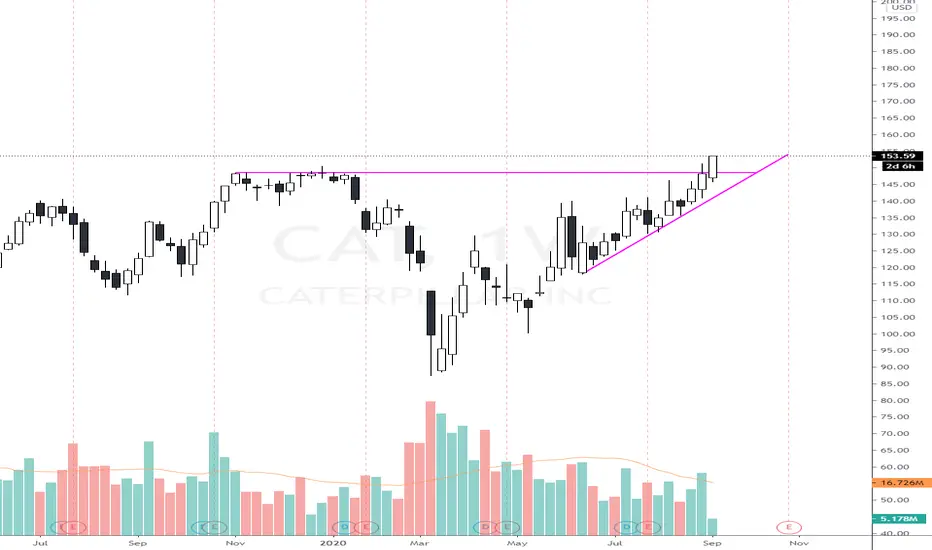
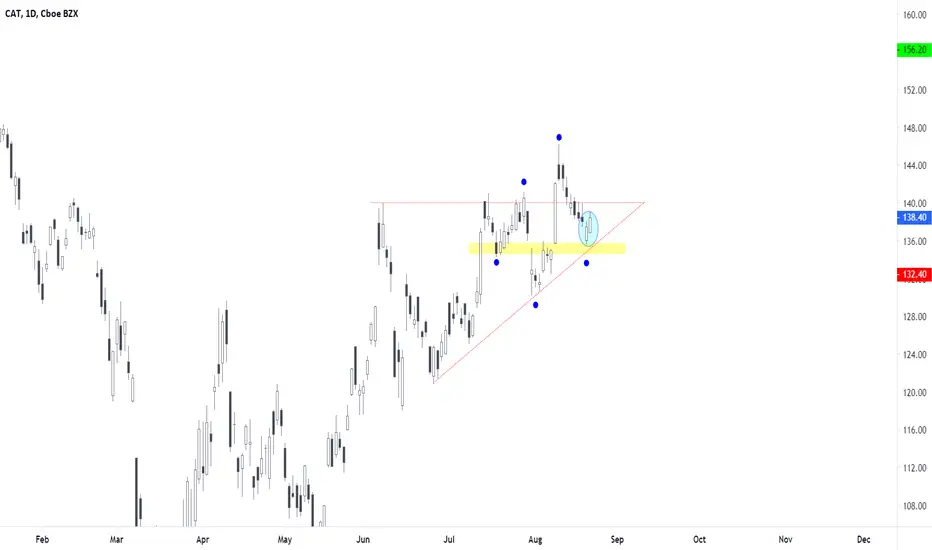
The first chart feature for CAT is a weekly downtrend in place since early 2018. This ran along the pre-covid high and into the August consolidation area of $135-140.
Next, the equipment maker’s recent low of $142.73 was just half a percent above its 50-day simple moving average (SMA). Speaking of the 50-day SMA, it rose above the 200-day SMA in early August – a “golden cross.”
Finally, CAT’s advanced despite poor monthly sales reports and warnings about the weak economy. But recent economic data, especially from China, have fueled some optimism.
Given the fact that stocks have started the week by jumping higher (“market order Monday?”), some traders may want to see CAT retest closer to $140. However, the daily and weekly charts could be signaling a longer-term breakout.
TradeStation is a pioneer in the trading industry, providing access to stocks, options, futures and cryptocurrencies. See our Overview for more.
CAT trade ideas

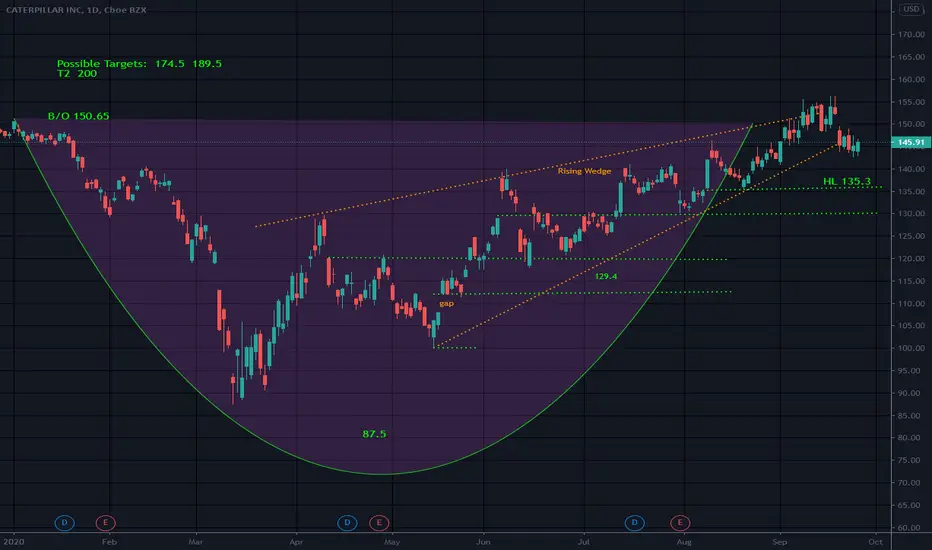
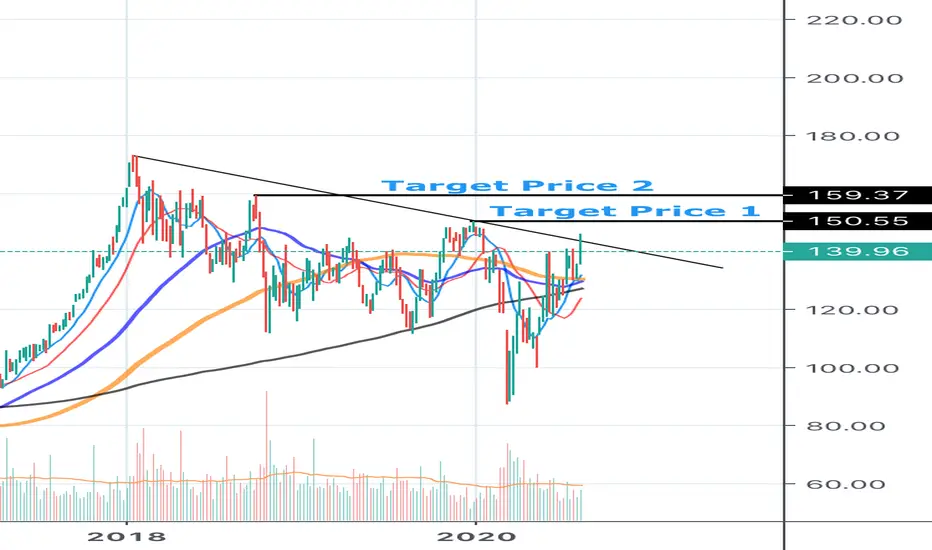
Cup and Handle Rising wedgeCAT is falling from a bearish rising wedge which possibly interfered with C&H targets
Now under long entry level of 150.65
Handle Low is 135.3 and can be a source of support
Monthly candle indicates this one will pull back a bit more.
Not a recommendation
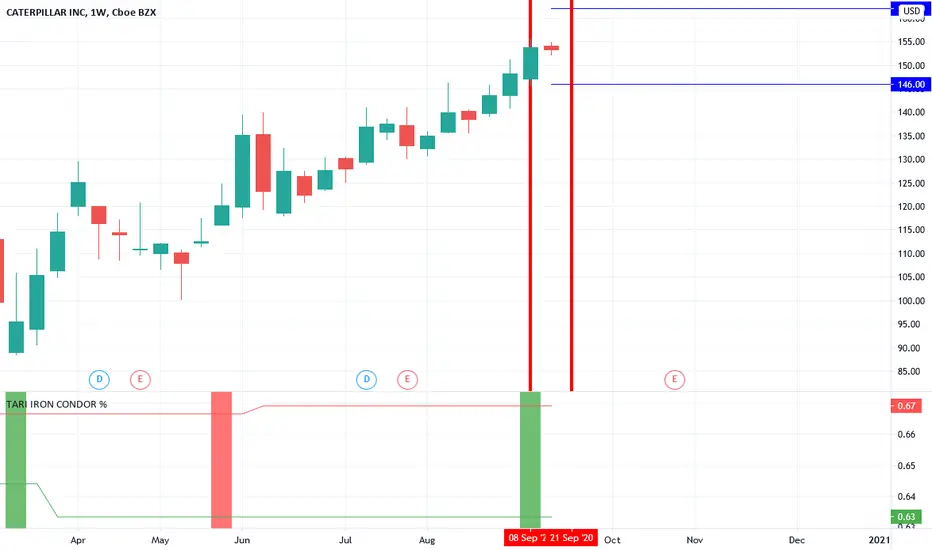
Iron TariHi guys,
this is another iron condor from the strategy W1 5% strike.
Probability 63% gives a Rew/Risk = 100-63/63=0.58
Today the market does'nt pay enough, RR is 0.60, not that much we'd like to trade, but we can leave a pending order to get something more.
In this case I prefer to widen the spreads of the 2 vertical, always having a RR not lower than 0.58. This is because the wider the spreads are, the higher our prability of success are. In this case the breakeven moves a bit giving us an higher range to be protibable, plus the max loss moves on each side of 4$. 8$ more for the iron condor is a good extra room for the price.
So in this case we enlarge our probability of success, without touching the RR ratio.
Enjoy your Wallet!
Tari.
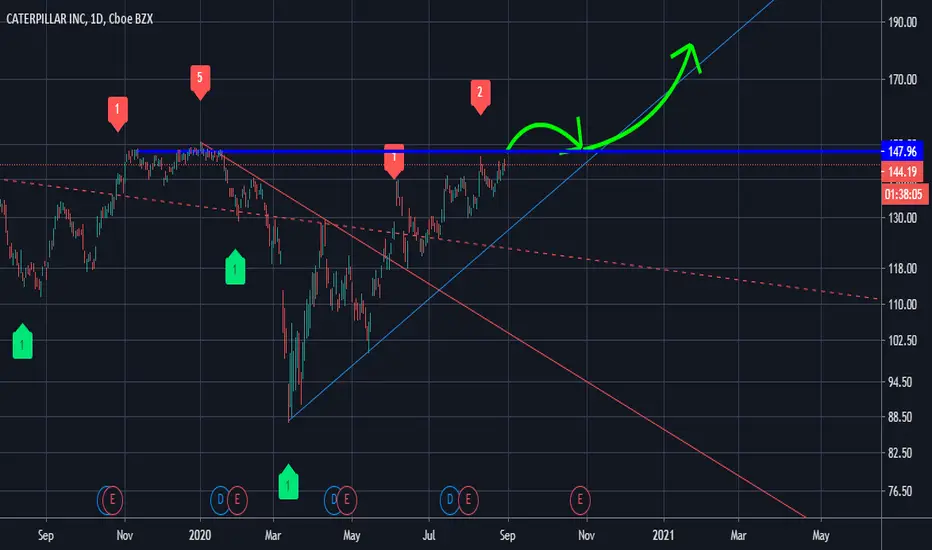
CAT-LongCAT is breaking out of a long term pattern. Breakout is with a strong volume. Some money surely preparing for a worldwide recovery from covid-19. Recently lots of analyst recommended the stock based on its fundamentals. price to sales ratio is very attractive. Dividend paying stock projected to have 39% higher EPS next year. So boys from Wall street are now adding. This is just an opinion. Do not buy or sell any financial assets reading this post. This is just for educational purposes. Do your own homework before putting your hard earned money based anyone's post.
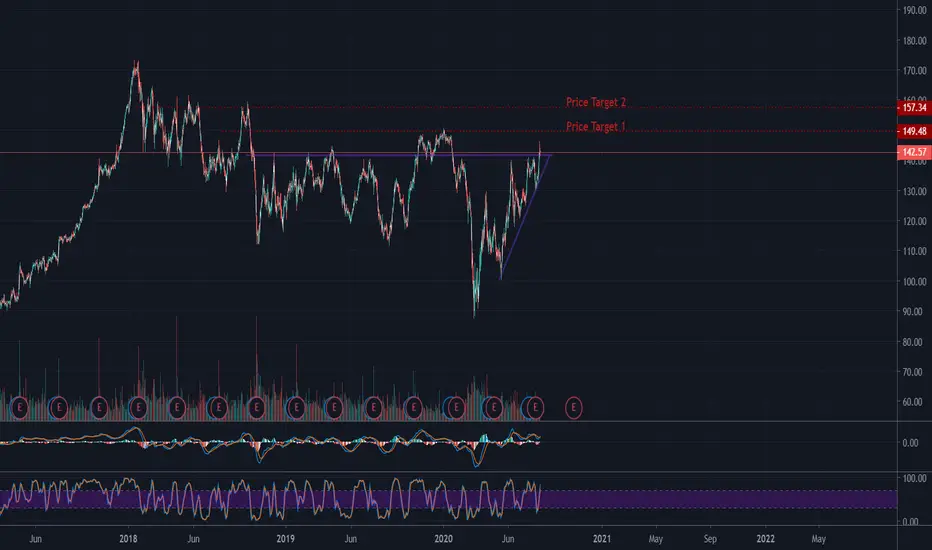
CAT : Bullish FlagBullish Flag
TP 1 = 145.59
TP 2 = 149.91
Please don't forget to FOLLOW , LIKE and COMMENT ...
If you like my analysis:)
Thank you and Good Luck!

Cup and HandleFell under b/o for now HL= handle low
Do not like the narrowing channel?? Or is it a rising wedge? Dunno Long with a stop.not gonna say where/depends on how long you want to hang etc
Strong S at 140ish and 136ish
Short interest is low
It broke out and hit 151.2 but did not hold on. Market has been tough though.
Old high of 173.24 where R may occur.
Feels like a pull back is coming..but who knows? LOL
Not a recommendation

a breakout is imminent its trading around the resistance line, can expect a breakout soon. will get Oct calls
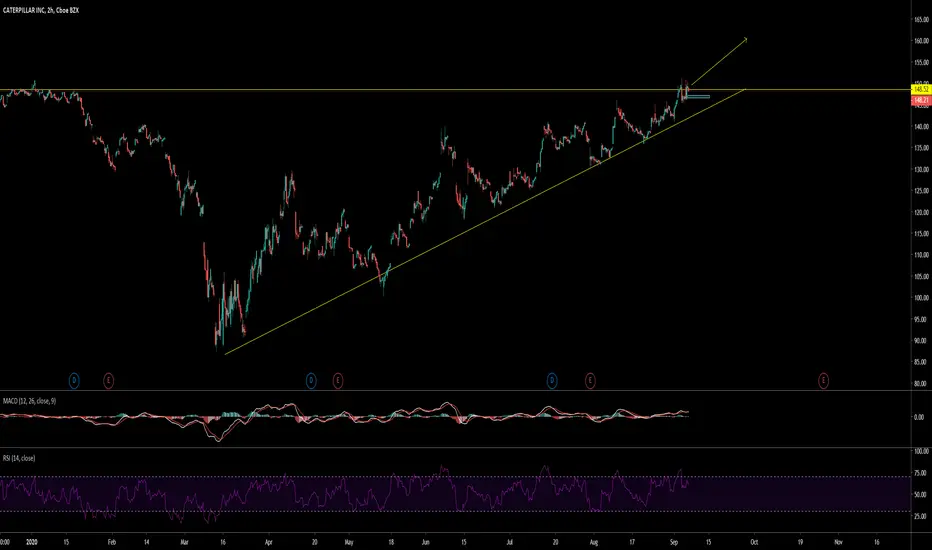
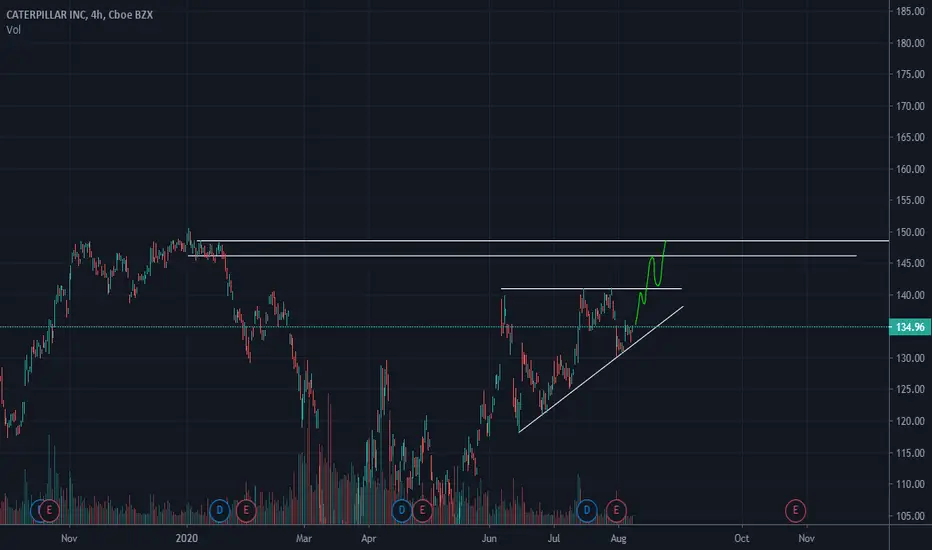
CAT ON VERGE OF BREAKOUTNYSE:CAT
CAT has formed a very apparent ascending triangle and is on the verge of breaking out to ATH's. First target is 148.50.


CAT maybe next week a buy?Hey everyone,
CAT could repeat it's pattern, don't you think?
Entry: 136$
Stop: 134$
Goal: 149$
Good luck and much fun with that trade!
Leave a follow please, my goal is 200 :)

$CATTicker $CAT broke above recent highs and came and back tested a support level that dates back years. i really like this chart it may consolidate for a bit.
leave a like if you find my plays useful
$CAT #Breakout - Watch Weekly #ResistanceIf you bought CAT's ascending triangle breakout yesterday, watch out for the weekly trendline resistance that is most likely going to get tested today ;). Its the reason I skipped this trade.


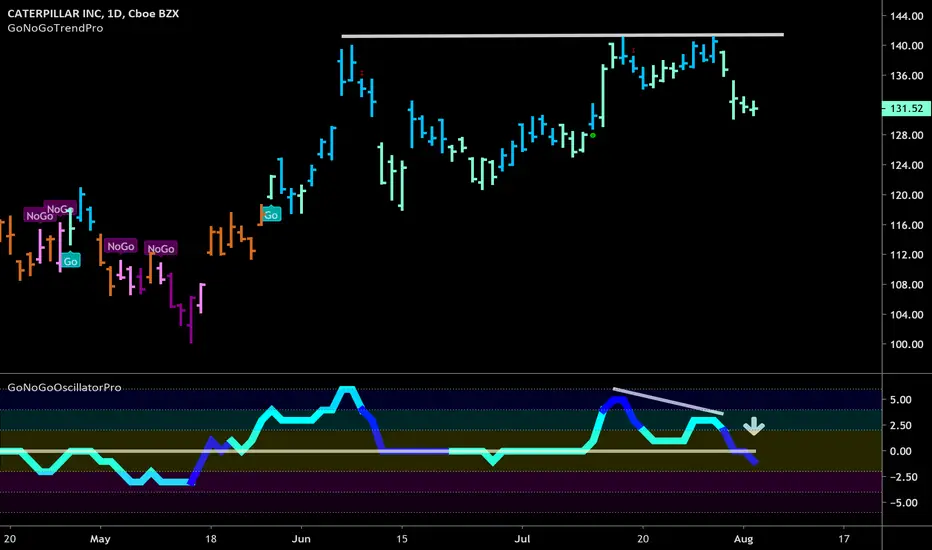
Troubled waters ahead for Caterpillar?The GoNoGo Chart of Caterpillar Inc, is an interesting one. The trend is a “Go”, but is experiencing some signs of weakness.
Having failed at resistance around $140, the GoNoGo Trend is painting the paler bars of a slightly less *bullish environment.
In the GoNoGo Oscillator panel, we see that there has been *bearish divergence and that now the oscillator is breaking below zero accompanied by heavy volume.
We’ll be keeping an eye on CAT to see if it can maintain its “Go” trend.
What are the GoNoGo Indicators?
The GoNoGo Trend indicator blends traditional trend concepts to color price action according to the strength of its trend. The colors range from *bright blue (strongly *bullish) to dark *purple (strongly *bearish)
The GoNoGo Oscillator blends traditional *momentum concepts to demonstrate the velocity of price action. The oscillator ranges from -6 (extremely *oversold) to +6 (extremely *overbought)
CATSupport: 130.89
Resistance: 141.31
RSI dips below 30 and sits at 23 = A stronger signal
MACD signal flips but too price action is within 1.5 SD

CAT may be a buy at these levels. CAT's 10-day SMA greater than 50-day, 50-day SMA greater than 100-day. Bollinger Bands are showing that the stock is relatively cheap at these levels (~$131). A potential exit could be around $140.
