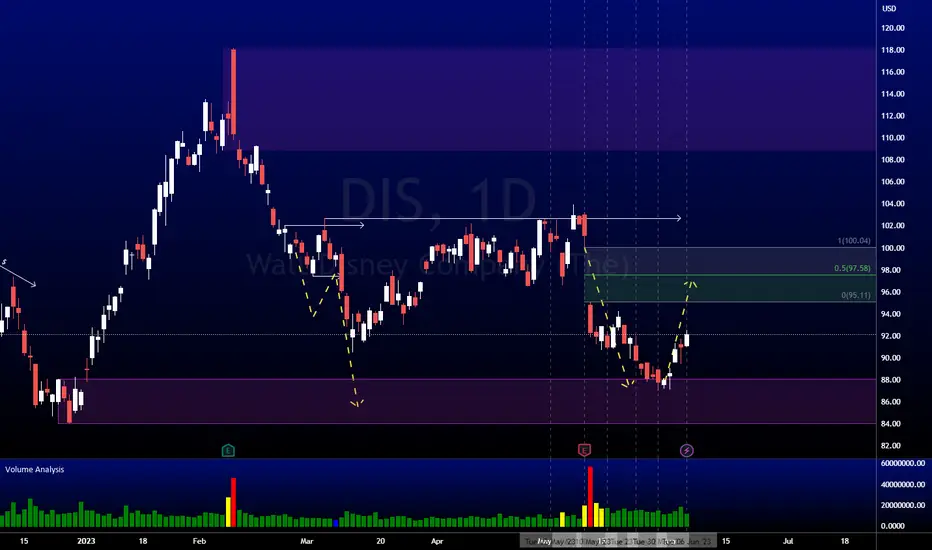
DIS AnalysisPrice consolidated since my last analysis. No changes to my expectations, price is still well within the current bullish POI, I'm expecting price to rally from here, potentially targeting the fair value gap at 97.58.
DIS trade ideas

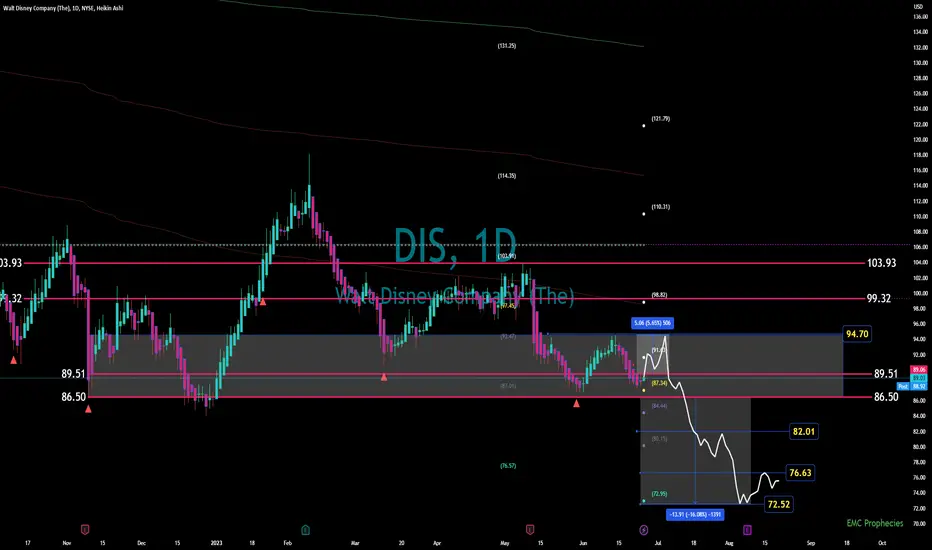
DISWatching this accumulation zone if we fail to break the 96-98 region Im watching the break below 84 for potential drop correction out of this accumulation down to the 72 drop range
Just a theory not financial advice. If this trends up do look at 98-103
$DIS with a bearish outlook following its earnings #StocksThe PEAD projected a bearish outlook for NYSE:DIS after a negative under reaction following its earnings release placing the stock in drift D .

I might want to own DisneyI might want to own Disney as my first stock. Now this is why!
Are you aware that Netflix stopped allowing users of different IPs to log in and watch the show, even when you had a premium subscription?
That means, even if you are from the same household, but one of you has an extended overseas trip, he could be booted out after he has "used up" the overseas button.
In some countries, the subscription fee of Disney is 3 times cheaper than Netflix. I'm unsure if that's what Disney offers for the first-time sign-up client, but it is worth noticing.
Disney owns some of the biggest brands, such as Marvel, Starwars, 20th Fox Century Studio, and more.
Although I'm not optimistic about some of the new Marvel series, there is so much more potential with Disney.
So when the Bullish Shark Pattern has confirmed at $87.90, it is great news for me to own my first stock and it might be Disney.
What's your take on this?

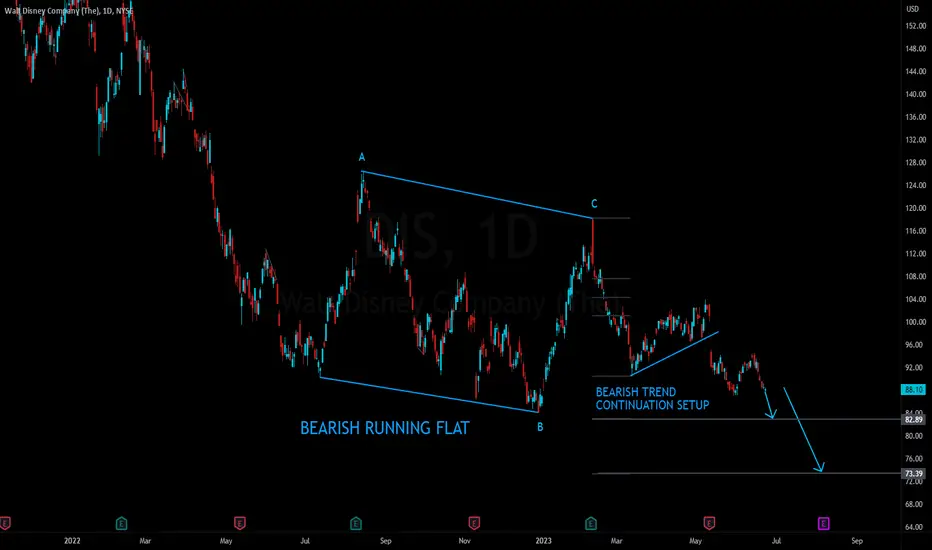
🐭 BEARISH CONTINUATION DISNEY 📉It appears Disney has created a bearish running flat on the Weekly time frame.
It has also then proceeded to create a bearish flag on the Daily time frame.
This indicates that the trend will continue to the down side.
The bearish running flat is a three-wave corrective pattern within a downtrend. It consists of:
Wave A: Sharp downward impulse.
Wave B: Upward correction, falling short of the previous high.
Wave C: Strong downward impulse, confirming the downtrend's continuation.
It is great to find larger time frame setups that indicate the direction of the trend then taking trend continuation setups on the lower time frame in that direction!
This adds greater probability when taking trend continuation setups.
As the greats always say "The trend is your friend!"
Also to add to the probability, the bearish daily flag has a healthy correction into the 50% retracement zone of the impulse then reversed. Indicating that it is more than likely a progressive impulse rather than a corrective one.
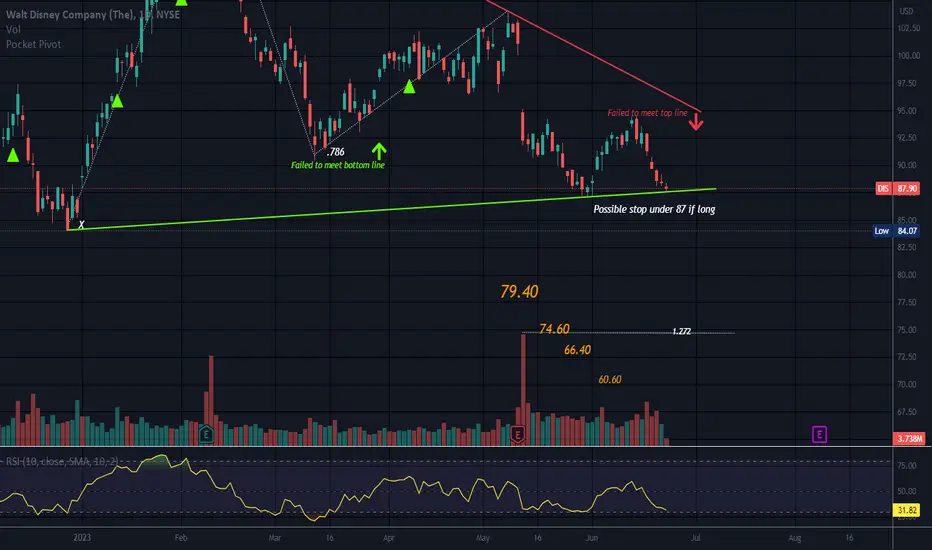
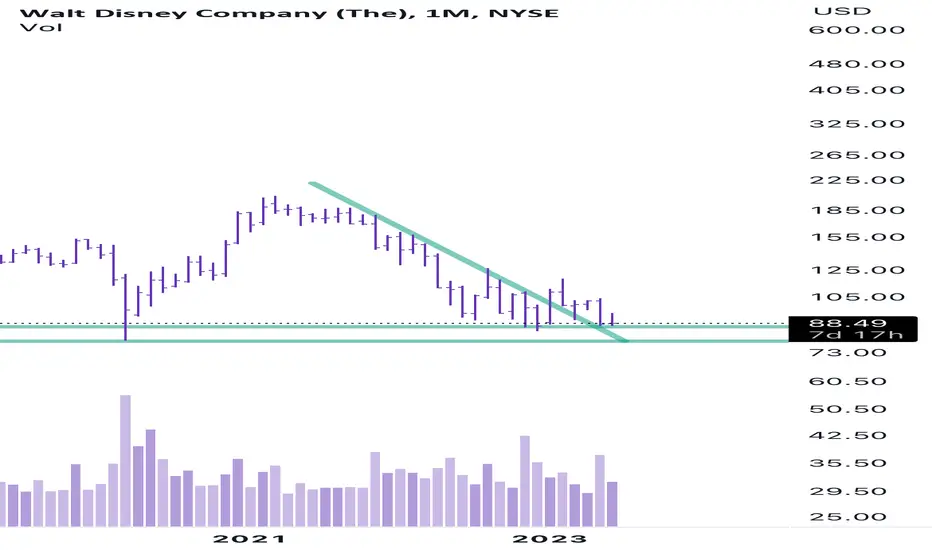
Symmetrical TrianglePrice is at the support line of a large triangle.
The last leg failed to meet the top line which can be a negative indicator if one relies more on price action than indicators.
All triangles are neutral until broken with a trend in that direction. Some would say 2 closes below the line. But the market can do somersaults and make you feel like you need to go back to the drawing board )o:
Spinning top/Doji representing indecision at a support level. Time will tell.
This market as of late makes me question myself on a regular basis but all we can do is make an educated guess,
No recommendation. Possible M pattern with the 2nd leg reaching the .786 of the 1st leg up.
Buying opportunity of the decade- 10 year lows
- $80 billion revenue , $160 billion market cap
- you’re supposed to buy low, not sell low
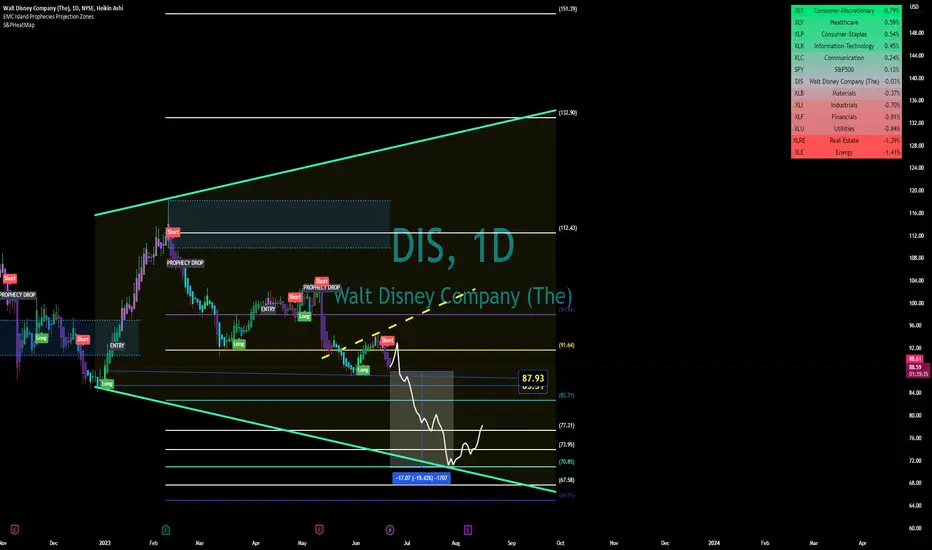
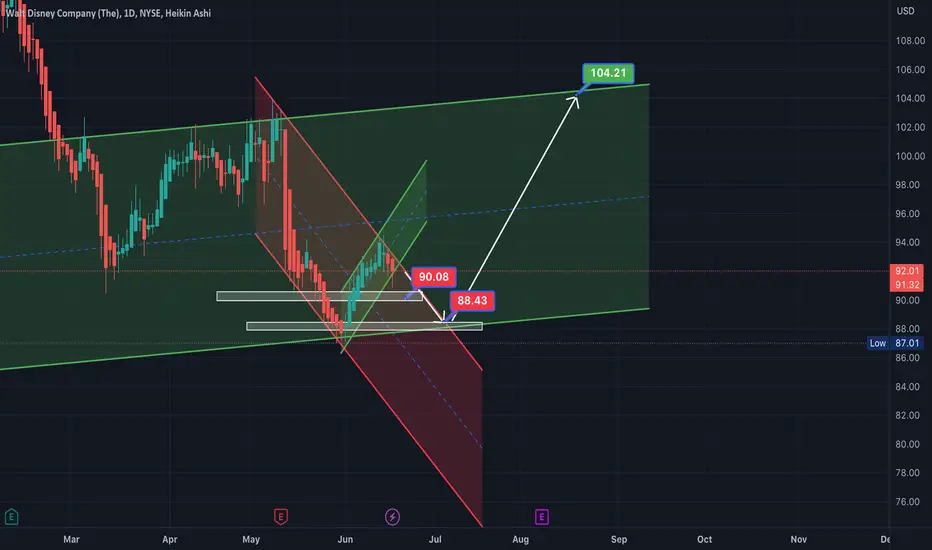
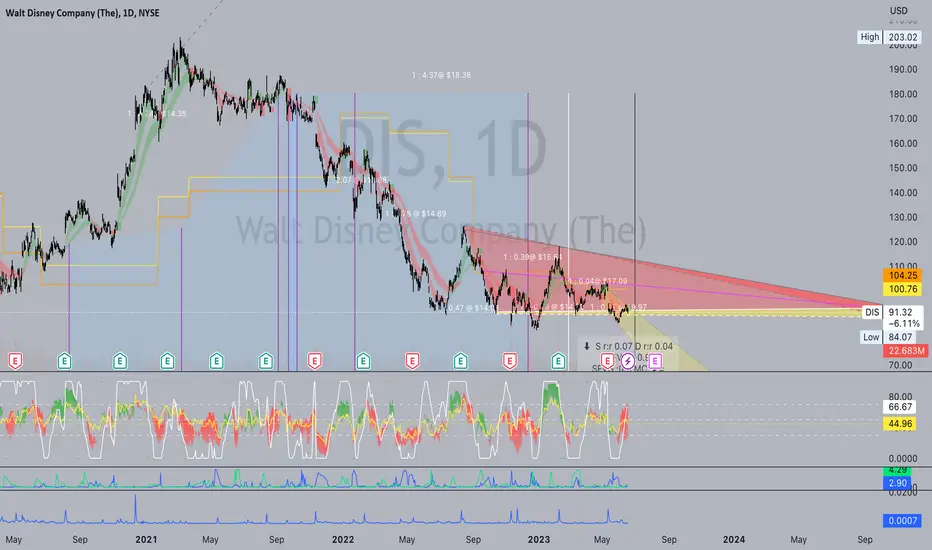
DIS FunnelI set a funnel for DIsney and layered it w Fib LEvels for ranges of focus in the trade. Watching this next pop lower high range from 91-97. I we reject will watch it clear 85-88 for a drop potential down 67-77 range on the drop. THere is hidden reversals at 77 and 82 for bounce to watch for on this down trend. But im watching this Head and Shoulders Inverse Cup Drop pattern to retest the base line of this funnel support. Just a thought theory not financial advice.
Dont forget to Boost and COmment and vibe.
#1LoV3
Disney divergence on weeklyWeekly Stochastic looks like solid divergence, I like this overall support as well.
Now is completeHere it is a beautiful bullish flag, we will see bullish activity around this level, will be very interesting if fill the huge gap soon.
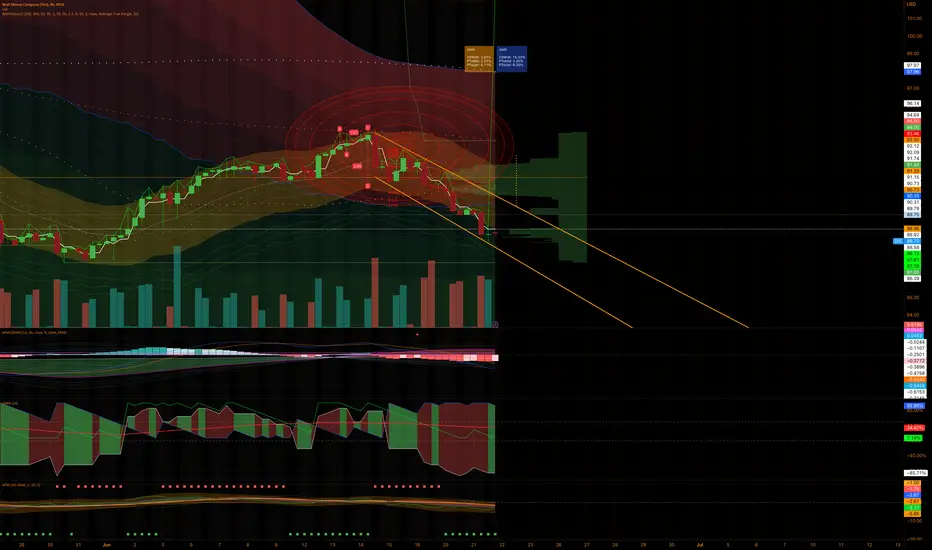
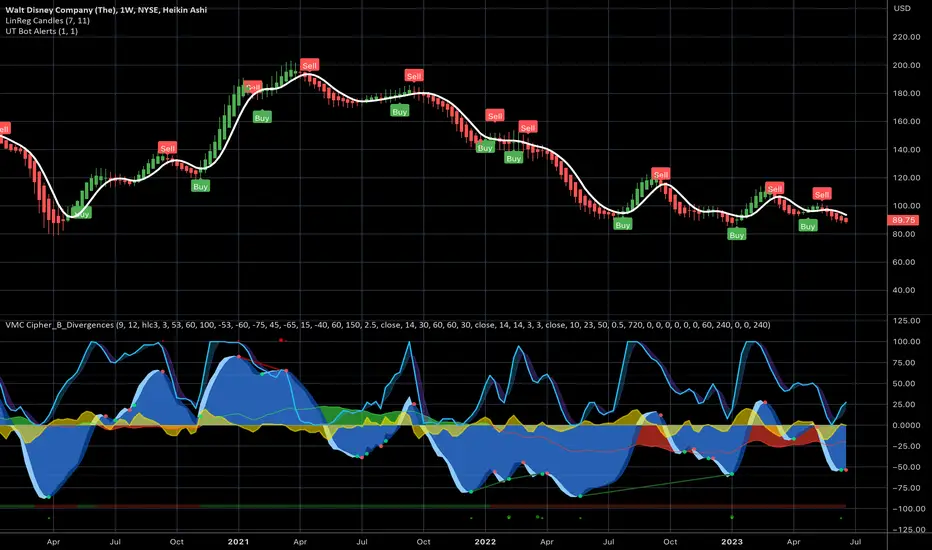
Black Swan God Mode Buy/Sell signalsGod mode chart layout for stocks or crypto. Combines many buy/sell momentum signals into one very clean chart layout
DIS AnalysisPrice did not play out as analyzed last week. I was expecting price to continue higher into the fair value gap at 97.58, but price is currently making a bearish retracement back into the bullish POI at 89.56. From here, we would want to see a confirmation on the lower timeframe for price to continue higher.

Waiting For Call OPtion on DisneyWalt Disney
Disney Broke After Market and Pre Market lows of 90.85
Also it broken the level 90.60, to the down side
Power Candle after drop
Channel on 1 and 5minute
Indicator ROC, ADL RSI
Brake of the 1 and 5 Minute Trend Line
Reversal Candle

bull flag?Ok, that movie doesn't works good for Disney, but does means nothing because technically we have a bull flag, so we should see some bull activity here. channel width 4%.
Walt Disney Call Option TradeGood morning to everyone.Im here to learn by receiving and sharing whats posted and sharing what i see in the market. This is a trade im currently watching on Disney. im waiting for a brake around 90.60. My levels and interest to purchase are at 1st 87.48 - 87.00 2nd 84.36 - 84.07 These two levels i see as nice bounces for a Call Option and my last level of intrest is 81.19 - 79.08 this level i would be intrested in purchasing shares and Call Option with a nice experation date. Each trade will need the confirmation of support follwed by a power candle before entry. I also charted down from the Daily to the 15 Minute time frame. please share perspectives.

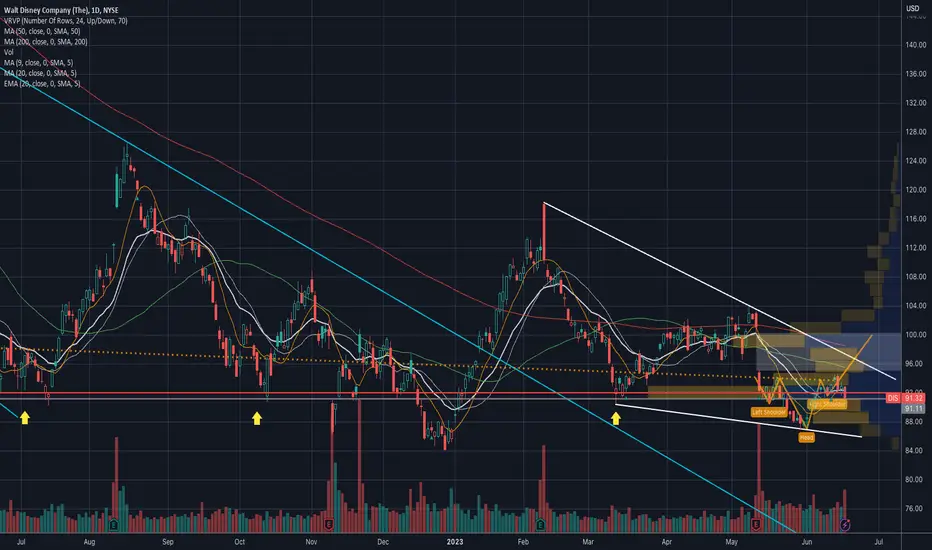
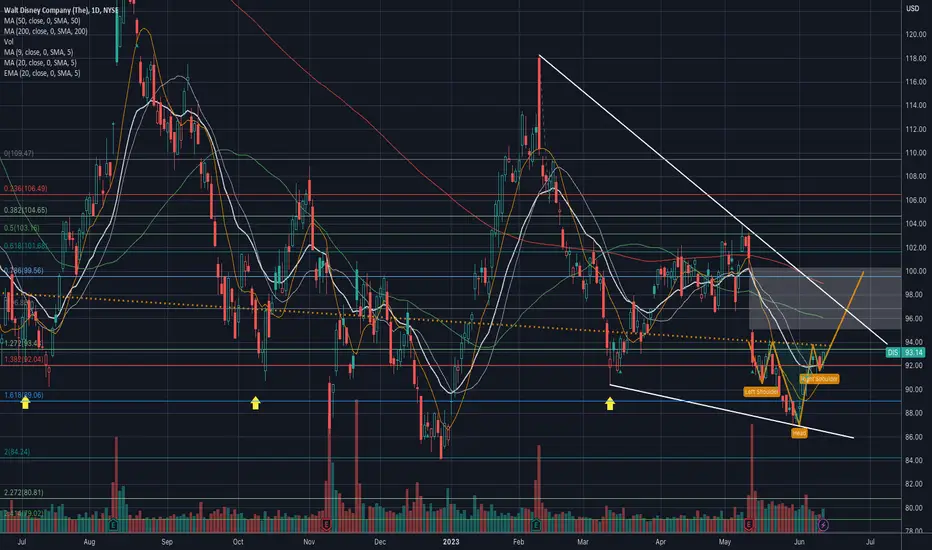
$DIS - Whats next?NYSE:DIS - Friday CFO departure news came at a time when the stock was trying to break out of the resistance neckline. But IHS still intact. Its still above long term support. Current area is volume profile's point of control area (peak) so its having a hard time moving away from here. Breaking above $95 would be 🚀. Next week is important. 👀💥🚀
Targets - $96.86, $100, $106. Downside risk $89-$85.
$DISDIS is in a consolidation formation. and shows a strong support at 92 area. I expect it to break out of this consolidation by Nov 2024.
DIS AnalysisPrice playing out as analyzed last week, giving us a 2.47% move to the upside. No changes to my expectations, I'm still expecting price to continue higher to fill the fair value gap at 97.58 as the potential target.

$DIS - Things look promisingLooking like its forming mini IHS inside a descending wedge. Looks like its aiming for that gap close at $100. Targets - $96.86, $100, $106. Downside risk $89. 💥🚀💰
DIS - Let's Ride - 2.0DIS has responded as suggested since the last post that identified the gap and go along with the bottoming candle formations made to date. Now it appears DIS will take a small breather, and potentially fill in the gap before heading much higher. 93.54 is the upside target before retracing, but there are enough Elliott Wave counts for a motive wave off the lows so this higher high is not needed to remain bullish. Area of interest is highlighted lower. For regular updates try the affiliate link in the bio. GLTA!

DIS AnalysisPrice played nicely as analyzed last week giving us a +5.34% move to the upside. I'm expecting price to continue higher and fill at least 50% of the fair value gap at 97.58. No changes to my original expectations.
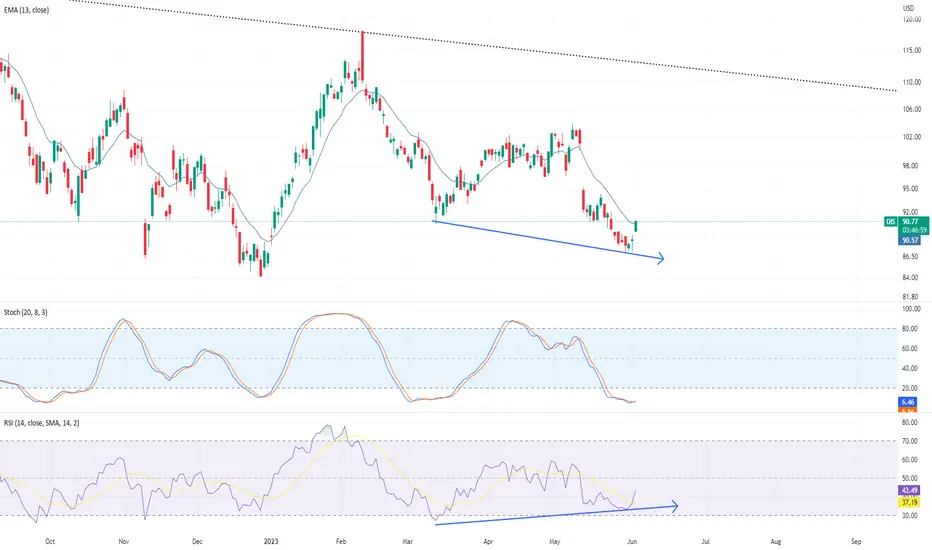
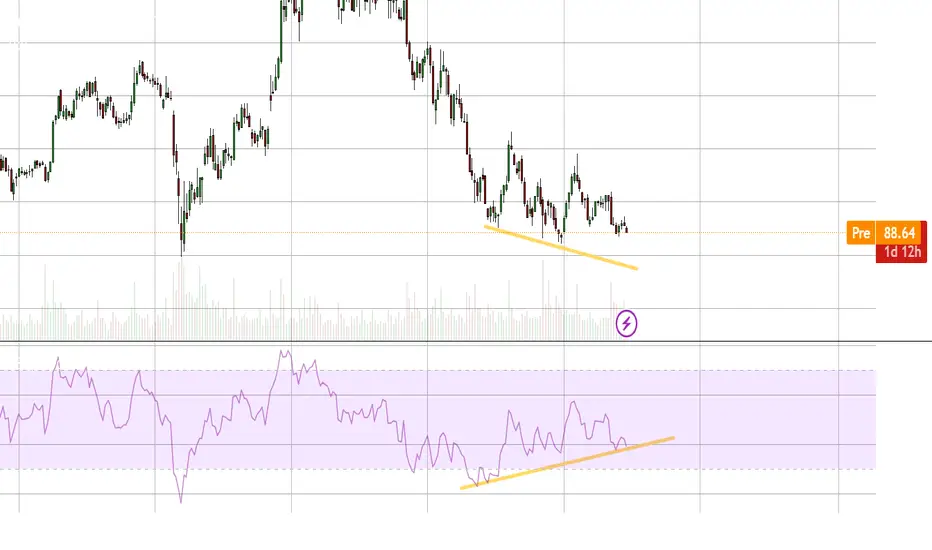
DISNEY - what is bullish divergencetop example of bullish divergencce in DISNEY daily chart. keeps above the EMA and I d expect it to gain momentum...