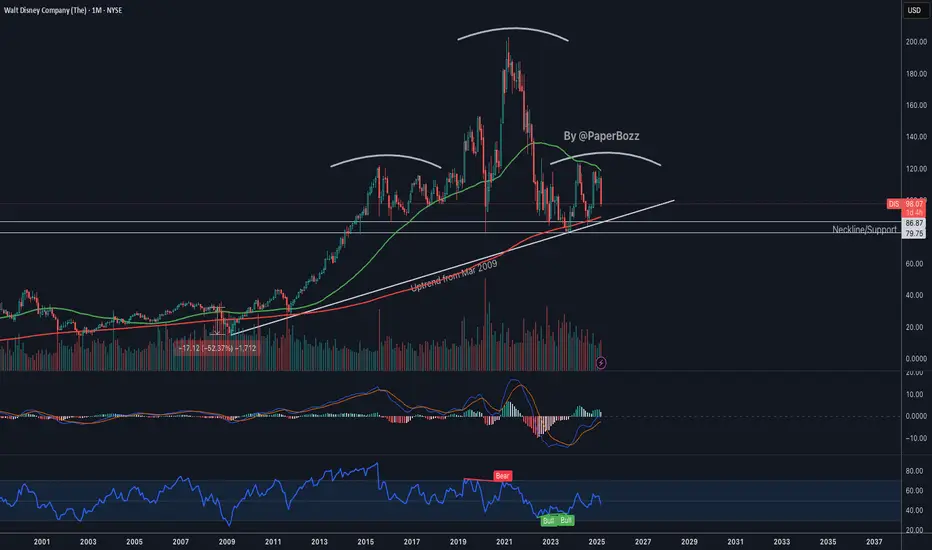
$DIS - Only for the brave soulsNYSE:DIS Potential head-and-shoulders formation.
$86 to $79 area has not broken since $2015.
Anyone who wants to play the bounce must set a tight stop.👀
DIS trade ideas
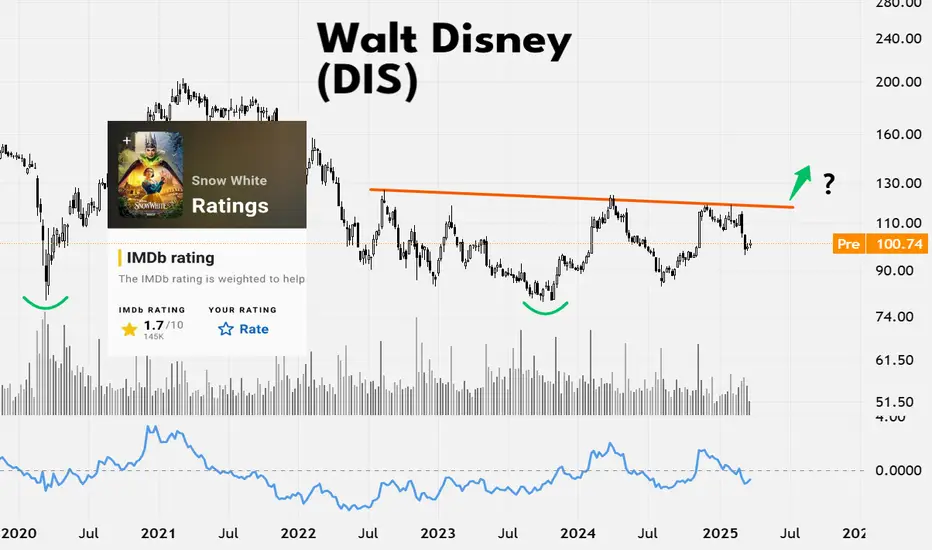
Snow White's very low ratings - Bullish Disney stock ?The SnowWhite IMDB rating can't get any worse - could the same be said of Disney stock?
Price is the ultimate proof but buying the shares of a well established company when sentiment is at a low point can be a fruitful endevour.
The poor box office showing + very weak ratings for Snow White - maybe a contrarian buy signal ?
A) The stock is attempting a long term double bottom via is 2020 + 2023 lows
B) A breakout over the downtrend line (orange) could confirm a bullish trend change
Bottom of the ratings ➡️ Bottom in the stock? NYSE:DIS
$DIS keeping it simple, fake pump to $102 ishSimple chart. Seeing some NYSE:DIS flow coming in to the upside short term. Chart looks ok. Giving $100c 4/17 a try. Fill at $3.25.
WSL
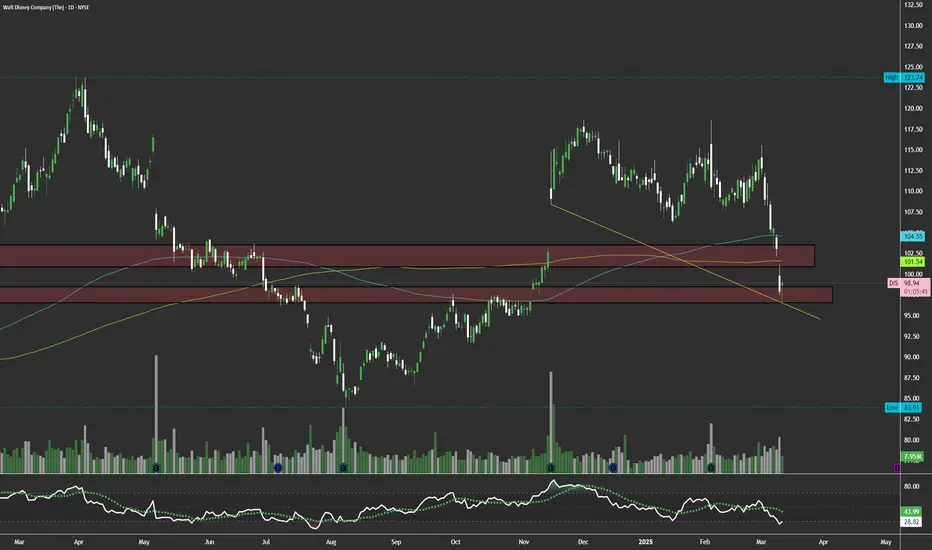
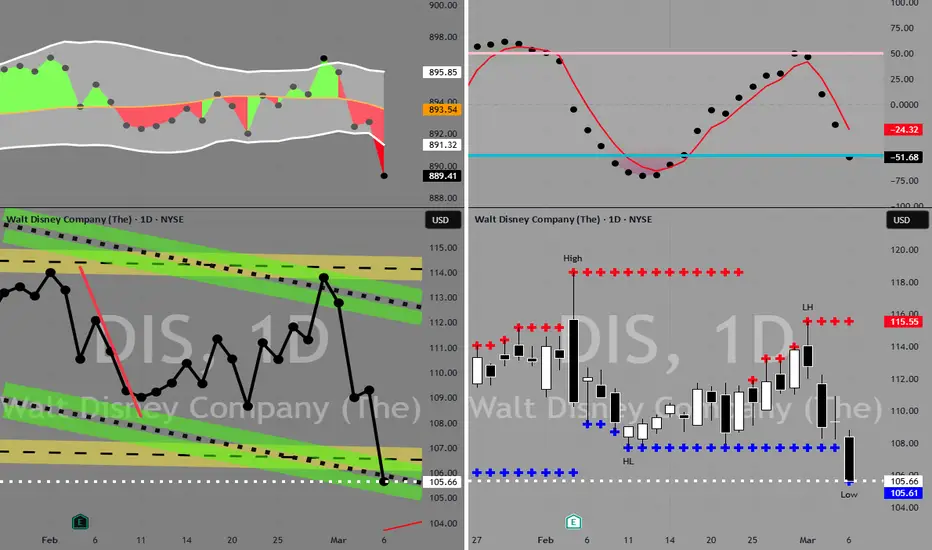
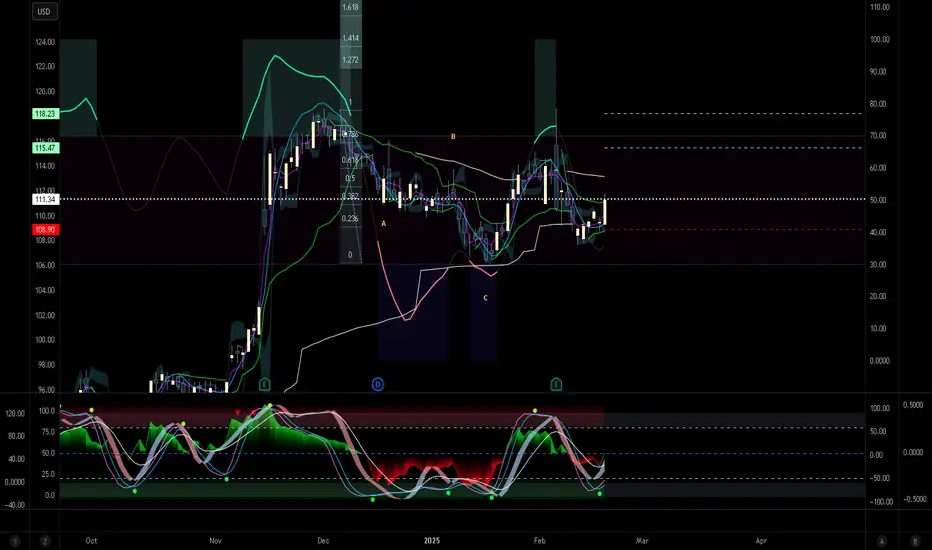
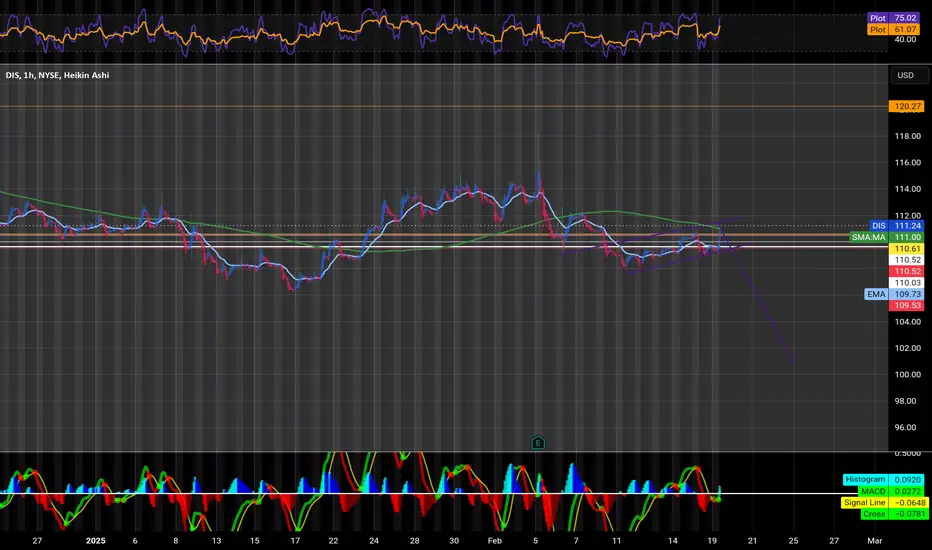
DIS in Buy ZoneMy trading plan is very simple.
I buy or sell when at three of these events happen:
* Price tags the top or bottom of parallel channel zones
* Money flow spikes beyond it's Bollinger Bands
* Stochastic Momentum Index (SMI) at near oversold overbought level
* Price at Fibonacci levels
So...
Here's why I'm picking this symbol to do the thing.
Price in buying zone at bottom of channels
Stochastic Momentum Index (SMI) at oversold level
Money flow momentum is spiked negative and under bottom of Bollinger Band
Entry at $105.63
Target is upper channel around $112.50
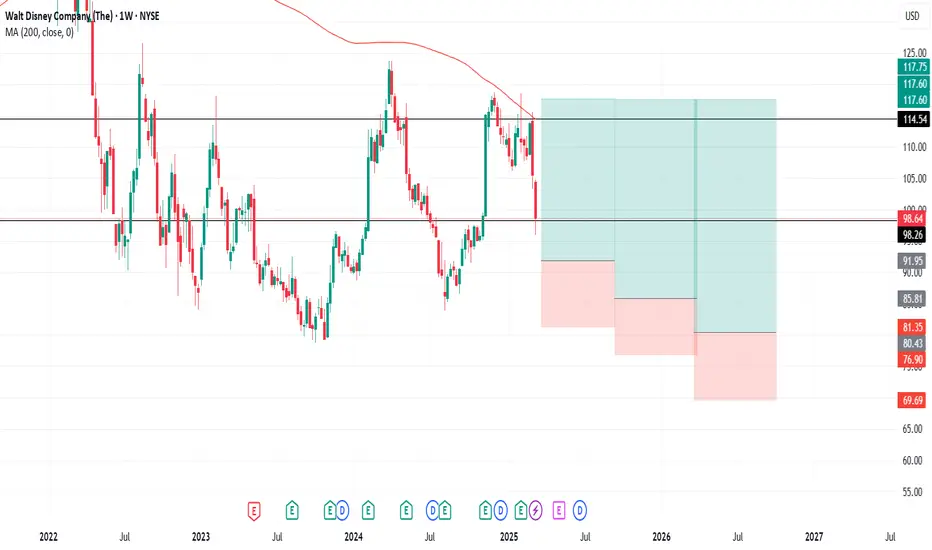
Looking for the $90 level on DIS?🚀 Looking for the $90 level on DIS? 🎯
Disney (DIS) could be gearing up for a solid move! If you're looking for an entry, key levels to watch are $90, $85, and $80—potential opportunities for those waiting for a dip. 📉💡
On the upside, targets are set at $100, $105, and even $120, offering an exciting profit potential if momentum kicks in! 📈💰
With market conditions always changing, keeping a close watch on price action and overall trends is key. Will DIS find support and bounce back? Stay sharp and trade smart! 🔥✨
📌 Disclaimer: This is not financial advice. Always do your own research and consider consulting with a financial professional before making investment decisions. 🚨
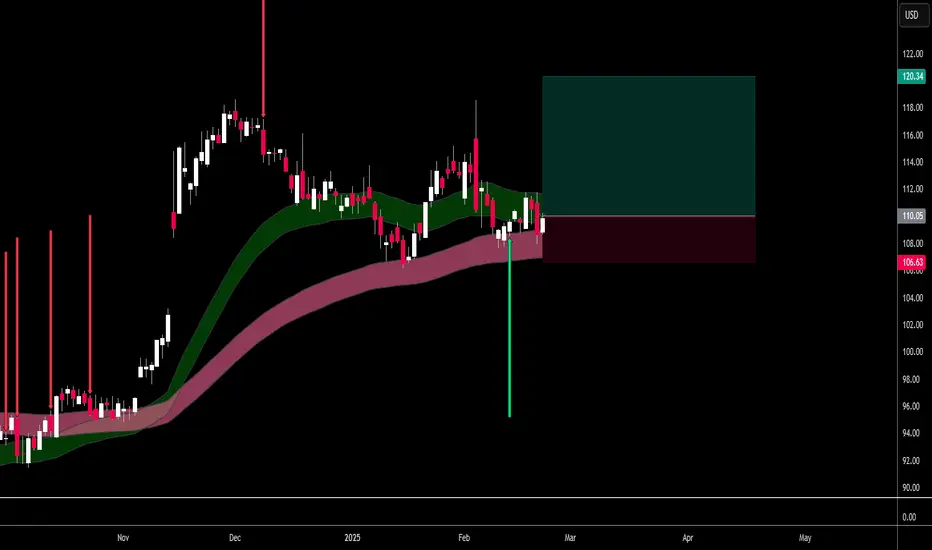
DIS entering the buy zonehi traders
DIS stock faced a big price decrease, but the price is about to enter the buy zone where we expect investors to step in.
Normal correction in a long-term uptrend that has been started in November 2023.
The price may drop even to 85$ , make a new higher low, and still be bullish long-term.
For the time being, the upsloping support is still intact.
RSI oversold but has not created the bullish divergences yet so I expect the price to go a little bit lower before pushing higher.
See the chart for the reference.
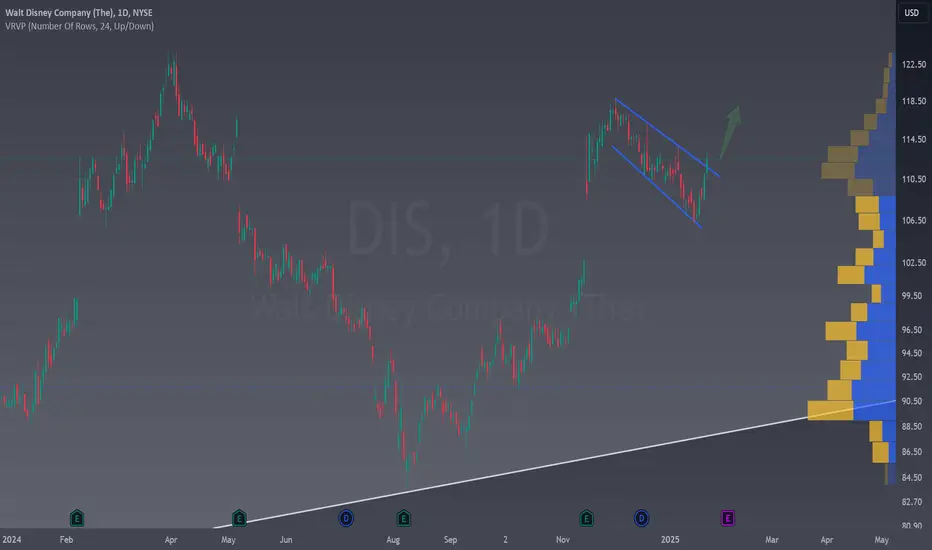
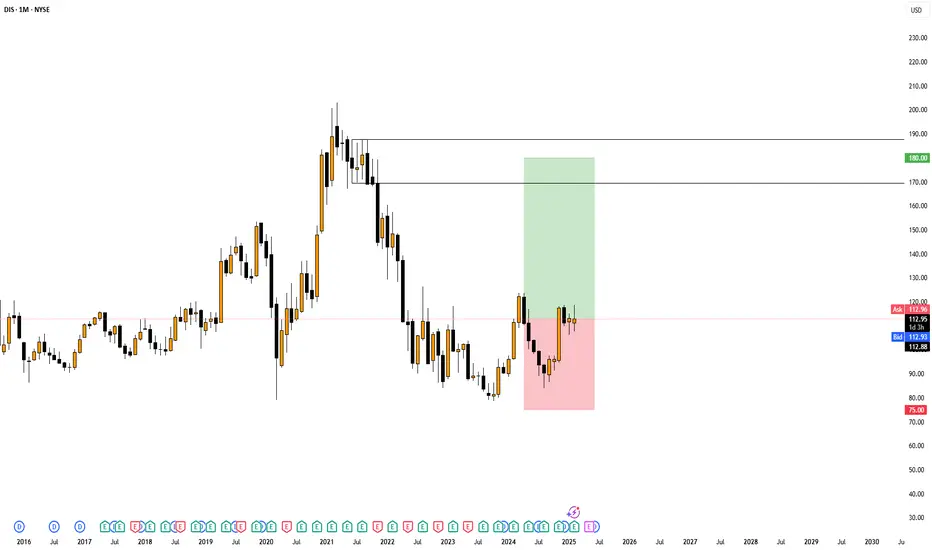
Disney is giving you a second chanceDisney presented a HISTORIC buying opportunity on the monthly chart as it approached the lower part of the bullish channel that has been forming for decades. That purchase in the 90s zone was ideal and had minimal long-term risk.
Today, Disney has confirmed the bullish breakout of a flag pattern, which is a clear continuation of the trend and should lead to substantial profits in the coming weeks. This, combined with the long-term bullish trend, makes it an ideal entry with a stop that can be tightly adjusted, right within the flag pattern.
Breakout on DIS! 🔉Sound on!🔉
📣Make sure to watch fullscreen!📣
Thank you as always for watching my videos. I hope that you learned something very educational! Please feel free to like, share, and comment on this post. Remember only risk what you are willing to lose. Trading is very risky but it can change your life!

Disney stock is bearishstock has already made a pattern at top of its chart and is now heavily bearish with a long bear candle indicating that stock is most probable heading south toward its depicted tp
please see what would happen

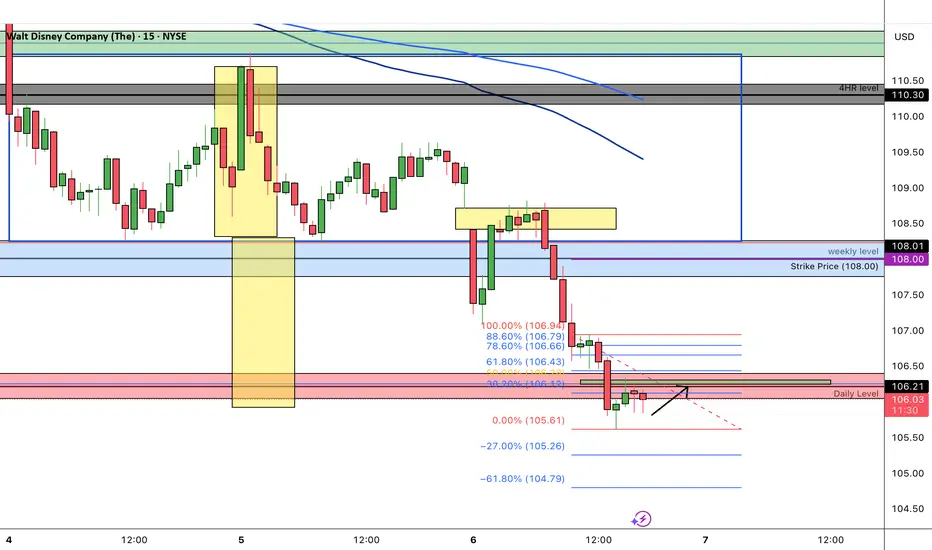
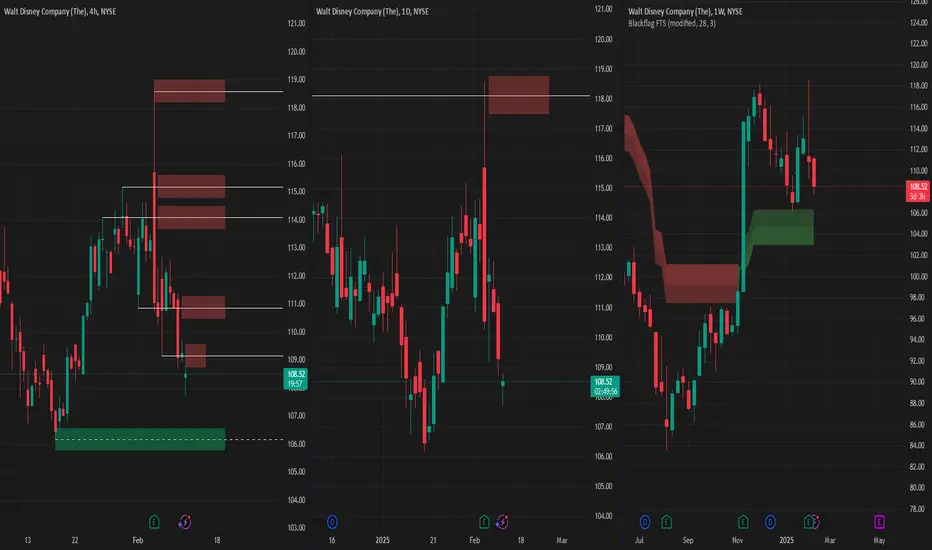
DIS 108 PUT Exp March 7 (Win)Made a consolidation box, broke a downtrend line, broke below weekly level, made a head & shoulder pattern, broke below, filled a gap and pushed back down, broke below my daily key level while also respecting the fibonacci level, while also fulfilling the same range it created for the width of the head of the head & shoulder pattern.
DIS 111 PUT Exp March 7 (win)Saw price was ranging on higher timeframe, dropped to the 4HR and 1HR to find price made a mini trend line inside of the range, broke the trend and took it down to the take profit level. Easy win off of the basics.

Disney - Swing Trade🚨 NYSE:DIS Swing Trade 🚨
🎯$119 🎯$125
- H5 Indicator Bullish Cross
- WCB Formed and Thriving
- Volume Shelf Launch
Not financial advice

Disney Weekly Update : Bullish Disney Weekly Update: Technical Analysis (03/02/2025)
In this analysis of Disney's weekly chart ( NYSE:DIS ), we observe key technical developments:
Major Resistance Breach: The price has broken above a long-term descending trend-line, signaling potential bullish momentum.
Consolidation Zone: After the breakout, the price is consolidating in a tight range near $113. This indicates indecision, with a possible continuation if resistance at this level is cleared.
Ichimoku Cloud Support: The price is trading above the Ichimoku Cloud, which acts as a strong support zone around $101-$107. This suggests that the bullish trend remains intact unless the price falls back into the cloud.
RSI Divergence: The RSI shows a bullish divergence, with higher lows forming as price consolidates. This supports the case for further upward movement.
Key Levels to Watch:
Resistance: $121 (top of consolidation zone)
Support: $107 (cloud support) and $101 (cloud base)
Potential Scenarios:
A breakout above $121 could lead to a bullish continuation toward $135-$140.
A breakdown below $107 would invalidate the bullish setup and may signal further downside.

DISNEY AnalysisAfter doing technical and fundamental analysis, Disney is looking primed for a move to the UPSIDE
Trading Disclaimer: Trading/Investing is risky and can result in lose greater than your deposit. Always consult with a professional before taking on any financial risk within any economic market,
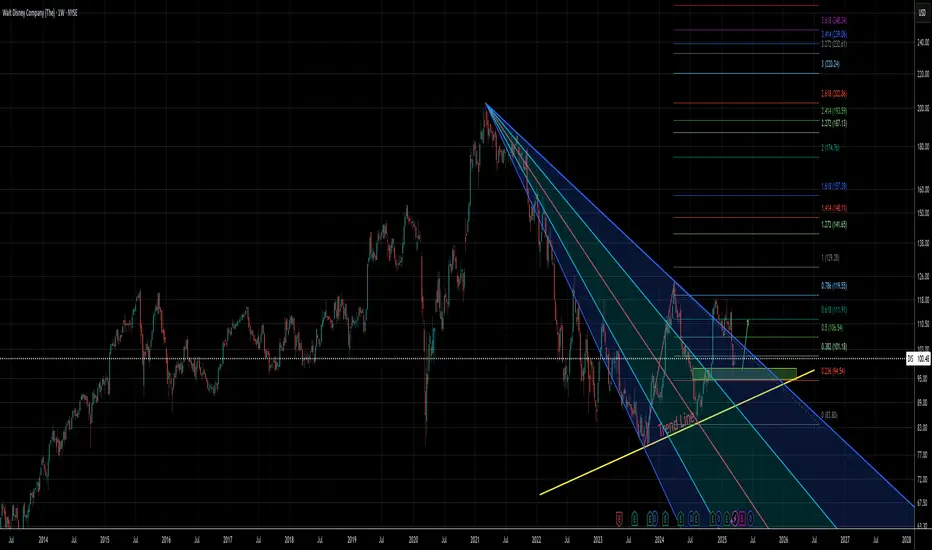
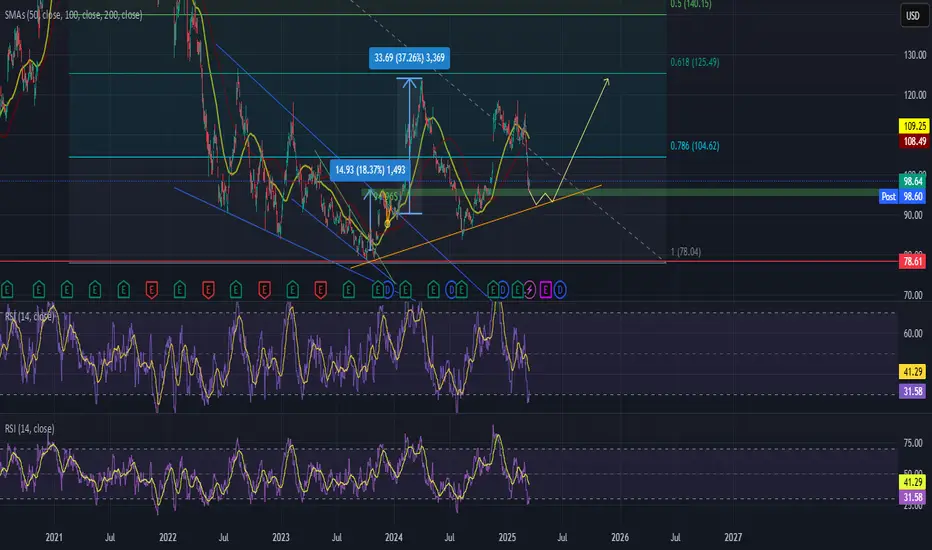
Disney: Recovery?!Disney appears to have stabilized after its recent sell-off, holding above the $106.26 support level. From here, the price should push beyond the $123.74 resistance during the turquoise wave 3. However, if it drops below $106.26 (41% probable), it will trigger our alternative scenario, signaling a move into our blue Target Zone between $97.27 and $91.46. After the wave alt.(ii) low in that range, the stock would quickly resume its upward trajectory.

Walt Disney Throwing off a Bullish Constellation. DISABC zigzag complete, then one bounce, and now:\
1.vWAP crossed by 2. engulfing bullish candle
3. signals on VZO/StochRSI
4. cross of MIDAS line
5. Cross of Bolinger Band %PCT
We like to use combinations or pairs of different indicator, as it improves chances. Similarly, every indicator we use looks at every market from completely different perspectives, be it volume, volatility, statistical deviation, price action, stochastics.
Disney shortIn DIS 6/20 110 P'S @5.27 avg very simple setup here. 1hr bear flag with a measured move just shy of 100$ psych level.
Weakness on DIS stockThe stock of Walt Disney Company looks interesting from the VSA point of view.
The monthly chart shows that the price is now around the top of the horizontal channel formed after a year of down move (blue lines). On one side, there is professional buying in the background, which might resolve this sideways to the upside, but there is much more supply around market peaks from the other side, and that might lead to a down move.
Deeper analyses of the price action over the last few months on the daily chart show massive supply. Moreover, the price went below the selling zone (red rectangle) and returned to its bottom on a low decreasing volume, showing an absence of professional interest to participate in an up move.
So, to summarise it together:
As of now, this stock is weak . With a big probability, the price may fall to the bottom of the monthly sideways channel first and if no buying suddenly appears while the price breaks the $79.24 level, it could reach the $20.0-$30.0 area then.
If professionals buy around the channel bottom, the move-up will depend on the size of that buying, but will most probably push the price back to the monthly channel's top.

Waiting on put entries for $DIS right now Gotta alert to enter puts on Disney i'm waiting for entries to get in put positions for March 21st 2025 exploration date and that is for the $100 puts I'm expecting Disney to tank to 105 but it could go to 100 so I'm just waiting and this is my post for that
Disney ShortableYes there is daily gap, not because of the gap I am trading but my own indicator...The price should drop to the green support in most 10 days.
Not an investment advise.

DIS: Buy ideaOn DIS on a 4 hour time frame, we are in an oversold zone. This means that we would have a high probability of seeing the market go up if all the analysis conditions are respected.
