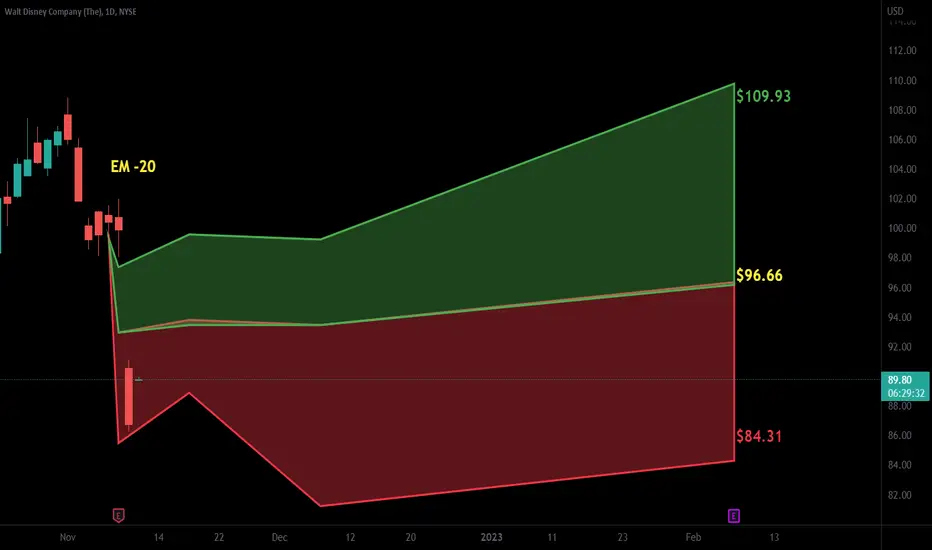
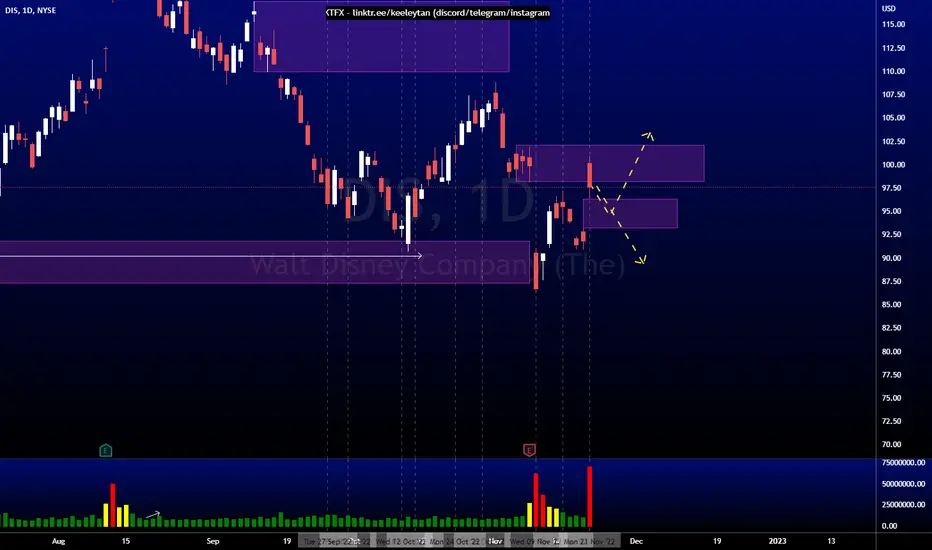
DIS 9 DEC 22 91/ 16 DEC 22 96 Diagonal BEAR RALLY SET UP:
DIS made a new swing low 11/09 and since then it has made its way back to the 50day with lower or equal volume making this a potential bear rally. The entire market has been in a bear rally, so based on the patterns forming, this should make it's way lower to fill the gaps below.
I used the doji candle on the 28th as my reversal candle at the 50day. And today it trigger because it traded below the previous days candle. Momentum indicators suggests more downside.
I'm set up for max loss on this trade so if this decides to head higher, I'll be ok and move on to the next trade.
I determined 91 would be a safe middle zone target based on the downward channel I drew. And if the market decides to bring this lower....to lets say 84 or 83, that would touch the lower trend line and could bounce back up to 91 to hit the apex of the trade on the 9th.
DIAGONAL SPREAD STRATEGY:
If this falls below my 91 target before Dec 9th, I'll wanna see if this goes down and touches 83 or 84. Lets say it gets there by Monday the 5th. It may want to rebound back to 91. If it does that and gets to 91 by lets say the 8th, I'll close out the entire combo. If this just stays below 91 by the 9th, I'll close out the entire combo as well.
If this goes sideways until about the 8th or the 9th (that would be around the upper trend line which could happen) I'll still have the Dec 16 96 strike. I'll have to watch it the week of expiration to see if I'll wanna close this out a couple days before the 16th.
If this goes higher I'm set up for max loss, so I'll just move on to another trade.
Ideally I wanna see this at 91 or lower by the 8th because I prefer to close the entire combo and move on to another trade.
DIS trade ideas
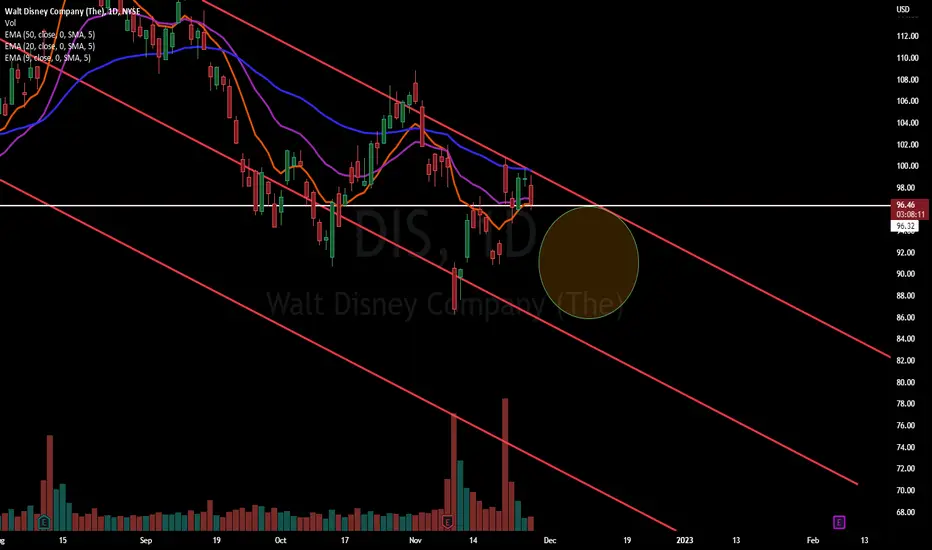
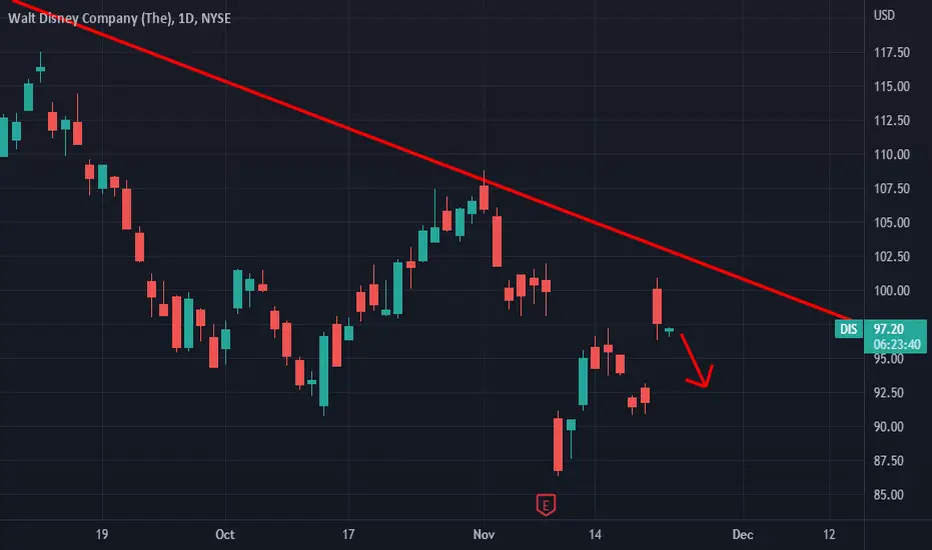
Disney DIS Short - Descending Triangle/Head and ShouldersDisney DIS Short - Descending Triangle/Head and Shoulders
Disney preparing to break down from a descending triangle . Expecting low $80s price range.
Longer term there's a clear Head and Shoulders pattern that would break down if the descending triangle also breaks
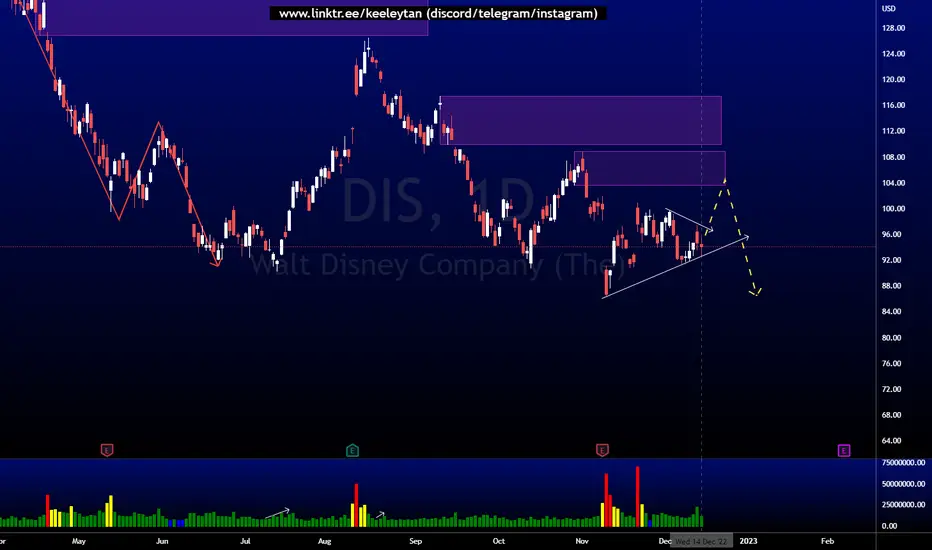
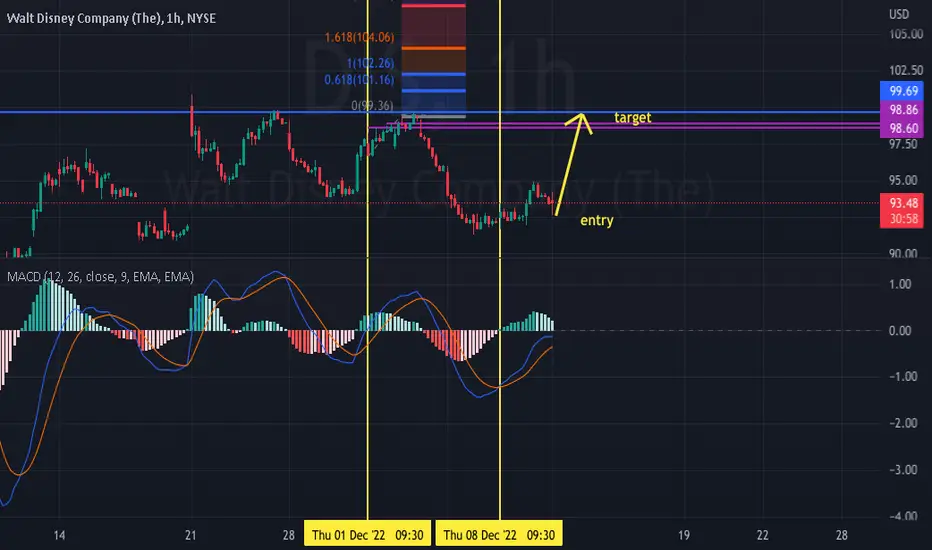
DISNEY - POTENTIAL SHORTDisney was down trending on the 4H timeframe from Nov. 1st to Nov. 9th 22. After a pullback to the .618 fib level, price from the stock began to consolidate and price condensed. Dec 6th price broke out of the consolidation and retested on Dec 13th.
The Price Action of Disney stock is currently creating a Bearish Pennant . If price can break $92 and reject successfully, a short could be profitable.

DIS AnalysisPrice has been consolidated for a few weeks since earnings release. There are a lot of sell side liquidity being built, and buy side liquidity building up recently. I'm expecting price to take out the buy side liquidity and mitigate the bearish POI at 108.84 first if price wants to go lower.
Disney and Avatar Let's wait to see how much the movie AVATAR collects, now that the studios are bought by Disney

Theta Machine > Closed All for Inflation #
I decided to close all my NAKED PUT trades instead of Hedging with $SPY, the reason to that is the move tomorrow can offset my HEDGE if goes against me, even with Beta Weight Portfolio.
So in this case I will reestablish all positions once we are over with the uncertainty, and that's until FOMC (Wednesday 2:00pm).

Disney long4hr momentum has confirmed push to the upside. Entry and target levels are shown on the chart
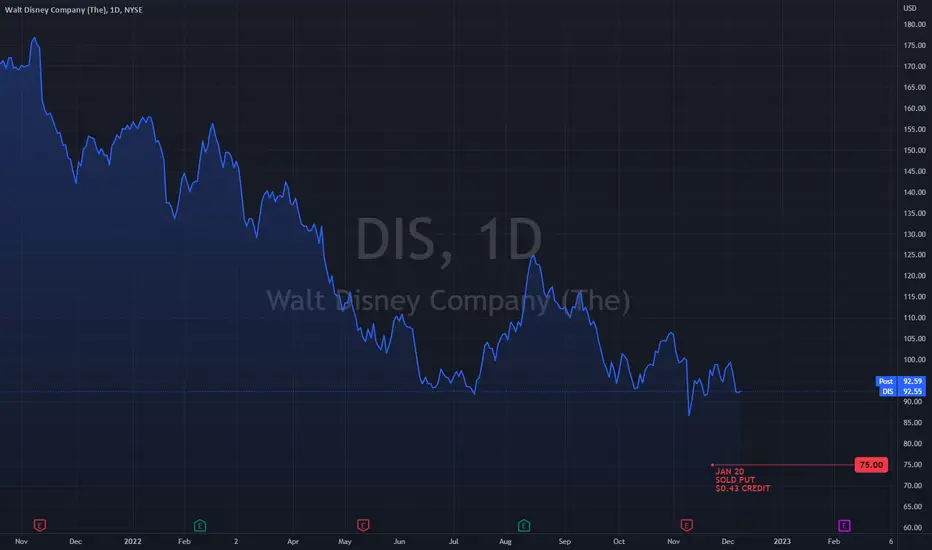
DIS New Trade > Naked Put
New Trade $DIS
Naked Put
Strike $75
Premium $0.43 x 3 contract = $129.00
Adding to the previous contracts at the same Strike 75 for a total credit of $563.00
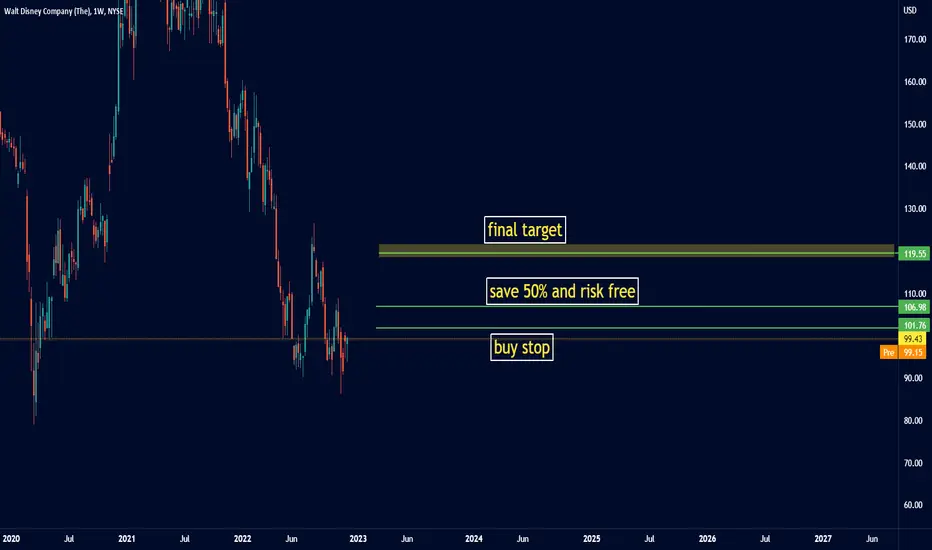
DIS 1W BUY STOPWe see the conditions for an upside move due to good fundamental observations and cheap stock prices
DIS AnalysisPrice is playing out as analyzed last week. Price bounced off the fair value gap at 96.32 and right now, it seems that price will be heading towards the bearish POI at 108.84.

DIS, 10d+/15.12%rising cycle 15.12% more than 10 days
==================================================================================================================================================================
This data is analyzed by robots. Analyze historical trends based on The Adam Theory of Markets (20 moving averages/60 moving averages/120 moving averages/240 moving averages) and estimate the trend in the next 10 days. The white line is the robot's expected price, and the upper and lower horizontal line stop loss and stop profit prices have no financial basis. The results are for reference only.

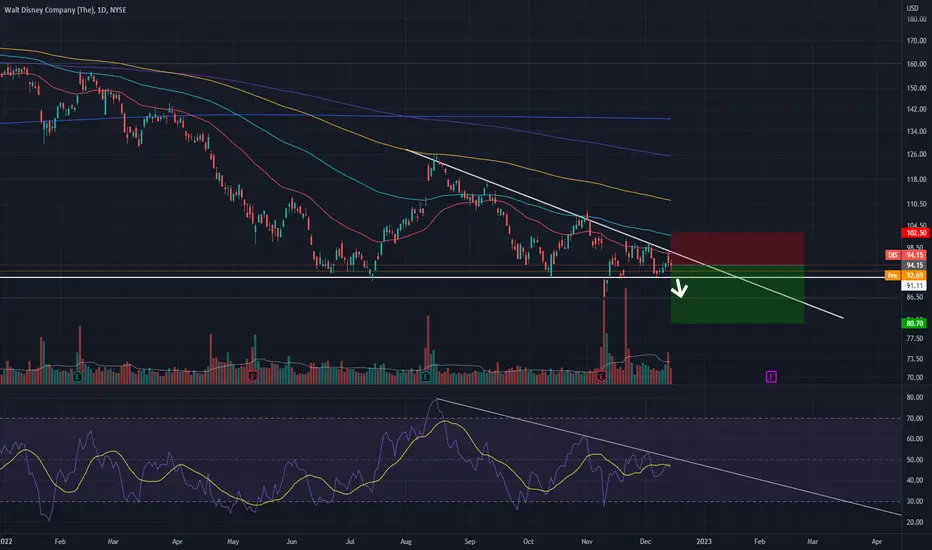
Descending TriangleEarnings are after market close.
It does not look like analysts are expecting a lot but you never know.
Neutral pattern until broken.
Wide channel down with a horizontal support line at the bottom of the triangle.
No recommendation.
Upcoming Quarter's Earnings
Announce Date
11/8/2022 (Post-Market)
EPS Normalized Estimate
$0.56
EPS GAAP Estimate
$0.35
Revenue Estimate
$21.44B
Analysts Group 1 EPS Revisions (Last 90 Days)*
UP-1
Down-20
Group 2:
Up 5
Down 18

DIS AnalysisPrice played out nicely as analyzed last week. Price filled the fair value gap at 96.32 and bounced off it. From here, I'm expecting price to continue higher to mitigate the last bearish POI of this leg down at 108.84 before continuing lower.

SCALP ON DIS LONG ( 11.23.2022)Newly, reinstated CEO Bob Iger moved quickly to announce restructuring plans for the company. Iger is said to have already began to undo a corporate structure put in place by his hand-picked successor. Iger said the restructuring would result in changes to Disney Media & Entertainment Distribution, a unit former CEO Bob Chapek formed in October 2020 to centralize all film and television sales and distribution. The unit’s chairman, longtime Chapek lieutenant Kareem Daniel, will leave the company. Separately, Walt Disney said on Monday Iger will get an annual base salary of $1 million and a long-term incentive award with a target value of $25 million

short on DISin the short term it seems to have a higher probability of a negative movement regarding price elasticity and GAP.
DIS AnalysisPrice respected the bearish POI at 98.11 and did not manage to close above the opening price despite high volume. I'm expecting price to go lower and fill the fair value gap at 96.32 before we see where do price wants to go from there.
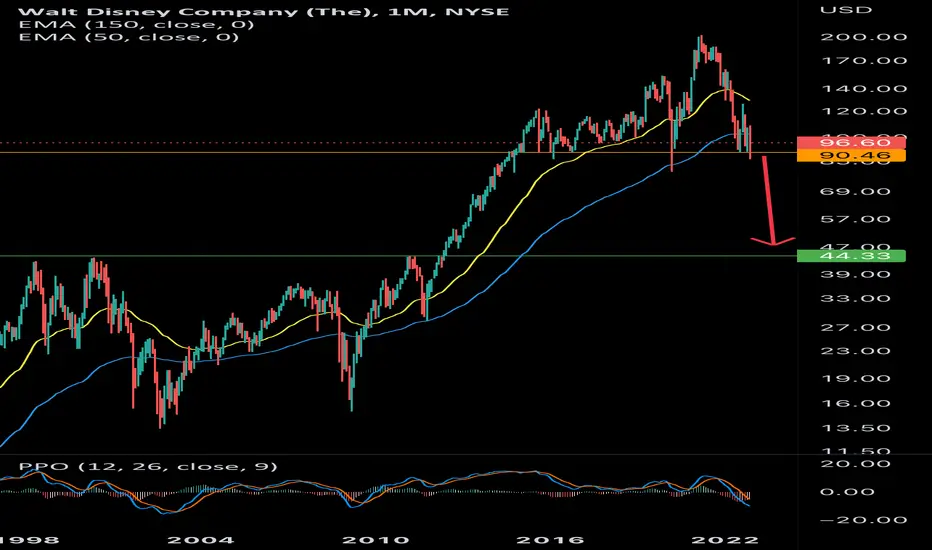
DISNEY TO $45Disney already dropped over 50%, while SPY currently is about 20% down (I’m rounding it here). Monthly charts obviously shows support around $90, which price tested multiple times over the last 7 years. Once that support is broken, AT MINIMUM I expect another 50% decline. That would be a price target of $45, round top back to 1998, 2000 and 2011 highs.
Jim Cramer yesterday tweeted “Disney, pay 98 if you can. That will be nothing ...versus where it goes” after announcement of the new CEO - last nail in the coffin - I will easily take an inverse of Jim’s view.
Long on DISLong on DIS till 110, the sell it. wait for a bounce back and trade long till 150 , 2S&H.

DIS AnalysisPrice played out as analyzed last week. Price filled the fair value gap and is heading toward the bearish POI at 98.11. I'm expecting a continuation lower or a consolidation at this level.

Buying Disney break of recent high.Walt Disney - 30d expiry - We look to Buy a break of 102.11 (stop at 97.88)
We are trading at oversold extremes.
A break of the recent high at 101.50 should result in a further move higher.
Bullish divergence can be seen on the daily (the chart makes a lower low while the oscillator makes a higher low), often a signal of exhausted bearish momentum, or at least a correction higher.
This stock has seen good sales growth.
We are trading at oversold extremes.
Our profit targets will be 112.48 and 117.48
Resistance: 102 / 106 / 110
Support: 95 / 90 / 85
Disclaimer – Saxo Bank Group.
Please be reminded – you alone are responsible for your trading – both gains and losses. There is a very high degree of risk involved in trading. The technical analysis , like any and all indicators, strategies, columns, articles and other features accessible on/though this site (including those from Signal Centre) are for informational purposes only and should not be construed as investment advice by you. Such technical analysis are believed to be obtained from sources believed to be reliable, but not warrant their respective completeness or accuracy, or warrant any results from the use of the information. Your use of the technical analysis , as would also your use of any and all mentioned indicators, strategies, columns, articles and all other features, is entirely at your own risk and it is your sole responsibility to evaluate the accuracy, completeness and usefulness (including suitability) of the information. You should assess the risk of any trade with your financial adviser and make your own independent decision(s) regarding any tradable products which may be the subject matter of the technical analysis or any of the said indicators, strategies, columns, articles and all other features.
Please also be reminded that if despite the above, any of the said technical analysis (or any of the said indicators, strategies, columns, articles and other features accessible on/through this site) is found to be advisory or a recommendation; and not merely informational in nature, the same is in any event provided with the intention of being for general circulation and availability only. As such it is not intended to and does not form part of any offer or recommendation directed at you specifically, or have any regard to the investment objectives, financial situation or needs of yourself or any other specific person. Before committing to a trade or investment therefore, please seek advice from a financial or other professional adviser regarding the suitability of the product for you and (where available) read the relevant product offer/description documents, including the risk disclosures. If you do not wish to seek such financial advice, please still exercise your mind and consider carefully whether the product is suitable for you because you alone remain responsible for your trading – both gains and losses.

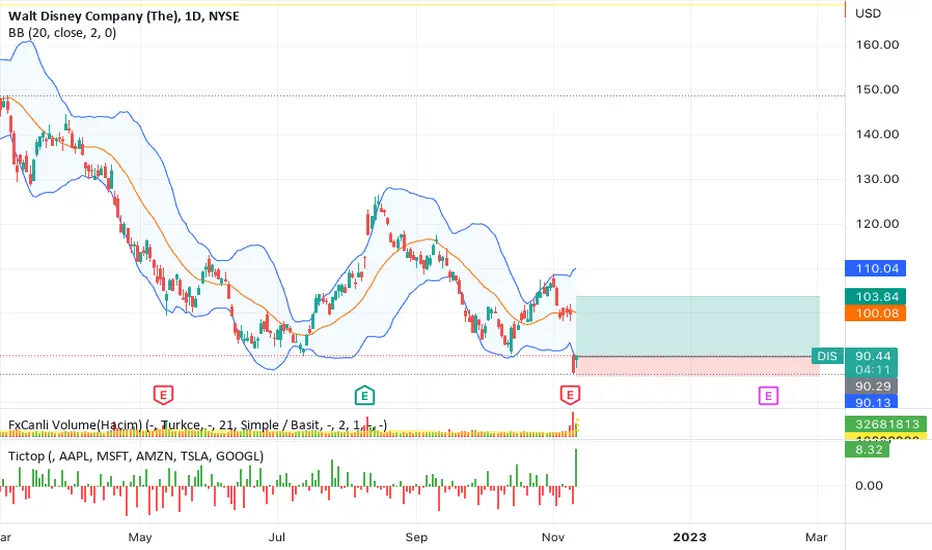
double bollinger & ichimoku DIScombination double bollinger band and ichimoku can give a good incidator to buy and sell

$DIS with a Bearish outlook following its earnings #Stocks The PEAD projected a Bearish outlook for $DIS after a Negative Under reaction following its earnings release placing the stock in drift D.