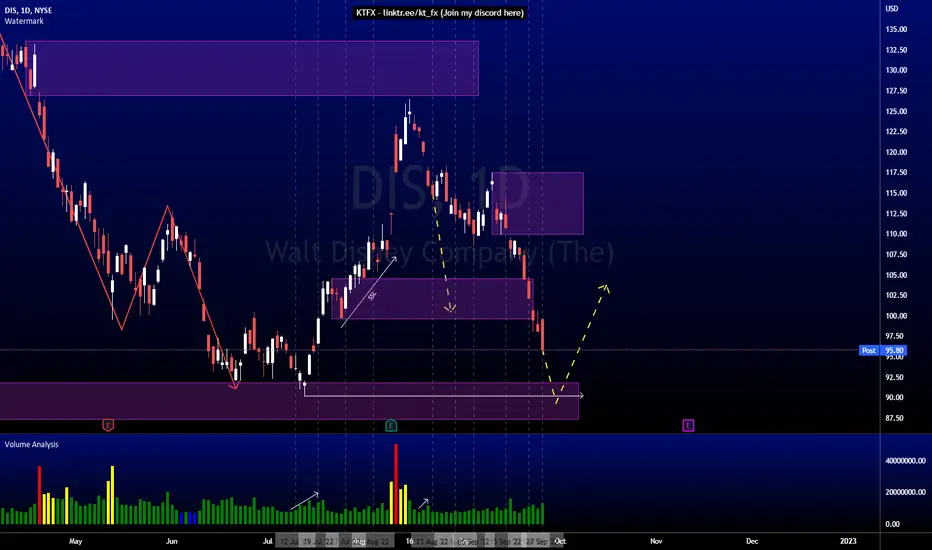
DIS AnalysisPrice did not play out as analyzed last week. I was expecting price to rally into the bearish POI at 109.88 before going lower. Price went lower without any mitigation. The bullish POI at 104.57 was invalidated straight away. Right now, the target for this down move should be a deeper mitigation of the bullish POI at 91.80, and potentially the lows at 90.23 before we see any bullish retracement.
DIS trade ideas
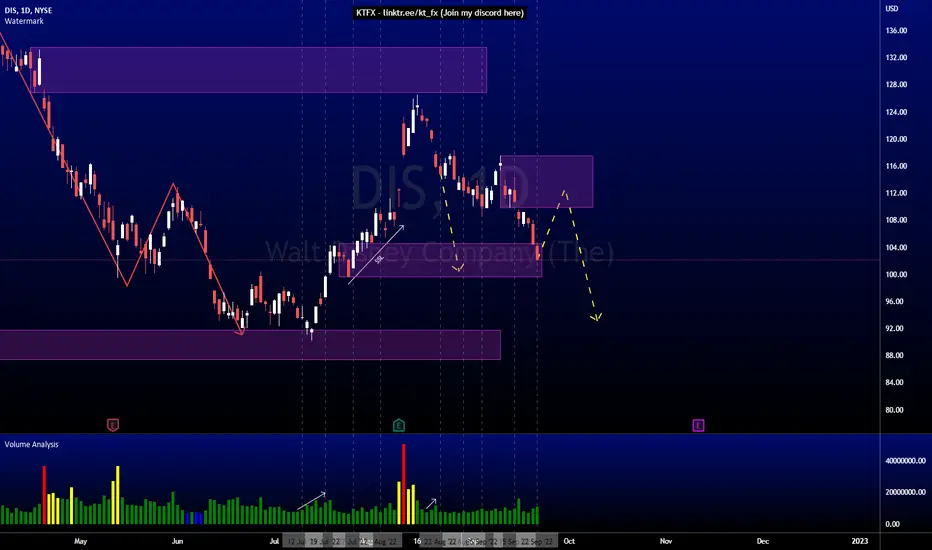
DIS AnalysisPrice is playing out exactly as analyze over the past few weeks. Price is currently mitigating the bullish POI at 104.57. I'm expecting a bullish retracement into the bearish POI at 109.88, and continue lower following the bearish order flow.
DIS bullish hammer on weeklyLoved the hammer on daily had to take an action. Love today's dullish hammer on daily too.

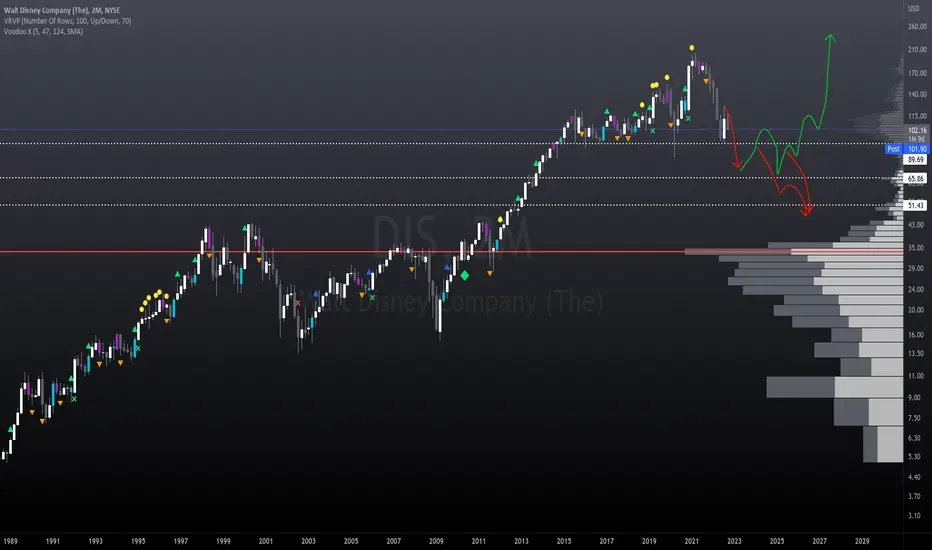
Good Chance of Disney Capitulation (fire sale!)Disney showing order absorption price structure at its major support zone on the 2-Month chart indicates a better than 50% chance of at least a bull-spring formation under the support or a markdown below it.
I'm certainly going to be setting limit buy orders around $70 and $50 a share to hold for the next few decades.
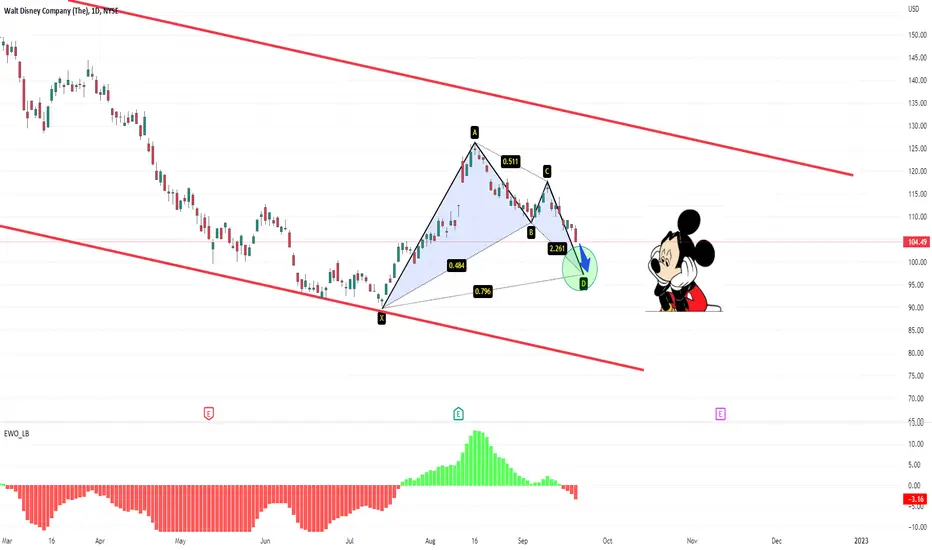
Back Below $100Disney looks to extend it's downtrend and hit the range of $96-$92, and in my opinion will complete the bearish bat pattern.
Not financial advice, good luck to all :)
9/18/22 DISThe Walt Disney Company ( NYSE:DIS )
Sector: Consumer Services (Cable/Satellite TV)
Market Capitalization: $197.346B
Current Price: $108.25
Breakdown Price: $107.15
Sell Zone: $120.75-$113.75
Price Target: $90.90-$89.70 (2nd)
Estimated Duration to Target: 77-82d
Contract of Interest: $DIS 12/16/22 110p
Trade price as of publish date: $8.25/contract

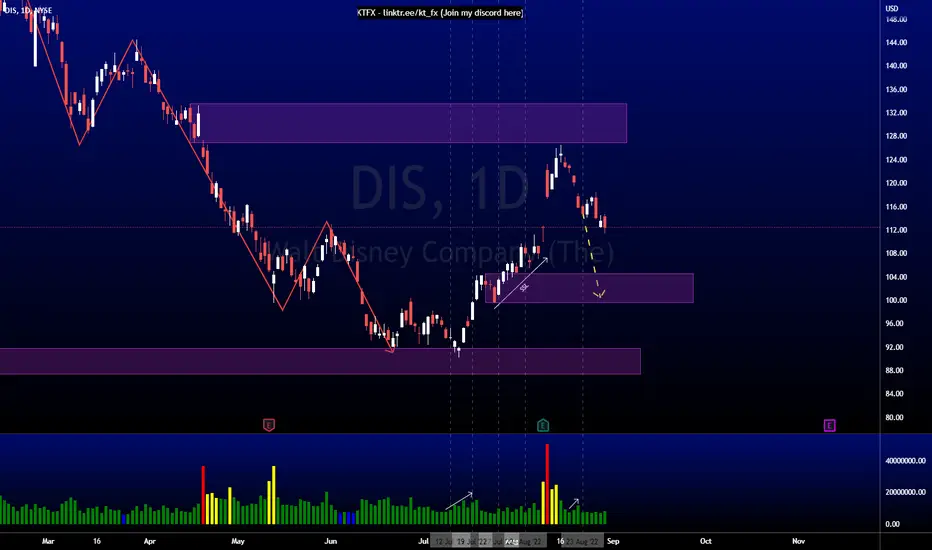
DIS AnalysisPrice consolidated since my last analysis. My expectations are still unchanged. I'm still expecting price to go lower to mitigate the bullish POI at 104.57 and take the sell-side liquidity.

#long #stock #Disney #DIS The end of the negative trend?
The wedge shape seems to be broken, the movement of the indicators confirms the change. The exchange rate is looking for a direction.
The next 5 waves emerging?
+
The largest investor also bought it (David Rolfe, Mairs & Power).

DIS Buy signalDisney has come out on top from its competition with Netflix in the movie streaming industry. Q2 was a pleasant surprise for investors of Wall Street, and as the economy is recovering because of the large amounts of capital movement from Europe to the US, Q3 is likely to have a positive uplook. Retaliatory spending by consumers on theme parks and Disney+ subscriptions will push the price of the stock. Strong support at $100-$110, some resistance at $120. Suitable for short term investment. Wall street analysts show a Strong Buy.

Disney AnalysisGuess the Pattern❗
Catch it OR watch it 😈
Just check out Chart on daily TF you get the proper idea what's gonna happen 🤑
DISNEY SHARES WILL BE HAMMERED DOWN TO $30 dollars priceDisney shares could be heavily hammered down to $30 dollars share price. That would force Disney holdings into an assets firesale to raise liquidity.
Most stock market investors are not prepared for a similar scenario.

DIS AnalysisPrice is playing out exactly as my last analysis. Price is heading towards the bullish POI at 104.57. I'm expecting price to continue down to mitigate the bullish POI.
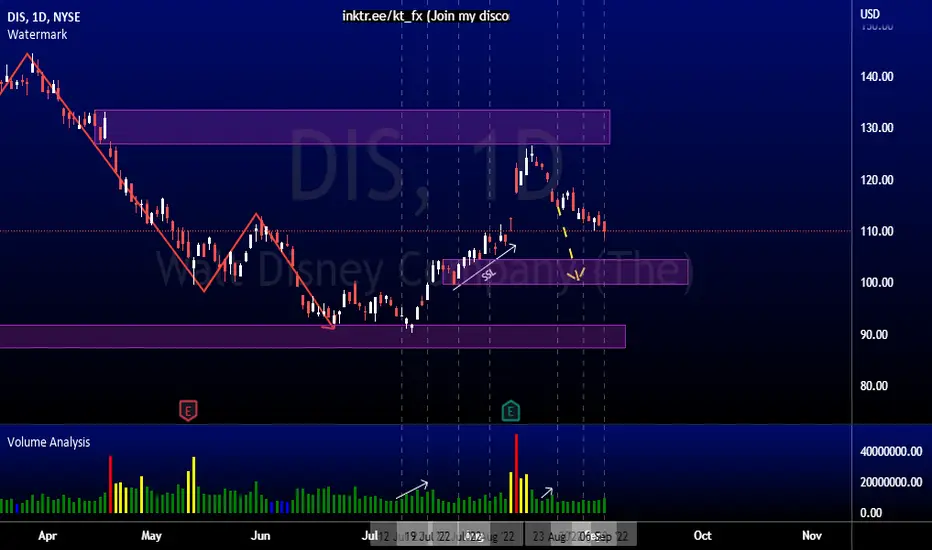
DIS AnalysisPrice consolidated at the fair value gap at 117.33 last week. I was expecting price to drop and take the sell-side liquidity. Right now, we have filled the gap completely. I'm still expecting price to go down. Possible target for this downtrend is to mitigate the bullish POI at 104.57.

DIS AnalysisPrice has played out exactly as analyzed last week. Price is currently filling up the fair value gap at 117.33. As price filled the gap, we see volume increasing on the downmove. I'm expecting price to go lower and take more sell-side liquidity from here.

Where to find Disney Reversal to Long?Disney. We are exposed to Disney almost instantly we are born into this world. The cartoon we are exposed to , the posters, the gifts, the soft toys we had. Disney, the creator of our "Fantasy", can their strong moat stop the downtrend of its stock price?
Sign of downtrend
-Candle sticks moving below MA200 . Fail to even get near the MA200 trendline for the past 200 days.
-Downtrend line B : 2 Fib extension of downtrend line A , magnitude much stronger than of line A
-Downtrend line C: 1.618 Fib extension of downtrend line B , magnitude abit strong than of line B
Reversal in progress?
-Retracement R2 magnitude is almost similar to R1 , but took much shorter time(26 days vs 116days) to retrace the same amount
-Retracement R3 magnitude is strong than of R2 .
-Thus the upward trend is getting strong: R3 > R2 > R1
Take a look at the horizontal volume indicator. The volume indicator sums up the volume traded at the prices for the past 1800 bars/1800 days . Bulk of the trading occurs between 97 to 115
The price range of 97 to 115 probably is the strongest support Disney can have. If the candlesticks plunge below 97 , the next area to have such high trading volume will be around 50 .
Watch out for reversal such as double bottom within the price range of 97 to 115

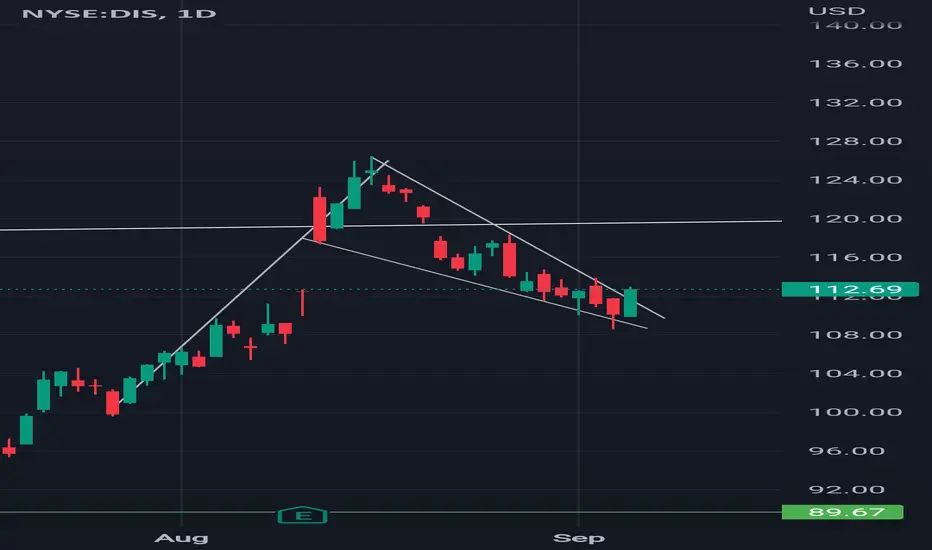
DIS - Looking for more bearish moveI expect it to have a slow climb up but will reject before the $118 zone. If this plays out I will buy a PUT option for next Friday expiry. (Not Financial Advice)

$DIS - Can it close the gap at $122.67?Disney broke out of the down trend channel. However, the price has retreated from 50% of breakout measured move target. Which is normal for breakouts.
There is a chance that it can back fill the gap at $112.67 area, if the price breaks below the support at $116 .
If the price bounce from $117 area, it could retrace back to $126 to $130 area.
Breakdown targets -
Target 1 - $116
Target 2 - $112.67
Risk - reversal from $117 area
Disclaimer: Not investment advice.
If you like this post, follow me and subscribe to my posts for more technical analysis charts (FREE).

$DIS or Disney is over extended $DIS is over extended. Waiting for the shift of momentum to change. On the Trendsi indicators, the money momentum (White Line) is over extended into the upper red band area, indicating an over extension. Being patience with the rest of the indicators to verify momentum. When the middle band shifts to red (indicating a bear market momentum), as well when a sell signal appears will let me know when Disney has shifted to a downward trend.

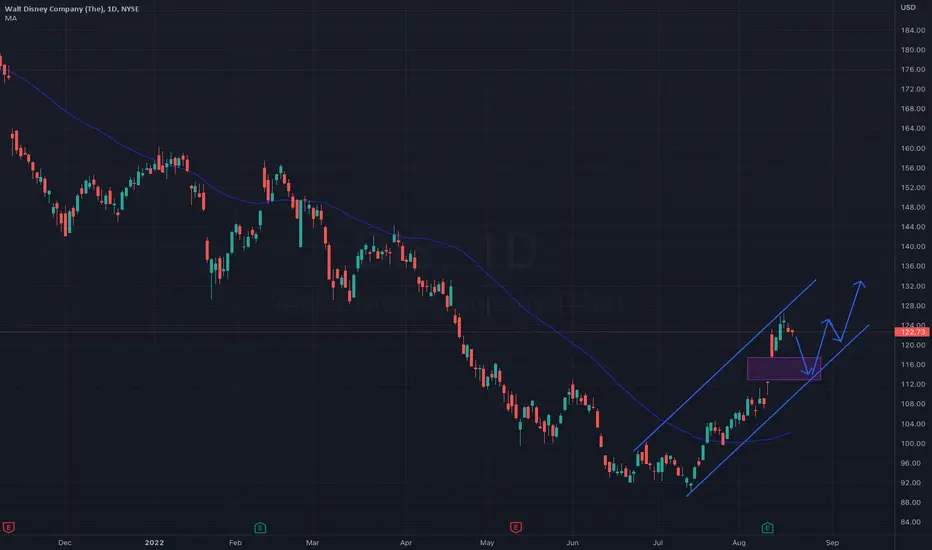
DIS next moveThe ideas about DIS next move is to may fill the gap first, test the previous high and pull back before it clears the way up again. It would also work in a nice uptrend channel..
VIX near its long average value means there is a possible increase and stock and indexes pull back..
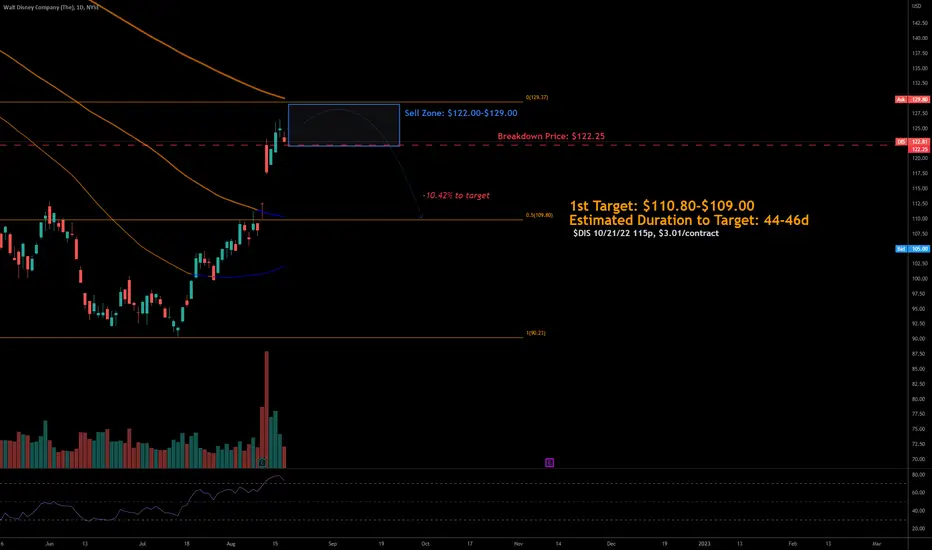
8/17/22 DISThe Walt Disney Company ( NYSE:DIS )
Sector: Consumer Services (Cable/Satellite TV)
Market Capitalization: $223.696B
Current Price: $122.81
Breakdown Price: $122.25
Sell Zone: $122.00-$129.00
Price Target: $110.80-$109.00
Estimated Duration to Target: 44-46d
Contract of Interest: $DIS 10/21/22 115p
Trade price as of publish date: $3.01/contract
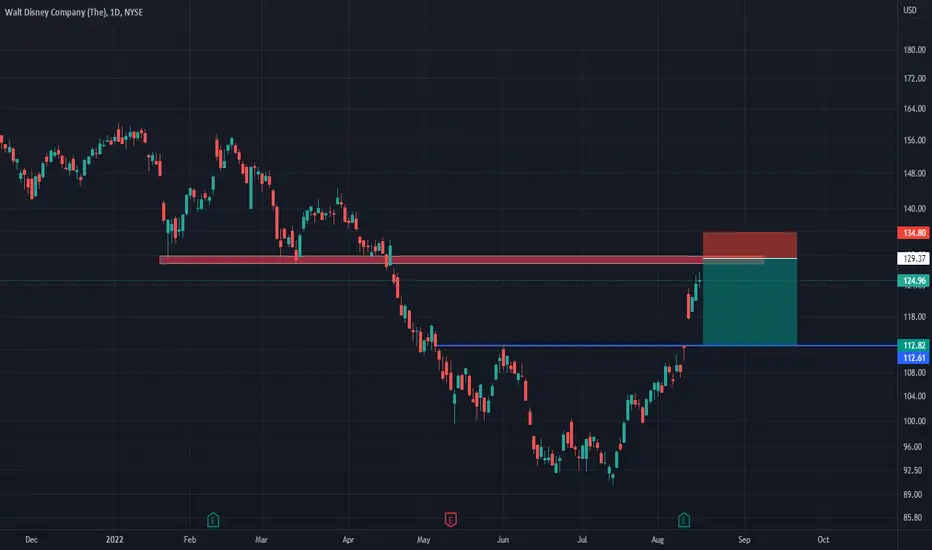
Disney over-extended? Disney
Short Term
We look to Sell at 129.37 (stop at 134.80)
Upward pressure has continued and we are assessed as being in the corrective leg before the next selloff. Preferred trade is to sell into rallies. Our outlook is bearish. There is scope for mild buying at the open but gains should be limited. News events could adversley affect the short term technical picture.
Our profit targets will be 112.82 and 102.30
Resistance: 130.00 / 144.00 / 155.00
Support: 110.00 / 100.00 / 90.00
Disclaimer – Saxo Bank Group. Please be reminded – you alone are responsible for your trading – both gains and losses. There is a very high degree of risk involved in trading. The technical analysis, like any and all indicators, strategies, columns, articles and other features accessible on/though this site (including those from Signal Centre) are for informational purposes only and should not be construed as investment advice by you. Such technical analysis are believed to be obtained from sources believed to be reliable, but not warrant their respective completeness or accuracy, or warrant any results from the use of the information. Your use of the technical analysis, as would also your use of any and all mentioned indicators, strategies, columns, articles and all other features, is entirely at your own risk and it is your sole responsibility to evaluate the accuracy, completeness and usefulness (including suitability) of the information. You should assess the risk of any trade with your financial adviser and make your own independent decision(s) regarding any tradable products which may be the subject matter of the technical analysis or any of the said indicators, strategies, columns, articles and all other features.
Please also be reminded that if despite the above, any of the said technical analysis (or any of the said indicators, strategies, columns, articles and other features accessible on/through this site) is found to be advisory or a recommendation; and not merely informational in nature, the same is in any event provided with the intention of being for general circulation and availability only. As such it is not intended to and does not form part of any offer or recommendation directed at you specifically, or have any regard to the investment objectives, financial situation or needs of yourself or any other specific person. Before committing to a trade or investment therefore, please seek advice from a financial or other professional adviser regarding the suitability of the product for you and (where available) read the relevant product offer/description documents, including the risk disclosures. If you do not wish to seek such financial advice, please still exercise your mind and consider carefully whether the product is suitable for you because you alone remain responsible for your trading – both gains and losses.
Walt Disneyheres my walt disney trades
and longs investments and whatnot----over the years...congrats walt disney its been decent.
