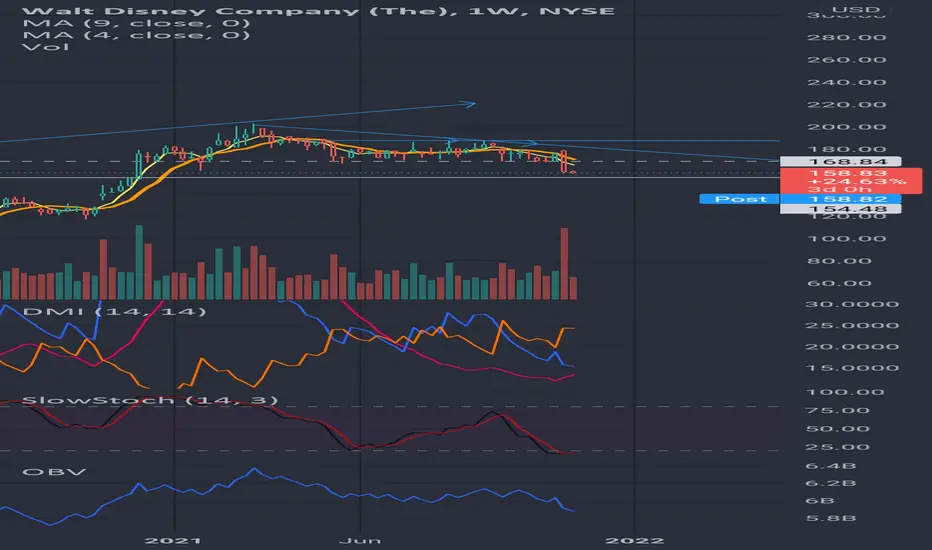
DIS Long, target 220With the rise of streaming services, Disney is one of the leaders. I'm speculating that DIS is gonna introduce video games soon, just to stay competitive with NFLX.
Technical analysis shows that DIS has been consolidating for a long time and now wants to break out.
Entry: 169-170
Target: 220
Stop-loss: 167
Period: 6-12 months
Position: 5% of the capital
DIS trade ideas

DIS shortive been analyzing and backtesting some charts.
In particular~ shorts. One thing I really liked was DIS short. I was in the long swing that I exited prior to ER, we gapped down bigly of course on ER. They tried to fade it unsuccessfully. When we could not get over the ER gap down, could have looked for a short entry on a smaller timeframe like 30 min or 1 hr. The interesting thing about where we gapped down and then traded to was that it was the perfect 1.272% fib retracement from the April to May down move and I mean nearly to the absolute penny. It was enough to stop the down move for the time being, but with the weekly 100 sma not too far away any longer and also close to the 1.618% retracement on the daily of this bearish trend, it make sense to go test it. The $158.50 level area will try to act as support.
As I stated before, the best would have been to get in when we rejected fading the gap with a 1st target of $159 or so (probably would have taken partial profit on the close Friday). But an acceptable alternative would be to set a stop limit sell under the relative low~ which is what I am doing.
**DIS swing short**
Stop limit sell
Stop: $158.28
Limit sell: $158.75
1st target: $150.50
2nd target: $145.80
I oftentimes adjust additional targets and/or just take profit depending on what price action does. ive been analyzing and backtesting some charts.

DIS, NO touch down "Glitch" in data i guess !NO touch down here guys
i think there is a glitch in
the data. Be aware !!!

Disney's MACD @ one off most extremes reading since 2015We are closing in on our trough soon w/ range btw 8% down to 34% up !!!

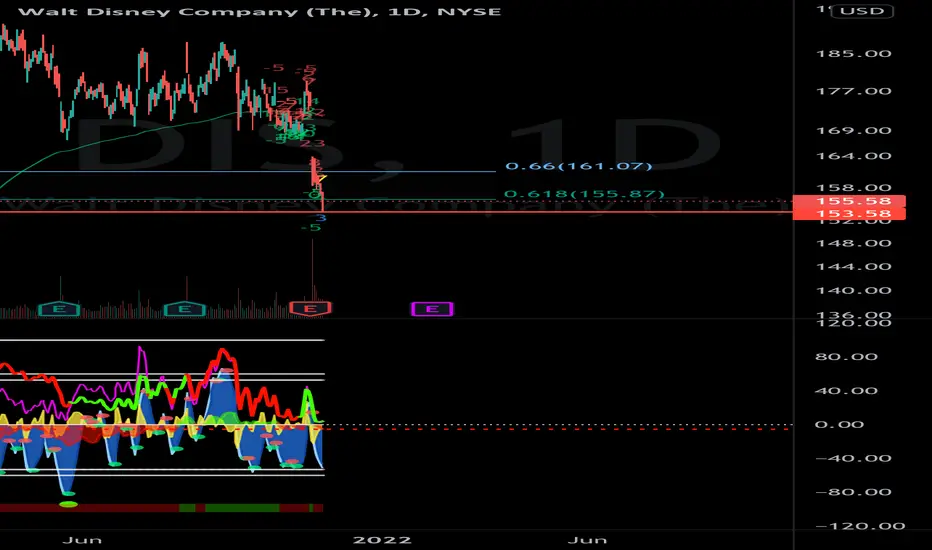
Disney's Elliott, just a probable scratch one not completed yet Do not take these estimates seriously, some of these so called analyst have a success rate of <50 % ! Non the less something to consider.
- Based on 23 Wall Street analysts offering 12 month price targets for Walt Disney in the last 3 months. The average price target is $205.43 with a high forecast of $263.00 and a low forecast of $172.00. The average price target represents a 30.61% change from the last price of $157.28.

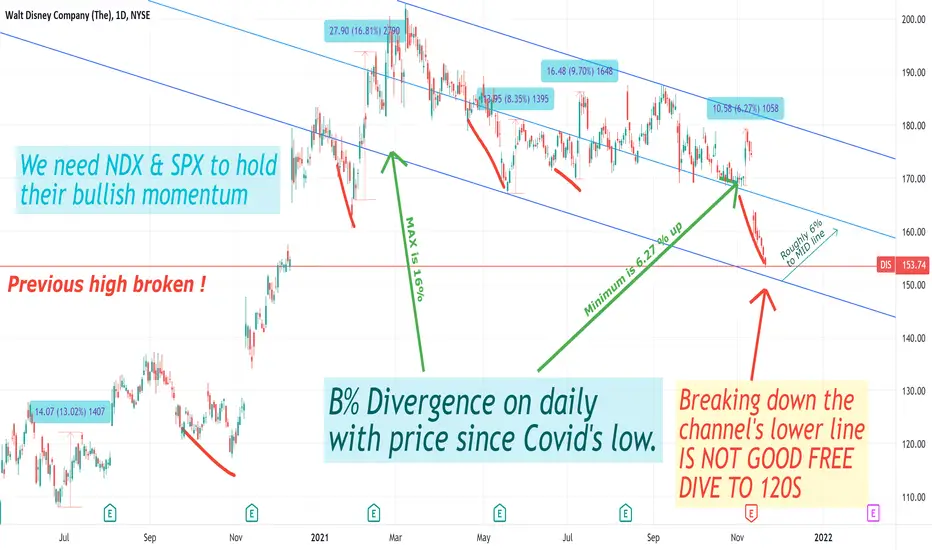
DIS'S possible target is the MID line W/6% bullish move !The only thing is we need to hold the lower line of the channel breaking that
we have FREE DIVE to 120s or so.
DIS'S Stochastic oscillator isn't giving us the love we need YETNot this moment of writing this idea to say the least . We need some love from this indicator to signal a reversal
non is given so far. We do no need it to happen right a way it could be lagging, but non the less it helps allot
if the majority of indicators are giving the same signals not just one or two.

No time to dieBuy opportunity is visible
Disney is going to open Disney lands and cruise ships in next week ahead…

DIS's Volume is just above average to say the least,if MKT helpus and do not pullback hard we should see 7%-12% bullish move on this ticker !!! Just to be clear
i am already in and my calls are HOT RED, hopefully they will turn green soon enough !!!

Walt Disney is closing an old "Gap" what does it mean for us nowI do not see this as something of magnitude,
far away & different momentum, BUT, gap
lovers can't challenge them they have their
own analysis for such events maybe they
can share their analysis for such a thing.

Disney Long swing tradeWe have a few key levels here coming into play that I’m liking and have already acted upon today, we have support at the pre COVID high which is holding as of now along with the fib levels and a gap which was recently closed, along with my market cipher indicator showing a bottom on lower time frames at least a temporary one but definitely money to be made longing here in my option.
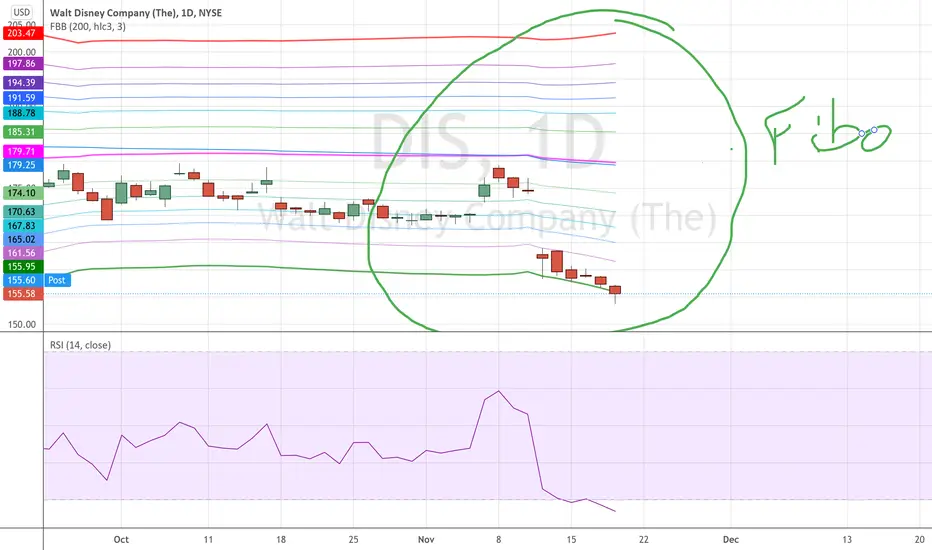
Daily Fibo refusal to go downbeautifully done, for those that like, every time that it tried to go below the fibo, it will bring back. Seems like we bottom at this level.
DIS' 2ed highest volume since Covid's low move a head up/down62 Million shares mark the 2ed highest volume since Covid's crash. We shall see what happen, technically we could go down
further more. I am long with few calls 211126 162.5 . Whether we go further down a bit more just like the charts below
or no we will go up eventfully. I made a mistake by buying early during OPEX week, we shall see what happen.
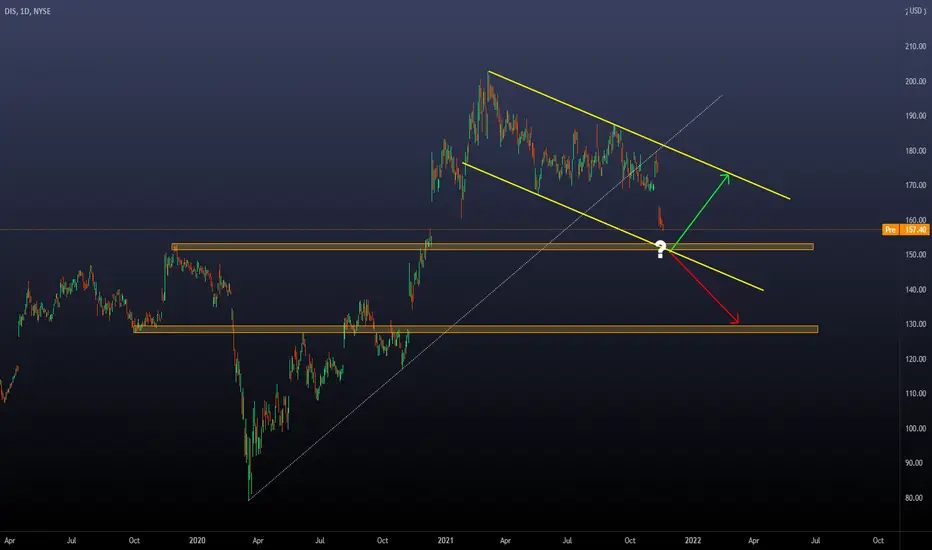
What do you think is coming next on DIS? Today we will define all the relevant levels on Disney either for bullish or bearish scenarios.
After the gap on the 11th of November , the price kept falling, and now it's a good time to think about reversal areas or the following bearish targets
My main conclusion right now is that we are on a Flag ABC pattern, which means that we may see content with the cloned channel (yellow lines), which makes convergence with the previous ATH in November 2019. That's a level that we should see bullish pressure to keep our bullish thesis valid.
However , if the price breaks that level and reaches 146.00, I will think that my bullish view is not valid anymore, and I would think about bearish targets on the next support level at 130.00
Despite the specific resolution, I think the current situation may be interesting to trade after we have a clear formation. Once we have structures with more than 250 days, it's pretty easy to look into the past for similar conditions and develop consistent setups based on a statistical perspective.
Thanks for reading! Feel free to share your view and ideas in the comment box.
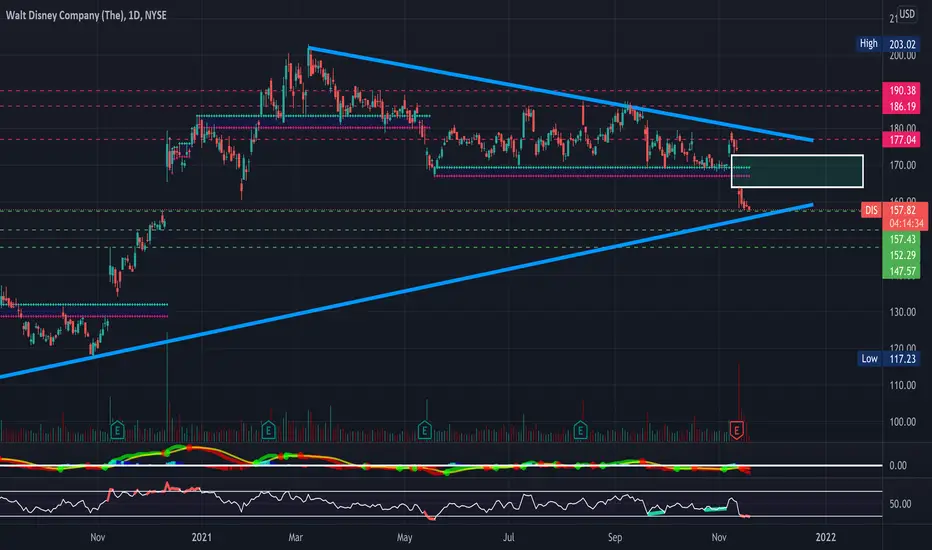
Symmetrical Triangle - Gap FillKeeping a close eye on DIS here- Sold off after earnings leaving a big gap to fill on the upside. Holding a big symmetrical triangle on the daily timeframe along with a falling wedge on the 4-hour timeframe. With buyer volume should really pop- Will be looking for a breakout from this triangle (Broader Markets Permitting) - Just some support and resistance levels to keep an eye on in the meantime along with some RSI-based supply and demand zones - Bullish and looking for a breakout
- Symmetrical Triangle
- Falling Wedge on the 4-Hour Timeframe (See Attached Chart Below)
- RSI in oversold territory
- Slight bullish divergence on the RSI
- Big Gap Fill on the Upside
PT1- $158.76
PT2- $161.83
PT3- $163.67
PT4- $172.55 & Gap Filled
4-Hour Timeframe
Previously Charted
DISThere are 2 options,
a rebound from the +ema500 level is possible, but this is very risky, since we can go much lower, going
lower implies the peak of the first wave and a rebound from ema1000.

DIS appears to be getting close for a reboundThe bleeding after ER seems to be slowing down, daily range contracting. Might be near a bottom or rebounding very soon.

Disney bullish harami on dailyKeep an eye out tomorrow for price movement. Formed bullish harami at EOD. Looks like its coming to a support.
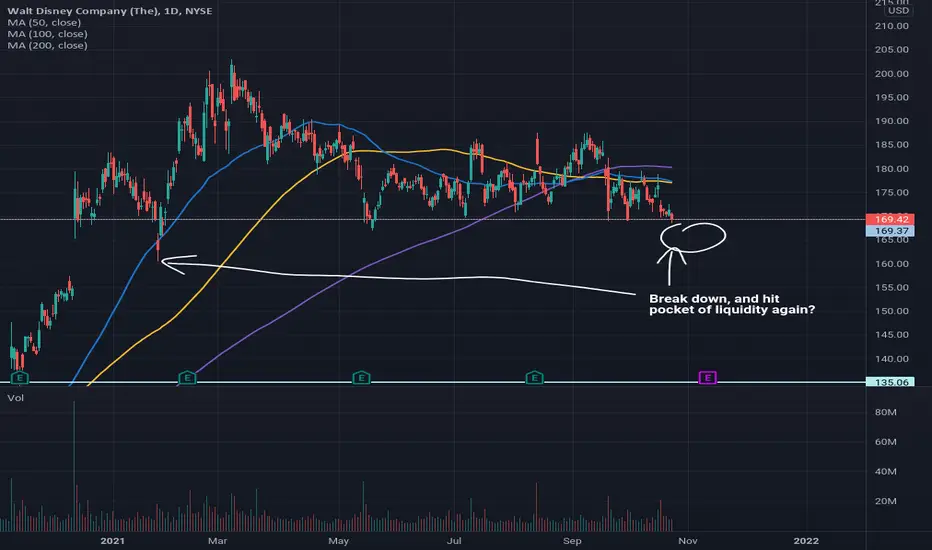
DIS potential bear trap?DIS can easily break down the strong strong support. But if the area below is a pocket of liquidity, we might have an opportunity to catch some trapped bears. Look at the bear trap in Jan. 2021. HMMMMMMM Looking delicious. Let's wait and see what happens this time.
I will try to see if I can include these potential traps in our Real Life Trading UK free week videos next week.

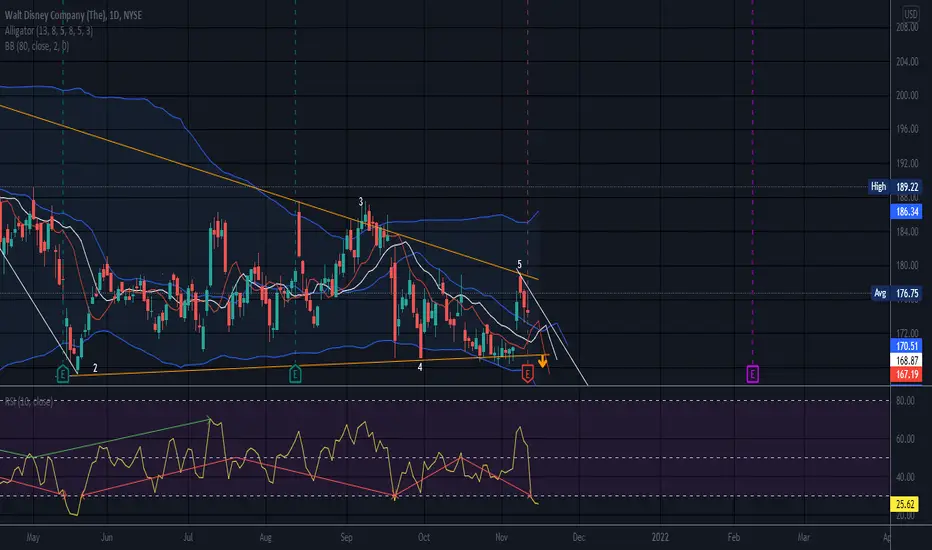
Downward Break from a Triangle.Earnings miss. DIS has done a nose dive at at least support levels and is dancing on a level that may or may not hold.
There is are support level(s) down below. I am not fishing and just watching for now because this could possibly fall again. I do not see a bear flag, yet, or signs of a dead cat bounce. It is just doing a unenergetic dance at this support level for now. If price stays above this level for a bit, and forms a bullish pattern, then I may bite. The next major support zone is too far below price for me to buy this now unless some bullish activity occurs.
Strong stock as a rule, I just want it at the right time is all. The symmetrical triangle it broke down from, if it follows the triangle targets which does not always happen depending on market sentiment, could take this lower. Often a support level can interrupt a pattern playing out or save a security from further demise. A sign of a bottom, like an inverse head and shoulders in the future would be a good thing.
This triangle shit the top trendline on touch 5 and did not break to the upside. Nothing is a given and price can stay in a triangle for quite a while. I have a short attention span and begin to lose interest if I am trying to go long and price hits the top trendline on the 5th touch and there is still no cigar )o: This could be called a descending triangle as the bottom trendline is fairly flat with a very slight slope to the upside noted. Does not really matter, as price can break UP or DOWN from any triangle, and this one broke down.
One can guesstimate targets by measuring the wide end of a triangle and projecting it up or down from the trendline. For a downward break, I project it from the top trendline downward beginning at the last touch of the top trendline. There are more than one way to measure targets and we are all different. There is always the possibility it will fall to a lesser fib level of that projection, or an extension of that projection as well. It can depend on the security and market timing.
The alligator is indicating a down trend still in progress.
Oversold today on daily RSI. It is possible for Oversold conditions to persist for extended periods of time, especially if there is a lot of supply at this level.
No recommendation but will I revisit this if something changes (o:
Disney fell on earnings. Is it a bargain stock now?Hi everyone,
[ symbol="NYSE:DIS"]NYSE:DIS fell 7% last Thursday after the Q3 earnings report.
Is it cheap enough to buy now?
Let's find out.
Earnings disappointed investors with reported revenue being off for 1.4% from the estimates (bullsh*t analysis).
Consequently, price bounced from 158 level support, but it came back down and is threatening this trend line now.
Just reminding you that pre-pandemic price level was around 150 .
Is the company doing worse now then before the virus?
Well, yes. It does.
Q4 2019 revenue, just before the virus outbirst, was reported at 20 billion.
Now, almost 2 years into recovery, Q3 yields 18.5 billion.
Trading off pure fundamentals, I would not invest in this company.
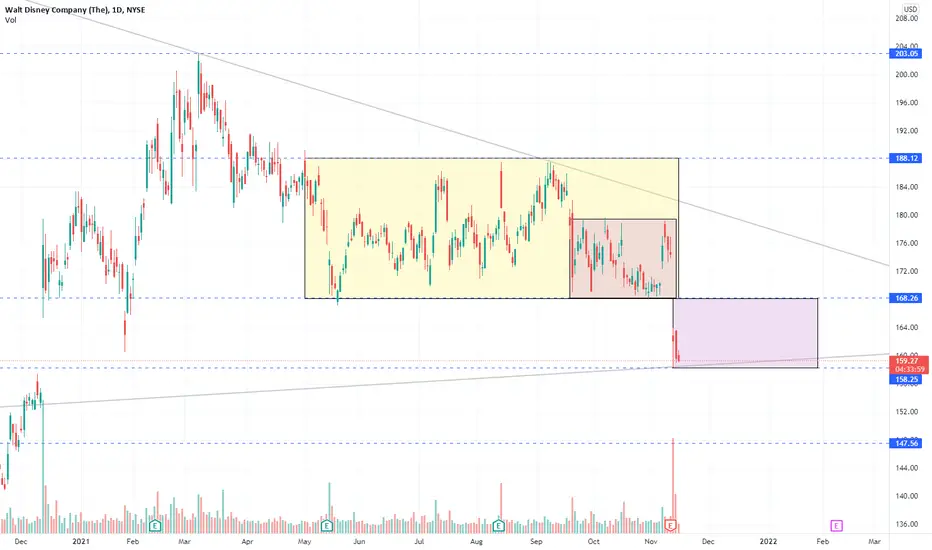
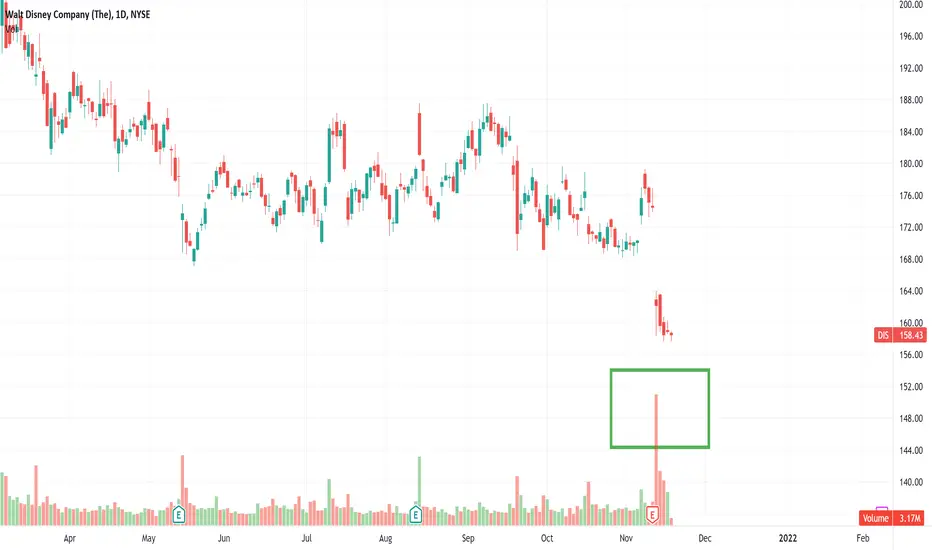
Trading purely off technical indicators, however, I would not be surprised to see the price consolidate in the projected box around the trend line support.
If it accumulates enough power at the trend line with low volume, it will burst out higher again.
I personally classify this stock as a risky one. Trade it at your own risk.
As always, trade wisely and good luck!
-----------------------------------------------------------------------------------------------------------------
Disclaimer!!!
This is not financial advise