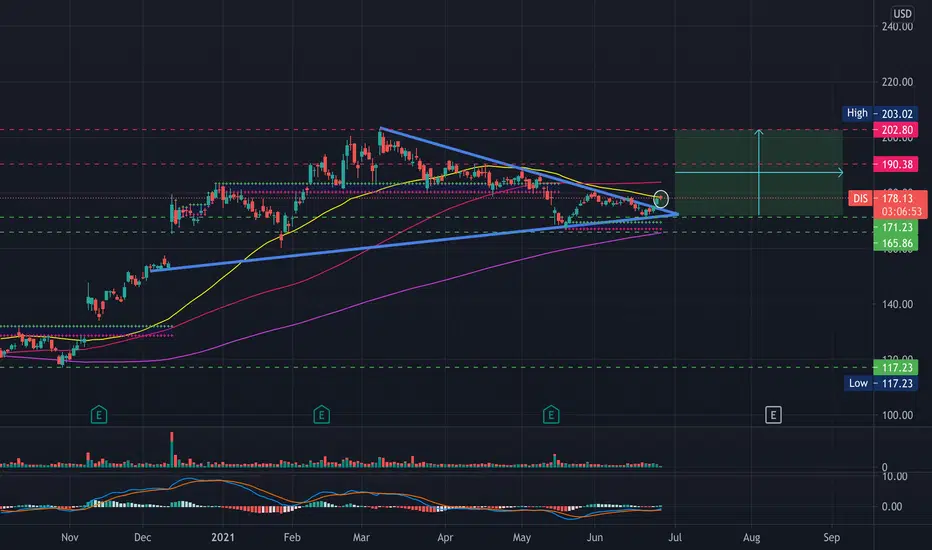
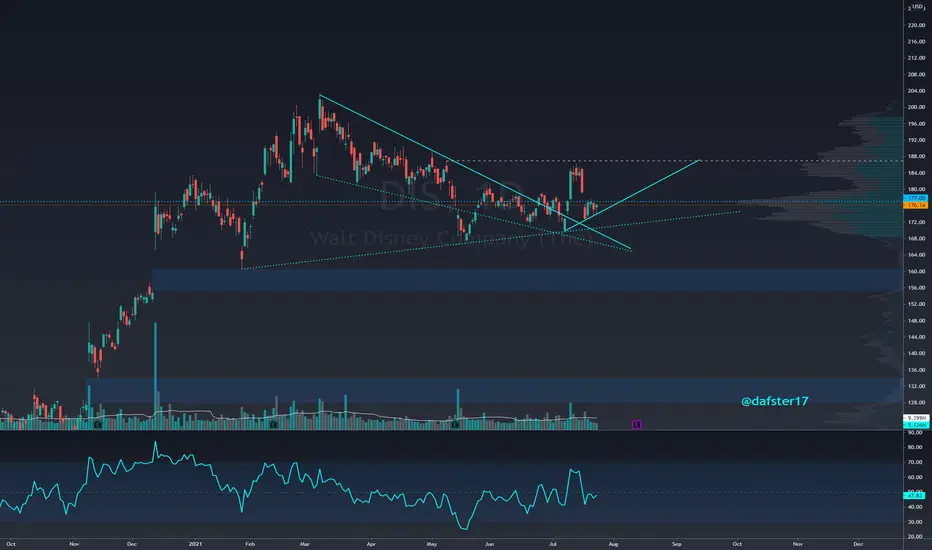
8/2 DIS(1) blue tunnel has been broken out, and resistance worked for the past 2 weeks
(2) pink line still a support to me
DIS trade ideas

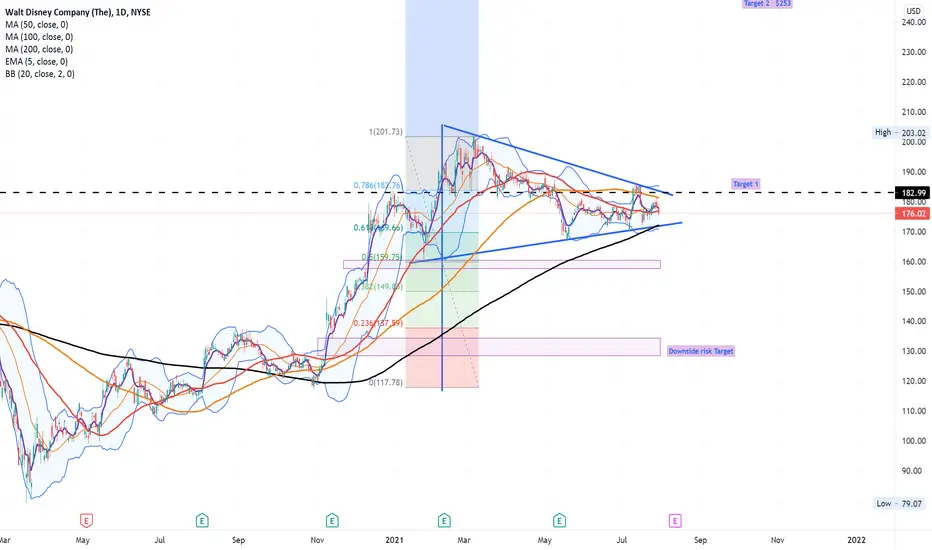
DIS LongDIS is forming a Bullish wedge and will soon to break.
200 MA is at 172.00 range and will be strong support.
Would be an EWT Wave 3 on a weekly view if it breaks up.
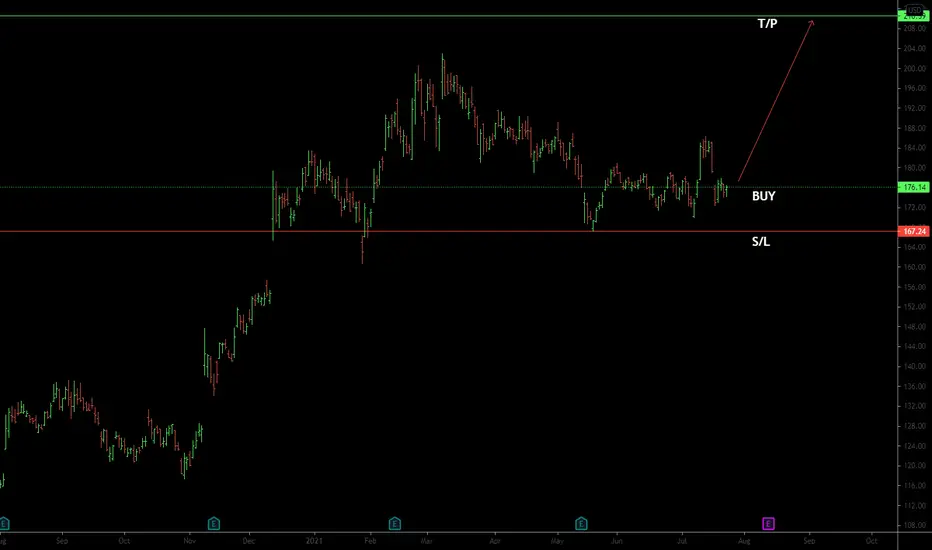
Entry level near $175.19 or $172.25
Stop Loss: $170.30
Upside Target # 1 (Resistance): $182.99 (Risk/Reward 5.5X, dollars at risk $2K)
Upside Target #2 (1.6 Fib): $253.08 (Risk/Reward 41X ; dollars at risk $2K)
$2,000 at risk on a $176K purchase
If 170 breaks, fill the gap at $130 target. Actually 2 gaps below.
Alternatively buy DIS 178 Calls time interval based on pivots and VOL
tradingview.sweetlogin.com
tradingview.sweetlogin.com
DIS
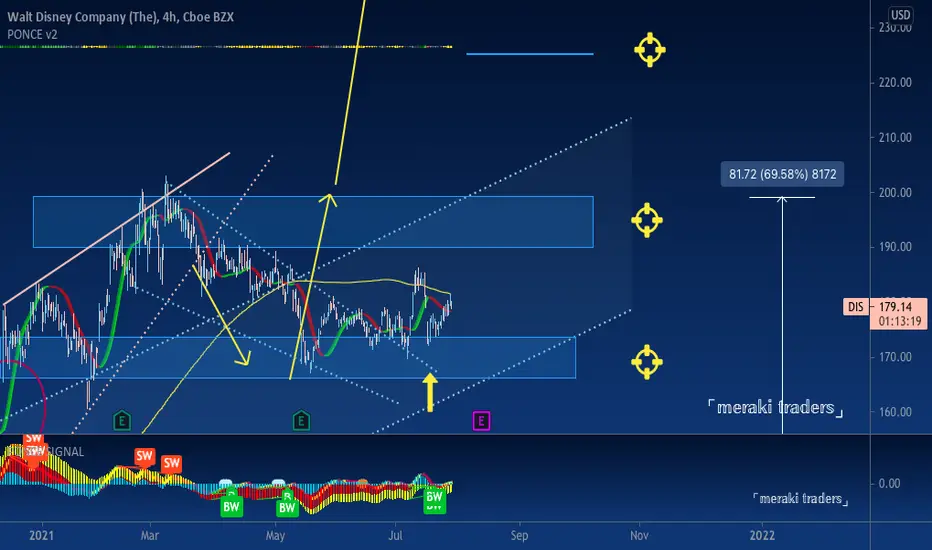
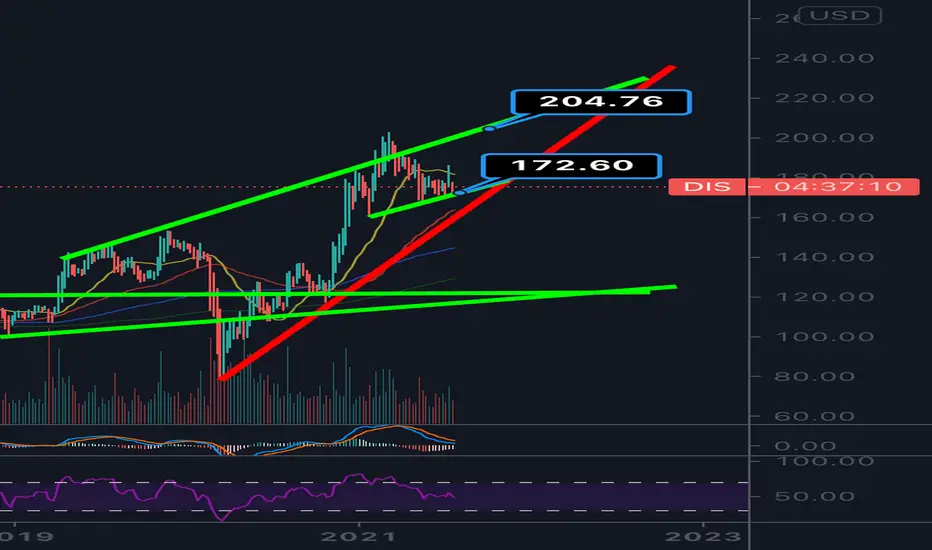
Remain the support on $165-$170, bounce, maybe in the next days-weeks Disney up to last high and reach the next target on $220
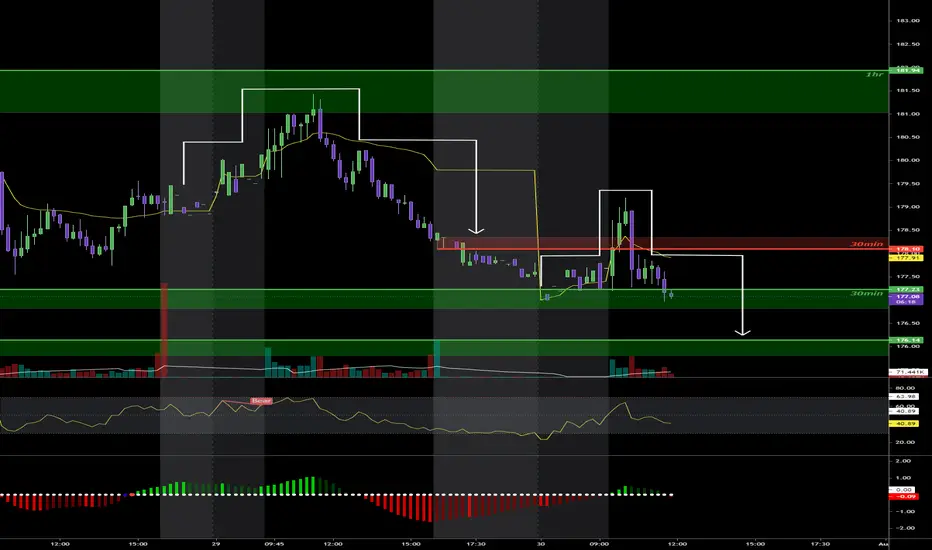
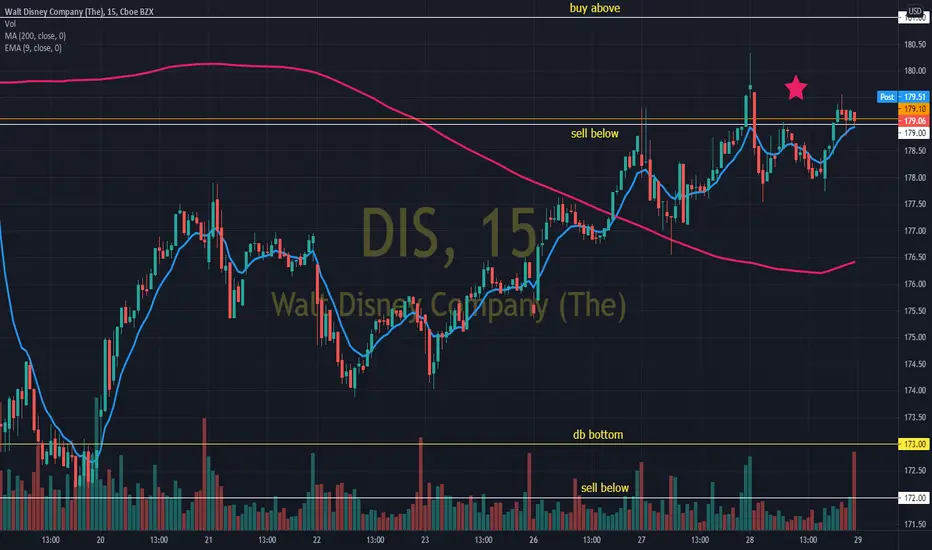
strategy for DIS THURSDAY 07/29/2021DIS implied volatility is trending higher. Price to buy is 181.00 bullish continuity. with supply zone at 186.29 and 187.00 very carefully.
Entry of the beginning of the downtrend, the preco is 179.00 below finding a double bottom at 173.00
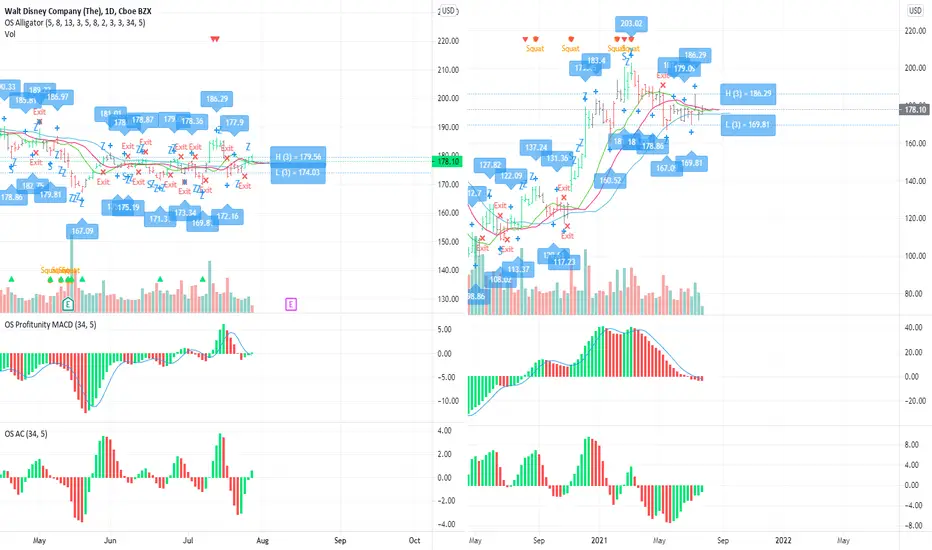
Short DIS below 169.81New weekly fractal at 169.81 with a VERY flat alligator.
Going short if price reaches 169.81.

Long DIS above 186.29New weekly fractal with a VERY flat alligator on the dailies.
Going long if price exceeds 186.29.
Disney Setting up for something large Disney is to be slowly increasing regarding its Stoch Oscillator, indicating gradual bullishness. Not only is the Stoch indicating bullishness, but the squeeze indicator shows decreasing bearish momentum. My Price Targets are 190 and 200 if we get the squeeze that is to be expected.
Bullish Signals
-Stoch Oscillator
-Squeeze Indicator
Price Targets
-1st 190
-2nd 200


BUY DIP ON DISNEYTry to use the triangle and SMA 200 to find trading opportunities.
I think its very likely that the stock will blow up in Mid-September.
In the meantime you can slowly build your position or make some trades in the range.

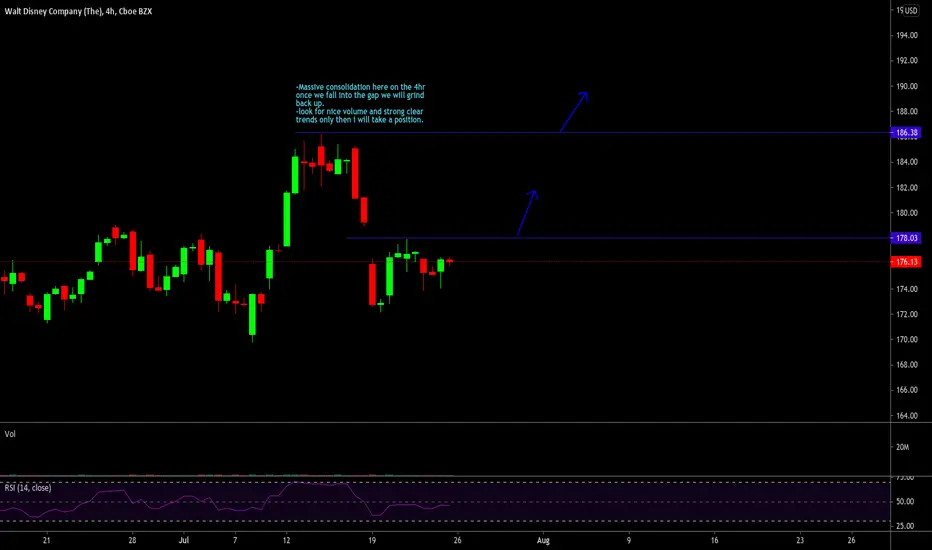
$DIS about to make some crazy moves!-Massive consolidation here on the 4hr once we fall into the gap we will grind back up.
-look for nice volume and strong clear trends only then i will take a position.
$DIS - Getting ready for its final move?Disney is on wave 5 from the covid lows. Its sitting on 2 AVWAPs and was rejected off another AVWAP. It tested the DTL from the wave 3 high after being rejected at the AVWAP of the wave 3 highs. There's currently a volume shelf at 175-176 where it has been consolidating.
All signs point to a large move up, especially with Marvel phase 4 starting up, the charismas movie season coming and Disney plus showing strength in programing.
Invalidation below a daily close of 167, confirmation above daily close of 202.

Great bullish setupNYSE:DIS
Huge move last week to get stuffed when the market pulled back. Holding the new trend for now. Gap overhead with earnings a few weeks out. Yes parks have been closed & opening slowly.
Dont count out DIS+
DisneyWhat a great run. Although we could be sitting at support. It’s possible we are creating a bear flag here. I see a rising wedge in Disney we have been respecting quite a bit. If we were to lose 170$ and close below we could
Be looking at some serious downside. 161$ would be rising wedge support line If we bounce here we have 21 weekly EMA resiatnce at 181-182 with the upper rising wedge resiatnce around 204 If a long was to be placed here, we need stoplosses below 169. Could open shorts if we lose 169 ANd CLOSe CANDLE BODIES BELOW
DISNEY: Looks bullish to me. Longer term they appears to be much more upside possible. My personal stop is close < 169. But process your way.
Take care. Have a great up coming weekend.
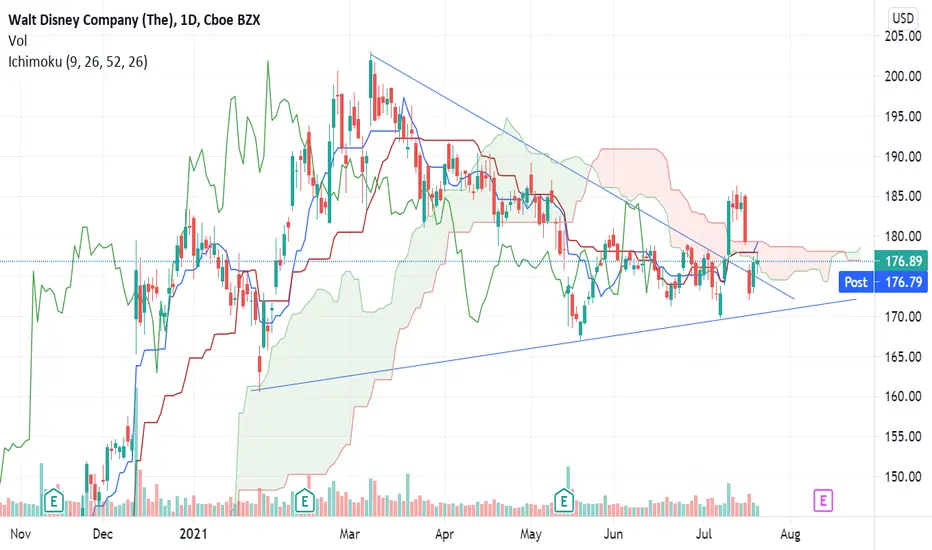
DIS rebound from bullish pattern ,above cloud should run.DIS rebound from bullish pattern ,above cloud should run.
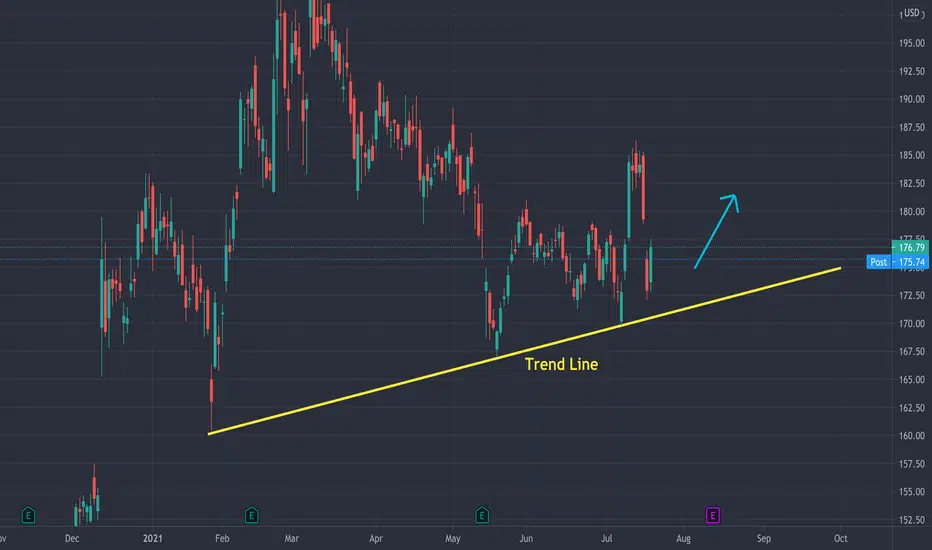
Disney Even Higher Hello Traders
We can see Disneys price pulling up against the trend line every time the price is near.
Im looking Bullish until we reach upper Resistance Price 185 can be set as our first Target.

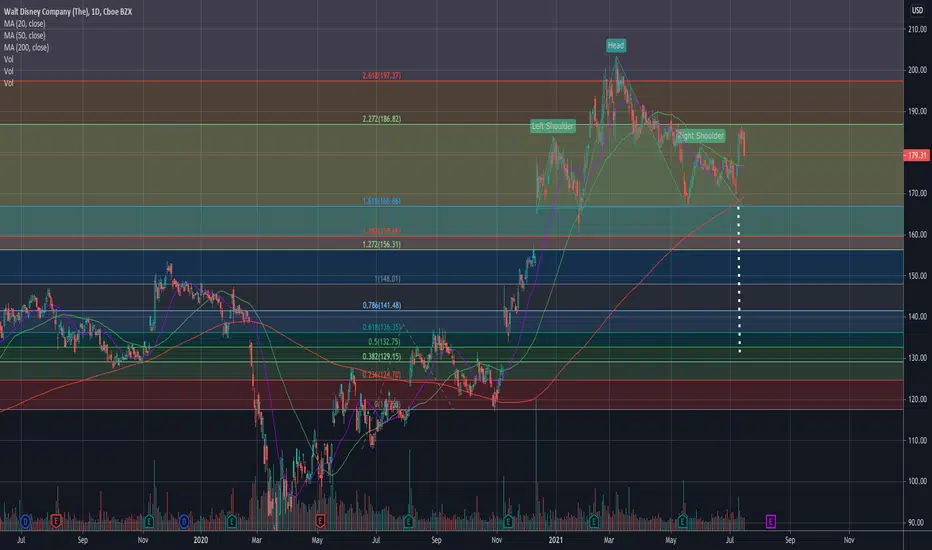
$DIS - Trying to break free (invalidate) from head & shoulderTrying to invalidate or break free from head & shoulder.
Neckline - $166 - $167
Break above, $186 is bullish
Break below $166 is bearish and it could lead to $156.
———————————————————
How to read my charts?
- Matching color trend lines shows the pattern. Sometimes a chart can have multiple patterns. Each pattern will have matching color trend lines.
- The yellow horizontal lines shows support and resistance areas.
- Fib lines also shows support and resistance areas.
- The dotted white lines shows price projection for breakout or breakdown target.
Disclaimer: Do your own DD. Not an investment advice.
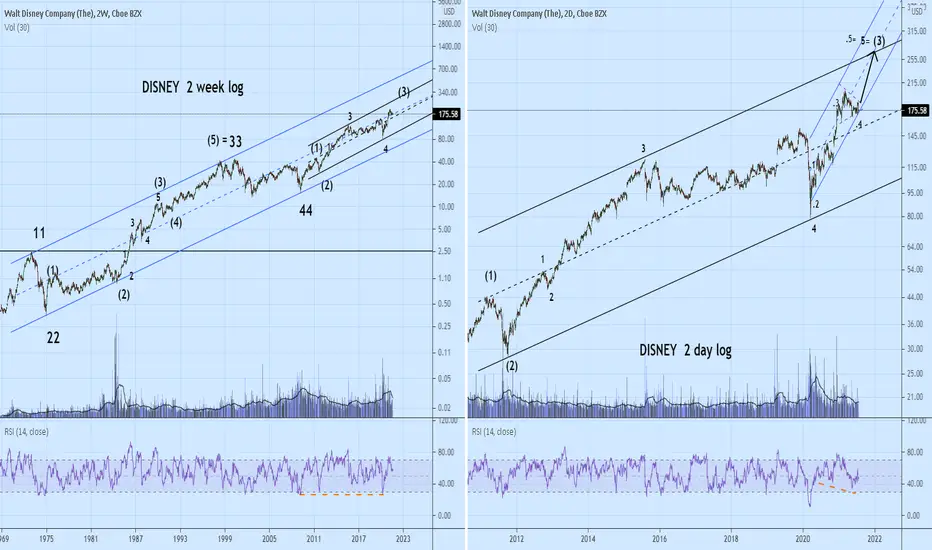
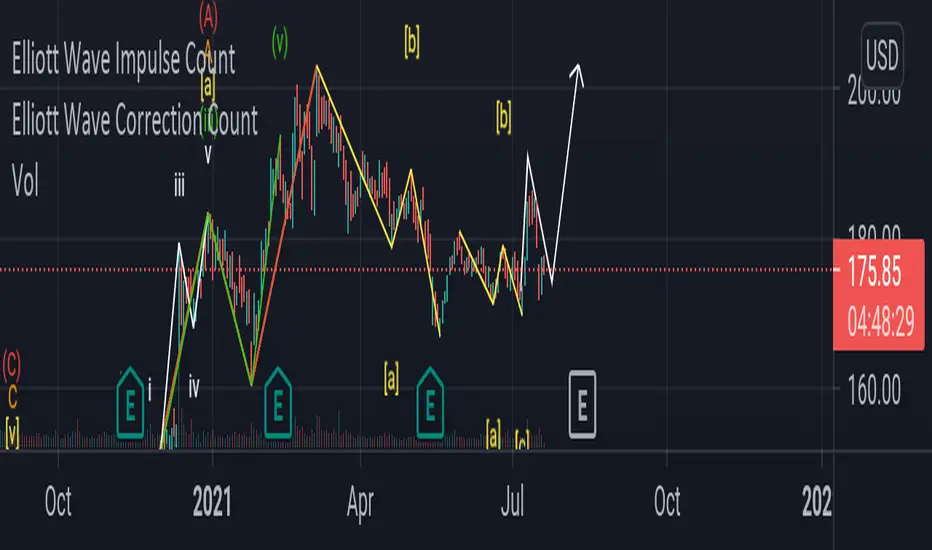
DIS 5 wave upDisnet 5 wave up expect to 3 wave pullback arround fib 50-61.8 and then contonue bullish

Breakout- watching closelyWatching DIS closely here and looking for a breakout-
- Starting to break above a long-term downtrend and forming somewhat of a triangle
- Bollinger Bands squeezing (not pictured)
- Falling wedge on shorter timeframes (not pictured)
- Buyer volume starting to pick up
- Earnings on 8/10'